Looks like no one added any tags here yet for you.
Criteria for establishing causality: Jon Stuart Mill
We can only argue that B is caused by A if:
There is a relationship between A and B (association)
B bust take place after A (appropriate time order)
The association between A and B is not explained by other factors (elimination of alternative explanations)
Eliminate alternative explanations
Can (in part) be achieved by controlling for other variables → eliminate their effect
Two ways:
Experimental control
Statistical control
Eliminate alternative explanations: Experimental control
In the research design
RCT often considered the gold standard
Time order manipulated (Crit. 2)
Alternative explanations (partially) excluded through randomization (Crit. 3)
Both observable and non-observable characteristics must be equal
→ Feasible and realistic?
Eliminate alternative explanations: Statistical control
In the data-analysis strategy
Option 1: Examine x-y relationship within subgroups (based on other variables) → often unrealistic
Option 2: include alternative explanations in your statistical model
Multivariate associations
Important to recognize relevant alternative explanations → Know your theory
And adjust your statistical analyses and interpretation accordingly → Know your statistics
So that you can avoid biased results due to lurking variables: Variables that are not included in a study, but do explain or influence the association under study
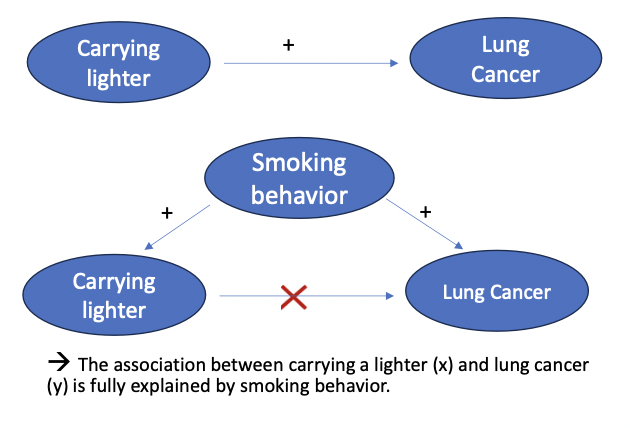
Multivariate associations: Spurious associations
When both variables are also related to a third variable and the association between x and y disappears (mostly) when controlling for this third variable
→ Estimated association between variables can thus change dramatically depending on the data analysis strategy
Association between x and y disappears
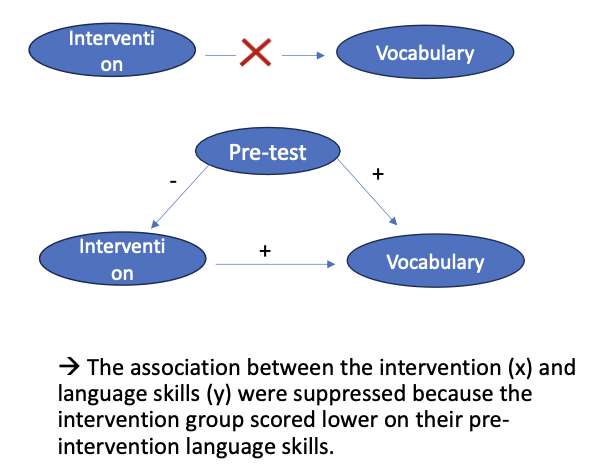
Multivariate associations: Suppression
Sometimes we find (almost) no association between x and y until we control for a third variable
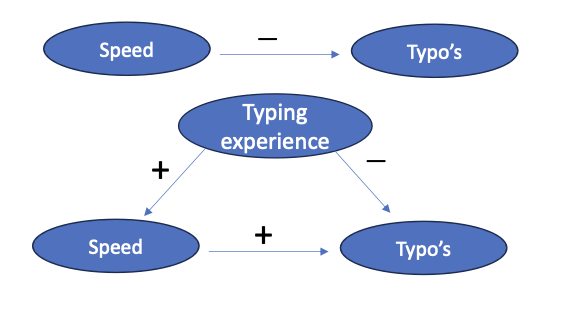
Multivariate association: Simpson’s paradox
Sometimes the relationship between x and y is even reserved within levels of a third variable
Example: Typing speed and typo’s
→ On average: negative association - Experienced typists type faster and make few typos
→ At the individual level: Positive association - the faster you type the more typo’s you make
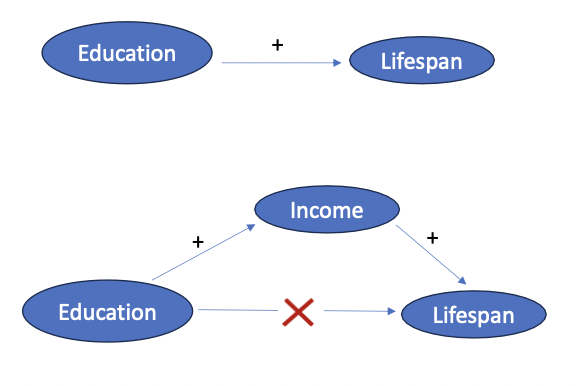
Multivariate associations: Chain relations
Another reason for a disappearing association between x1 and y when controlling for x2 is a chain relation (mediation):
x1 has an indirect effect on y, via mediator x2
In other words:
x1 causes x2
x2 causes y
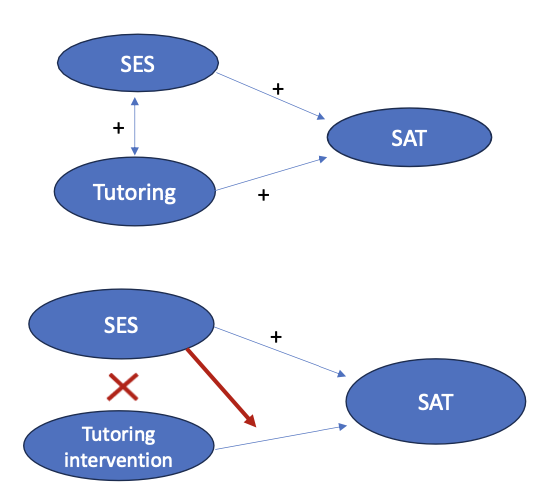
Often a research topic in intervention studies:
→ Important to identify the ‘working mechanisms’ of an intervention
Example: The association between years of education and lifespan (x1) disappears or weakens when we account for income
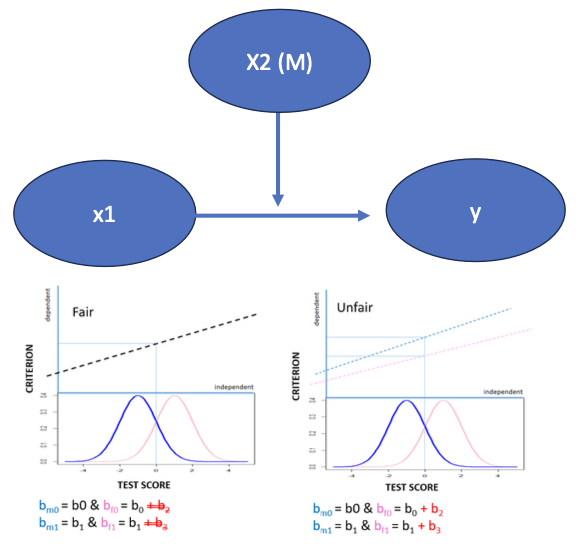
Multivariate associations: Statistical Interaction
In addition, we often see interaction effects between predictors: The association between x1 and y differs across levels of x2
Various options:
No association between x and y
But it does exist at subpopulations based on x2.x1
For example: Positive and negative effects in subpopulations cancel each other out.
Positive association between x and y
But different strengths or even negative/non-existing within subpopulation based on x2
Negative association between x and y
But different strengths or even positive or non-existing within subpopulation based on x2
Again: The average x – y association does not necessarily reflect the association in all subpopulations!
Multivariate associations: Multiple causes
However, differences in a criterion variable usually have multiple causes:
Several variables together explain differences in y
These predictors are mostly correlated:
This is called confounding.
The estimated association between x and y changes when an extra x is added to the regression model.
For example, for spurious associations, suppression and Simpson’s paradox.
And sometimes not correlated:
The estimated association between x and y does not change when the extra x is added to the regression model.
Nevertheless, there may be statistical interaction