Lecture 08: Parasitism
1/103
There's no tags or description
Looks like no tags are added yet.
Name | Mastery | Learn | Test | Matching | Spaced | Call with Kai |
|---|
No analytics yet
Send a link to your students to track their progress
104 Terms
What is the lifecycle of the hairworm (Nematomorpha) and how does it involve crickets?
Adult hairworms live in freshwater (ponds, streams), where they mate and lay eggs.
Larvae hatch in water and must enter a terrestrial insect host (often a cricket, but sometimes grasshoppers or beetles).
Larvae enter the host indirectly — for example, when the cricket drinks contaminated water or eats another infected insect.
Inside the cricket, the larva grows into a long, thread-like adult worm, feeding on the host’s internal nutrients.
When mature, the worm manipulates the cricket’s behavior, causing it to jump into water — an environment lethal to the cricket but essential for the worm.
Once in water, the worm emerges from the cricket’s body, mates, and restarts the cycle.
What is the lifecycle of Toxoplasma gondii and how does it manipulate its hosts?
Toxoplasma gondii is a protozoan parasite with a complex lifecycle involving cats (definitive hosts) and many warm-blooded animals (intermediate hosts, including humans and rodents).
In cats:
Parasite undergoes sexual reproduction in the intestinal lining of cats, producing oocysts.
Oocysts are shed in cat feces and become infectious after a few days in the environment.
In intermediate hosts (e.g., mice, humans):
Infection occurs by ingesting oocysts (from soil, water, food) or tissue cysts (in undercooked meat).
Parasites form tissue cysts in muscles, brain, and other organs, remaining dormant but viable for life.
Behavioral manipulation (in rodents):
Infected rodents lose their innate fear of cats, becoming attracted to cat odor, increasing the chance of being eaten.
This benefits the parasite by returning it to the cat host, where sexual reproduction resumes.
In humans:
Infection is usually asymptomatic, but can cause severe illness in immunocompromised people and fetal defects if contracted during pregnancy.
Direct life cycle of parasite examples
Nematodes (aka roundworms) such as the Guinea worm and the caribou parasite Ostertagia gruehneri
Direct Life Cycle of parasite means
the parasite completes its entire development within a single host species, without needing an intermediate host.
Transmission occurs directly from one host to another, usually through ingestion of infective stages (eggs or larvae) in the environment.
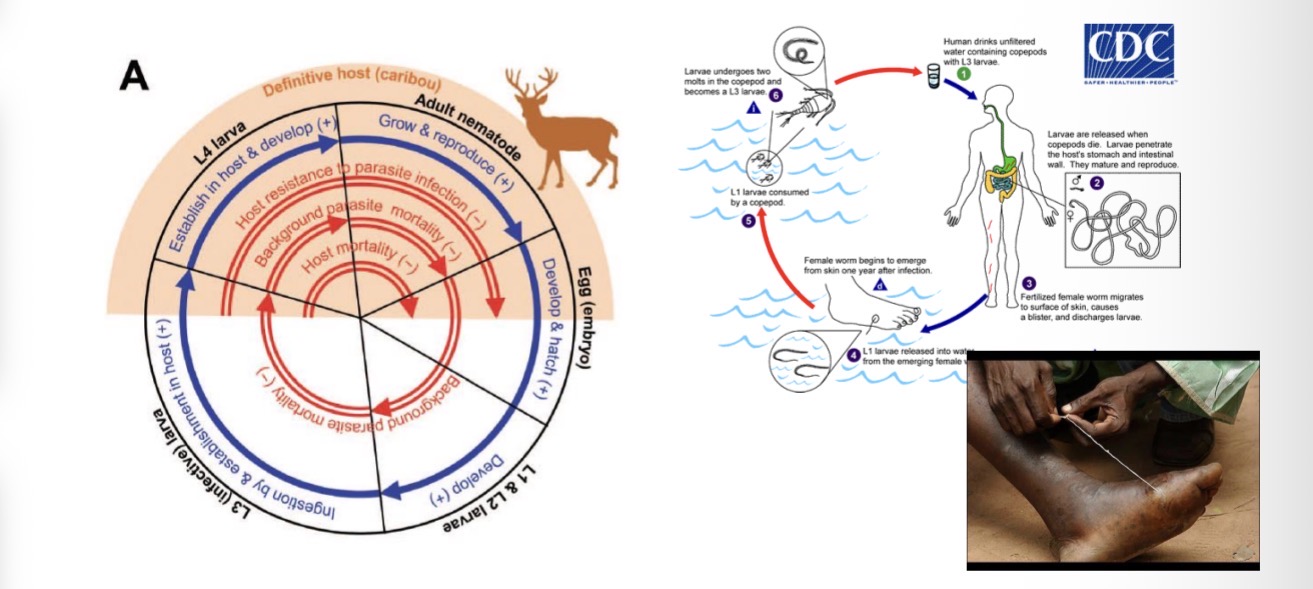
Direct Life Cycle of Ostertagia gruehneri (Caribou Parasite)
1. Adult stage (inside caribou):
Adult worms live in the abomasum (the 4th stomach) of the caribou.
They lay eggs, which are passed out in the caribou’s feces.
2. Development in the environment:
In the feces, the eggs hatch into first-stage larvae (L₁).
These free-living larvae molt into L₂, and then into the infective L₃ stage.
The L₃ larvae survive in the environment and crawl onto vegetation.
3. Infection of new host:
When another caribou grazes, it accidentally eats the infective L₃ larvae on the grass.
The larvae then enter the new host’s abomasum.
4. Development inside caribou:
Inside the abomasum, the larvae either:
Develop immediately into adults, or
Pause as L₄ larvae (a state of arrested development) — often overwintering and resuming development the next spring.
5. Maturation and egg-laying:
Once mature, the worms produce eggs again — completing the cycle entirely within caribou and the external environment, with no intermediate host involved.
Only 2 parasitic diseases to be completely eradicated from planet Earth
Smallpox: A viral disease that was declared eradicated in 1980.
Rinderpest: A viral disease affecting cattle and other ruminants, which was declared eradicated in 2011.
Guinea worm
Close to being completely eradicated but people are contemplating on whether or not humans are the only hosts (could be ox as well)
Indirect parasites life cycle meaning
the parasite requires one or more intermediate hosts (in addition to the definitive host) to complete its development.
The parasite changes form or stage (e.g., from larva to adult) in different host species.
Transmission occurs when the definitive host becomes infected by eating or being bitten by an infected intermediate host.
Example of indirect parasite life cycle
Trematodes (aka flatworms) such as Ribeiroia ondatrae and Schistosoma Mansoni
Tapeworms
Tapeworms (e.g., Taenia spp.)
Intermediate host: Pig or cow — where larvae form cysts in muscle.
Definitive host: Human — eats undercooked meat containing cysts → adult worm develops in intestines.
Ribeiroia ondatrae
Definitive hosts: Birds (and sometimes mammals) — adult flukes reproduce in their intestines and release eggs in feces.
First intermediate host: Freshwater snail — eggs hatch into miracidia, which infect snails and develop into cercariae.
Second intermediate host: Amphibians (like frogs) — free-swimming cercariae leave the snail and encyst as metacercariae near developing limbs of tadpoles.
Infection causes limb deformities, making frogs easier prey for birds.
When the bird eats the frog, the parasite matures in the bird’s intestine — completing the cycle.
Key idea: Manipulates host (frog) to increase predation by the definitive host (bird).

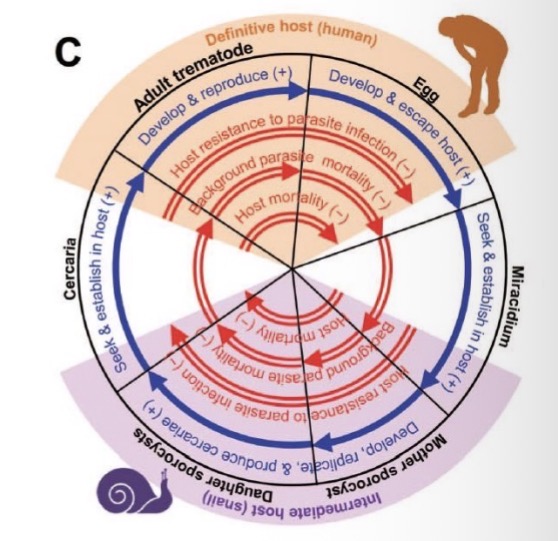
Schistosoma mansoni
Definitive host: Human — adult worms live in blood vessels near the intestines. They reproduce sexually and release eggs, which exit via feces.
First intermediate host: Freshwater snail — eggs hatch into miracidia, which infect snails and develop into cercariae.
Infection of humans: Free-swimming cercariae leave the snail and penetrate human skin during contact with contaminated water.
Inside the body, they migrate to blood vessels, mature into adults, and produce more eggs.
Key idea: Requires snail intermediate host and human definitive host — no second intermediate host.
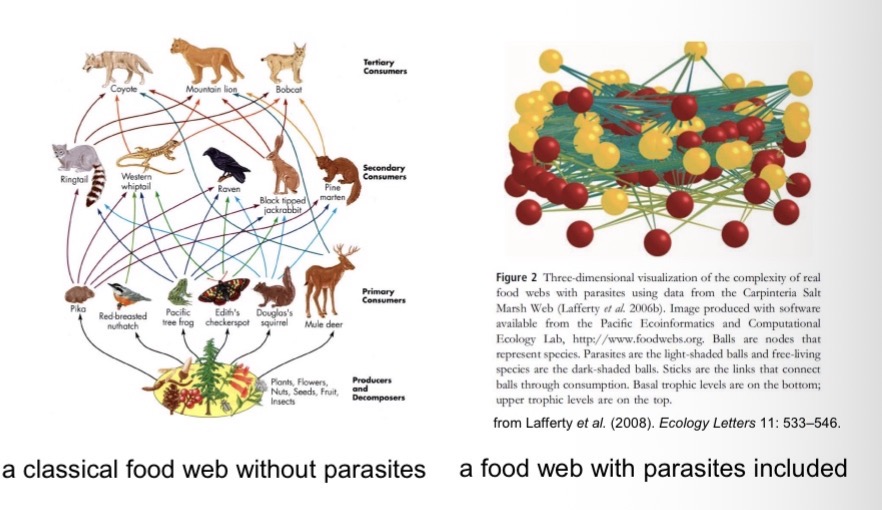
Why Study Host-Parasite Systems?About Half of All Species on Earth are Parasitic.
Most species are attacked by multiple parasite species.
Most species also typically have at least one parasite species that specializes on them. As a result, roughly 50% of all species on Earth are parasitic.
Their influence on ecosystem dynamics is often underestimated.
Symbionts:
Organisms that live in or on other organisms.
Some symbionts are mutualists, but
the majority are parasites.
A parasite
consumes the tissues or body fluids of the organism on which it lives (the host).
Pathogens
are parasites that cause diseases
Macroparasites
can typically be seen with the naked eye or through a basic microscope (e.g., arthropods, helminths);
Ectoparasites
live on the outer body surface of the host.
Microparasites
are too small to be seen with the naked eye (e.g., bacteria, protists, unicellular fungi, viruses).
Endoparasites
live inside their hosts, within cells, tissues, or the alimentary canal
are viruses a parasite
Yes
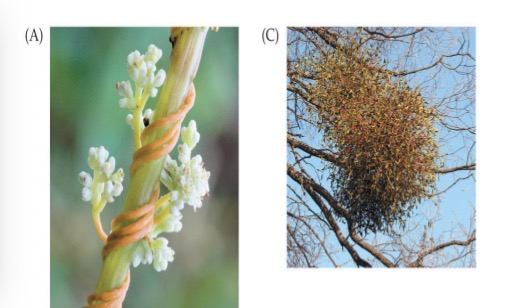
Plant ectoparasites of plants
e.g., dodder, mistletoe…
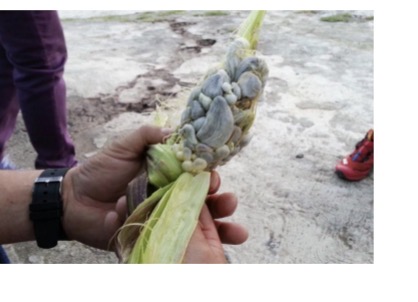
Fungal ectoparasites of plants
e.g., corn smut fungus
Animal ectoparasites of plants
e.g., aphids, nematodes, beetles…
Ectoparasites of Animals
e.g., mosquitoes (arthropod; insect)
e.g., ticks (arthropod; arachnid)
e.g., sea lice (copepod)
e.g., fungi
e.g., leeches
e.g., lampreys (Fish parasite)
e.g., vampire bats (Mammal parasite)
Endoparasites of Animals & Plants
e.g., helminths (parasitic worms), such as cestodes (tapeworms), nematodes (roundworms), trematodes (flatworms), and acantocephala (thorny-headed worms)
e.g., bacteria, viruses and protozoa
Parasites Transmitting Parasites
e.g., tick-borne diseases, such as Lyme disease (caused by the bacterium Borrelia burgdorferi)
e.g., mosquito-borne diseases, such as the malaria-causing protozoan Plasmodium falciparum
Some parasites transmit
other parasites (often pathogens).
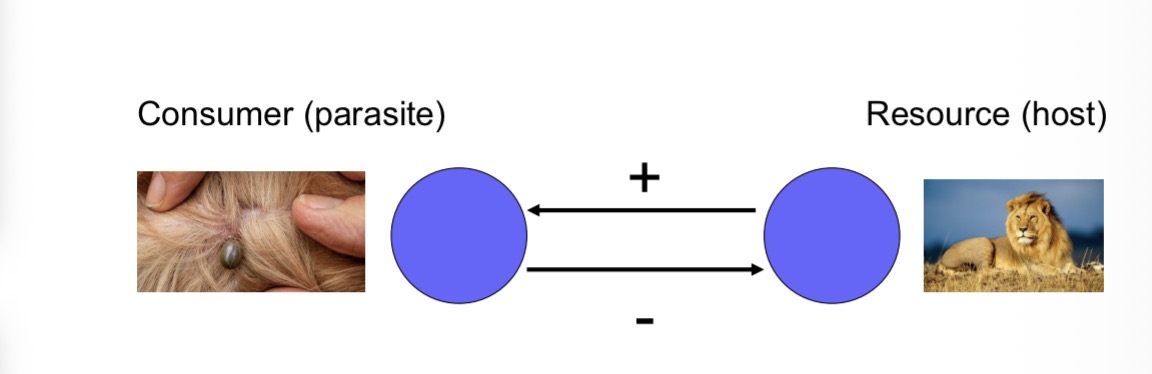
Parasitism is a form of exploitation.
As such, it is a +/- relationship: an increase in parasite abundance leads to a decrease in host abundance, while an increase in host abundance leads to an increase in parasite abundance.
Obviously no one wants to get a parasite
Hosts have adaptations for defending themselves against parasites; parasites have adaptations for overcoming host defenses.
Examples for host defenses
Protective outer covering (skin, exoskeleton)
behavioral avoidance
actions taken by hosts (humans or animals) to reduce contact with mosquitoes and thus lower the risk of infection by mosquito-borne parasites or pathogens.
Activity timing: Staying indoors or inactive during peak mosquito hours (dusk and dawn).
Biochemical defenses,
e.g., plant secondary compounds & animals eating plants to prevent/treat parasitism
Chimpanzees chew bitter plants (e.g., Vernonia amygdalina) that contain compounds toxic to intestinal worms
Humans use bug repellant
The host’s immune system
Defensive symbionts
mutualistic microorganisms (such as bacteria, fungi, or viruses) that live inside or on a host and protect it from parasites or pathogens.
Ex human gut flora
Examples for parasite adaptations to circumvent host defenses
e.g., specialized mouthparts to overcome outer barriers such as skin
Literally a mosquito
e.g., immune evasion
COVID was evolving to different variants that was over coming hosts (humans) immune systems and vaccines
No parasite life history is “perfect”
Different life histories have different advantages and disadvantages.
Different species have evolved to fill different niches
Advantages of ectoparasitism
Ease of dispersal
Safe from host immune system
Disadvantages of ectoparasitism
venerability to natural enemies
Exposure to external environment
Feeding more difficult
Advantages of endoparastism
Ease of feeding
Protected from external environment
Safer from natural enemies
Disadvantages of endoparastism
Vulnerability to host immune system
Dispersal more difficult
Host and parasite populations can evolve together, each in response to selection imposed by the other.
European rabbits were introduced into Australia in 1859.
The population grew exponentially due to a lack of natural predators.
Humans tried to get rid of rabbits by
Building fences
Biologically controlling the rabbits
Initial attempts to control the population failed spectacularly
building fences to confine rabbits to the East of Australia so problem does not spread to Western Australia too
However, Fences cannot be maintained over thousands of km. It will slow spread but not stop rabbits from going to western Australia
Biologically controlling the rabbits
Virus only kills rabbits (no risk of virus spreading to other species)
Myxoma virus introduced in 1950
Initially, 99.8% of infected rabbits died. → that 0.2 % of rabbits with some sort of resistance reproduced on their genes
Over time, the rabbits evolved resistance to the virus
The virus also evolved to become less lethal. This is because the virus has nothing to gain from killing the host (rabbit). It also wants to live on in its host, so it’s counterintuitive to kill its host.
In a virus’ ideal world, they don’t even want to make you sick. They want to exploit your resources without you even noticing so they can do it again for the next generation
Every time a host dies, they loose a resource that could be exploited
New strains are constantly needed for rabbit control
HIV
Has been around for 50 yrs
Mortality drops to 0 if you take the drugs, but if you don’t take medication, HIV becomes as lethal as always has been
It is not evolving because there is a very long asymptomatic period, where without tests, the hosts can’t know they are sick
The parasite can be passed on during that time period
Little pressure for parasite to change its lifestyle because its doing fine as it is
Parasites can reduce their hosts’ rates of survival, reproduction, and population growth.
muskox population crashes in the Canadian Arctic
perhaps due to infection with the bacterium Erysipelotrix rhusiopathiae (common in pigs and other farm animals)
Muskox were killed due to the infection
Parasites can reduce their hosts’ rates of survival, reproduction, and population growth.
a sexually transmitted mite affecting the fecundity of ladybugs
The mite was impacting the viability of lady bug’s eggs.
the Plague killing 30-60% of the European population in the mid-1300s
If parasite is impacting the growth or reproduction of a species, these are the two things we need for population growth, therefore population will decrease
Parasites can regulate a host’s population dynamics.
host-parasite cycles due to the effects of the nematode T. tenuis on the birth rates of grouse
When infection levels are high, the worm:
Reduces the grouse’s health,
Lowers reproduction (fewer chicks), and
Increases mortality (weakened birds die more easily).
So the parasite directly affects how many grouse survive and breed.
High host density → parasite spread increases → host population declines → parasite numbers fall → host rebounds.
We can tell the parasites are the cause of this because when we take the parasites out of the population, it is dampening the population cycles
Parasites can drive host populations extinct and reduce the species’ geographic range.
The American chestnut was once among the most common trees in North America.
Chestnut blight fungus, introduced in 1904 from Asia, killed as many as 3-4 billion trees in the first half of the 20th century.
Today, the tree is considered critically endangered in its natural range.
By affecting the performance of host species, parasites can alter the outcome of species interactions (e.g., competition, predation,…).
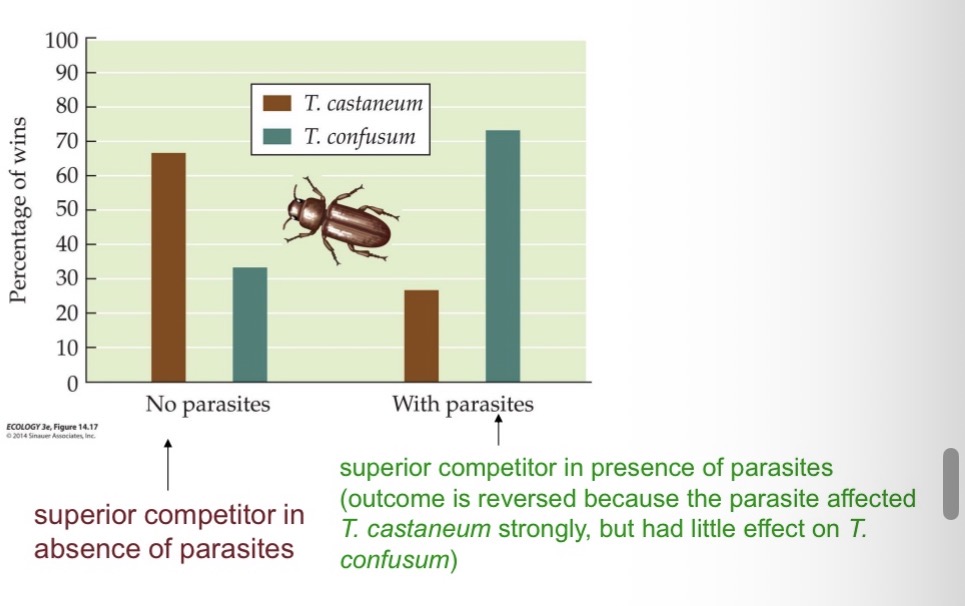
A protozoan parasite can reverse the outcome of competitive interactions in two species of flour beetles.
When the parasite was absent, Tribolium Castaneum typically outcompeted T. Confusum; with the parasite present, the outcome was typically reversed
How does the brain worm Parelaphostrongylus tenuis influence competition between moose and white-tailed deer?
Moose are normally superior competitors to white-tailed deer.
White-tailed deer often carry the brain worm Parelaphostrongylus tenuis without showing symptoms.
The infection is fatal for moose, giving deer an indirect advantage.
This parasitism alters the competitive balance and allows moose and deer to coexist, since the parasite limits moose populations.
The parasitic nematode Trichostrongylus tenuis and its host display regular population cycles. Outline three possible mechanisms that may lead to host-parasite cycles.
Predators
Parasites
Herbivory / plant
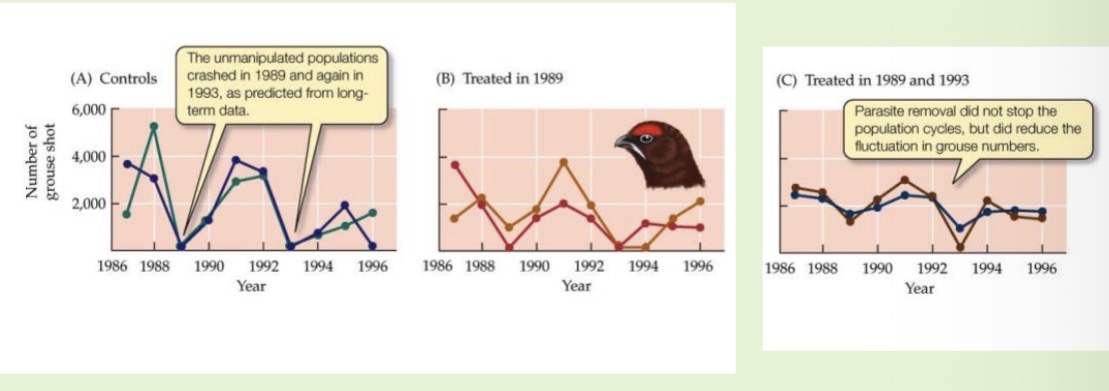
The parasitic nematode Trichostrongylus tenuis and its host display regular population cycles. Design an experiment to determine which of these mechanisms explains the cycles shown below.
Exclusion and control plots

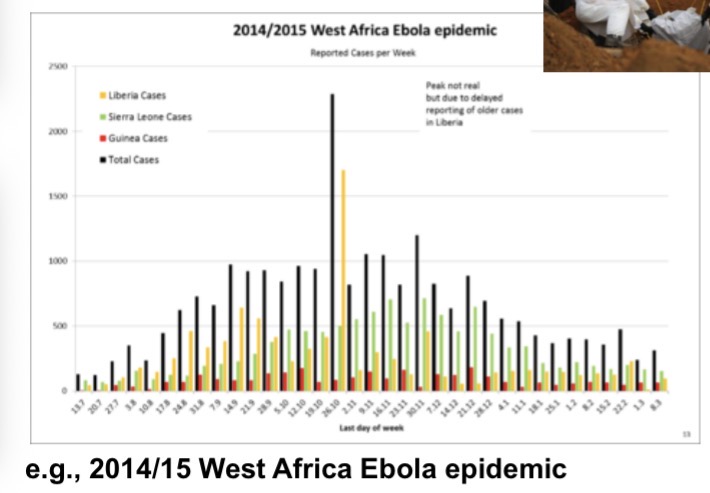
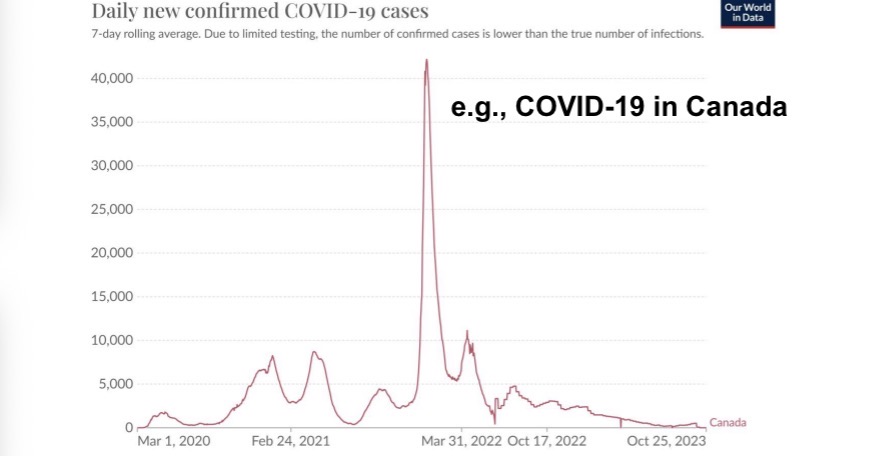
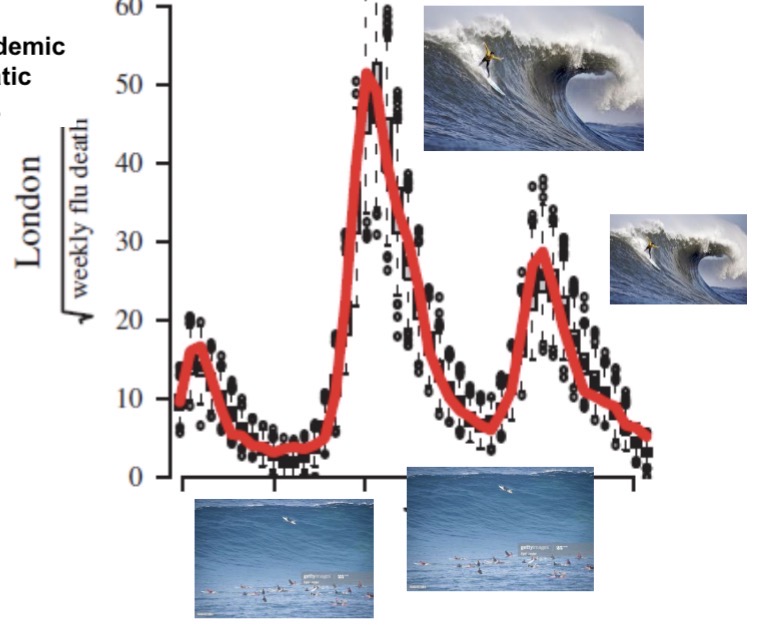
Epidemics often follow a similar course:
beginning slowly and then accelerating until the number of cases peaks before they decline again
Looks like ‘wave’
Subsequent “waves” of infection can occur IF, for some reason,
transmission rates increase again after the previous wave (e.g., due to relaxing physical distancing) AND IF enough susceptible people remain in the population after previous waves (e.g., because of a lack of exposure or because of waning immunity) or are newly introduced (e.g., via births).
Usually waves happen in the summer time because politicians would say something like “we don’t need to worry about covid until the winter, because virus will transmit better in cold dry air. So we don’t need to worry in summertime”
Rise of cases because of temperature, humidity or lack of
To get a first feeling for the dynamics of an epidemic, let us look at one of the simplest cases: influenza spreading in a closed population with zero mortalities occurring. Specifically, we look at the classic case study of influenza in an English boarding school.
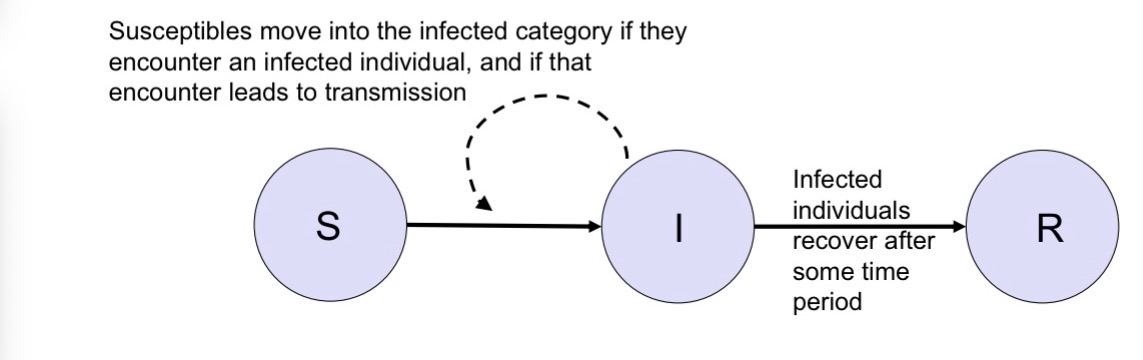
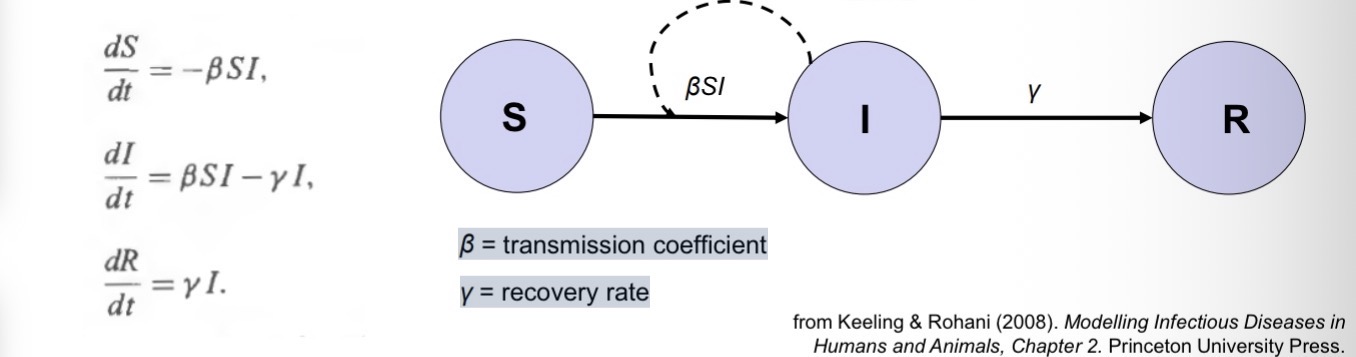
We are interested in modelling the numbers of susceptible (S), infected (I), and recovered (R) individuals over time.
For example, we might have a scenario where an epidemic begins with one infected individual (I(0)=1) in an otherwise completely susceptible population (S(0)=S0) where no one has any pre-existing immunity (R(0)=0).
Let’s begin by dividing the host population into susceptible (S), infected (I), and recovered individuals (R).
Infected individuals infect susceptibles at a rate that depends on how often they come into contact with one another. After some time, infected individuals recover.
Susceptibles move into the infected category if they encounter an infected individual, and if that encounter leads to transmission
Infected individuals recover after some time period
Someone goes from suseptable to infected stage
Subtract one person from the S and add one person to the I
To go from suseptable to infected,
You need to meet an infected person and then get infected by them
That’s the dash line → influence of how many infected people I have on to infection rates and how quickly people go from one category to the next

After recovering people move from
Infected to recovered
dS / dt =
-rate at which susceptible individuals get infected
dS/dt is negative because
S represents the number of susceptible individuals in the population.
When people get infected, the number of susceptibles decreases.
dI/ dt =
+ rate at which susceptible individuals get infected - rate at which infected individuals recover
dR/dt =
+ rate at which individuals recover
The per capita rate at which individuals recover, γ,
is the inverse of the average period for which an infected person is infective.
The total rate at which infected individuals recover is
γI
Total recoveries per day=γ×I
For example, if an infected person is infective for 10 days on average, then
γ = 1/10 d^-1.
if an infected person is infective for 10 days on average, then And If there are 100 infected individual people, then
100γ = 10 individuals recover per day on average.
The rate at which susceptible individuals become infected (i.e. move into the ‘I ’ class) is typically
proportional to the densities of both S and I.
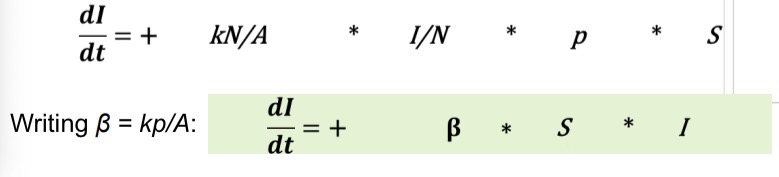
It can therefore be written as βSI, where β is known as the transmission coefficient.
The term βSI is low
at the beginning of an epidemic (when S is high and I is low), then accelerates and peaks (when S and I are intermediate), before becoming low again as the epidemic burns out (when S is low)
The per capita rate at which susceptibles get infected, λ, is also known as
the force of infection.
The force of infection is the product of:
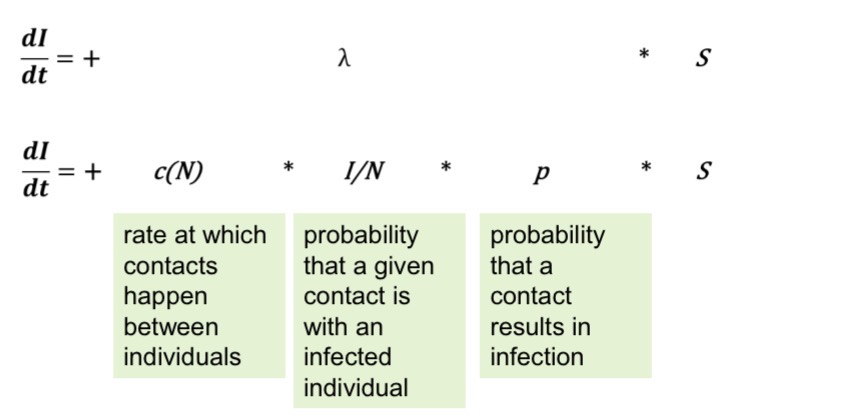
The rate at which contacts happen between individuals, c(N), is typically
density-dependent for droplet transmission.
The denser a population, the more contacts there are.
N = number of people, A=area.
HIV transmission doesn’t depend on density
Transmission depends on specific, repeated, and intentional contacts (sexual partners, needle sharing).
The number of these high-risk contacts per person usually does not increase just because the population is denser.
People have roughly the same number of sexual partners per year whether they live in a crowded city or a sparse village.
Therefore, contact rate c(N) is independent of population density.
This is called frequency-dependent transmission.
What does the equation c=k*N/A mean in the context of disease transmission?
c = contact rate, the rate at which individuals come into contact with others (potential for transmission).
N = total number of individuals.
A = area they occupy.
N/A = population density (individuals per unit area).
k = proportionality constant reflecting how mobile or social individuals are.
This describes density-dependent transmission, where the spread of infection accelerates in denser populations because people encounter each other more often.
As population density increases
N/A gets larger, individuals have more frequent contacts, so c (contact rate) increases.
β =
transmission coefficient
γ
= recovery rate
3 equations to know
What happens in an epidemic when the transmission coefficient (β) is high or the recovery rate (γ) is low?
High β → infection spreads very easily per contact.
Low γ → infected individuals stay infectious longer (slower recovery).
Together, this means:
Infected (I) peak is high and reached quickly.
Susceptible (S) drops sharply — many people get infected fast.
Recovered (R) rises rapidly and ends up at a high final value.
Epidemic burns through the population quickly and intensely.
High β or low γ →
fast, large outbreak with many infections in a short time.
What happens when the transmission coefficient (β) is low or the recovery rate (γ) is high?
Low β → infection spreads less easily per contact.
High γ → infected individuals recover quickly (short infectious period).
As a result:
Infected (I) peak is low and delayed.
Susceptible (S) declines slowly — fewer people get infected overall.
Recovered (R) increases gradually to a smaller final value.
The epidemic may die out before infecting most of the population.
Low β or high γ →
slow, mild outbreak with fewer total infections.
For a disease to spread,
host density must be above a minimum threshold value:
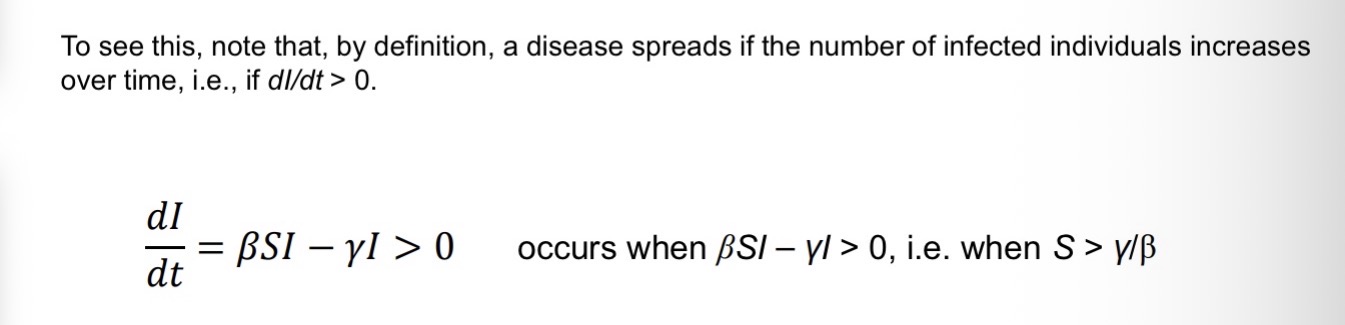
Therefore, for a disease that can be described by the SIR-model,
the minimum host density for disease spread is given by ST = γ/β.
Above this density, the disease spreads; below it, the disease dies out
In epidemiological models of microparasites, the basic reproductive number, R0, is typically defined as
the average number of new infections caused by a single infected person in a fully susceptible population (counting infected individuals).
It can be calculated as R0 = transmission rate per infected individual * avg. time that an infected individual is infectious, which equals β/γ = ST^-1 in the SIR-model.
for macroparasites, R0 is typically defined as the
average number of newborn larvae produced by a newborn larva through its lifetime in the absence of density-dependent constraints (counting parasites), and is calculated from the probabilities that the parasite reaches each life stage and the fecundities at those life stages (cf. Lecture 3).
if R0 < 1,
the disease dies out
if R0 > 1,
it spreads.
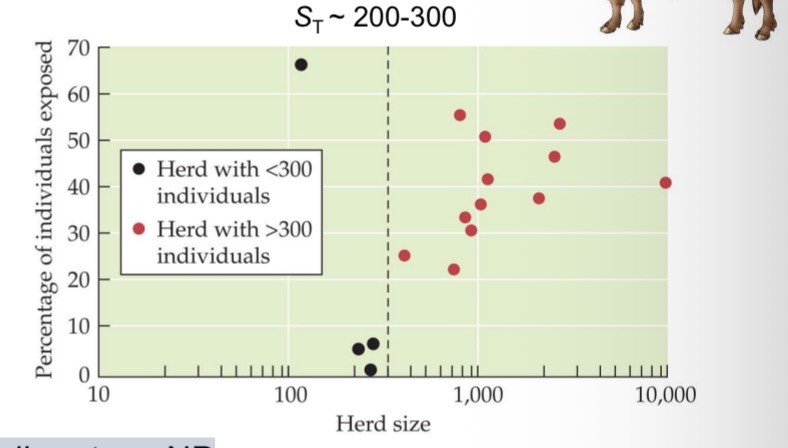
A disease that is introduced into a population tends to spread when the density of susceptible individuals exceeds a critical threshold:
Ex brucellosis in bison, Yellowstone NP
Red dots = herds with brucellosis
Black dots = herds without brucellosis
Herd size density
If you fall below that, disease never takes off, herds remain disease free
If you fall above that, herds with more than 300 individuals will always have the disease
How to deal with COVID-19
Need to break infection cycle by getting the density of people below a threshold so that the epidemic cannot continue to spread
We manage that with lockdown
In fall when we all congregate inside, the density increases, the disease takes off again
The existence of a minimum host density threshold for epidemic spread suggests various ways for controlling epidemics – all intended to keep the density of susceptible individuals below the threshold.
Option 1: Try to raise the threshold (γ/β).
Option 2: Bring the number of susceptibles below the threshold (γ/β).
Option 1: Try to raise the threshold (γ/β).
Decreasing transmission rate (β) (aka “flattening the curve”) increases the threshold ST = γ/β.
This can, for example, be accomplished by increasing hygiene, physical distancing, or by quarantine measures.
Increasing recovery rates (γ), for example, through better treatment, also increases the threshold ST = γ/β.
Option 2: Bring the number of susceptibles below the threshold (γ/β).
e.g., mass slaughter of poultry to prevent the spread of avian flu
e.g., vaccination & measles in Romania
Getting vaccines gives people immunity → removes those people from susceptible pool → reduced susceptabiles below some density → slowing down epidemic
The SIR-model constitutes the basic building block of the vast majority of epidemiological models that are used today.
The model can be extended by adding (or removing) additional compartments and/or fluxes to match the dynamics of different types of diseases.
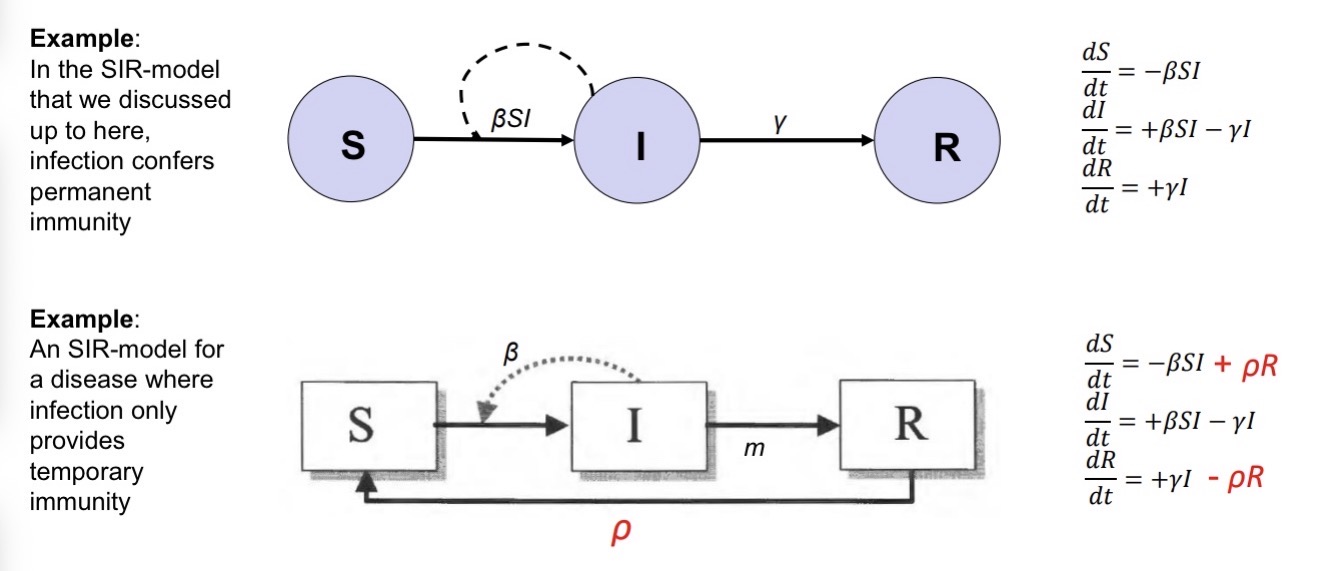
SI-model:
no recovery; appropriate for diseases that are (almost) always fatal (e.g., bubonic plague)

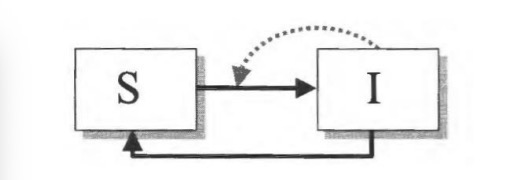
SIS-model:
infection does not confer immunity after recovery; e.g., for many bacterial diseases
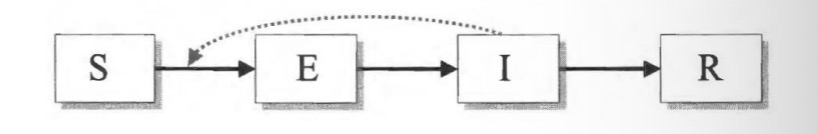
SEIR-model:
accounts for delays between infection and becoming infectious; e.g., SARS-CoV-2
Exposed category: you have disease but are not contagious for some period of time.
SICR-model:
inclusion of chronic carriers that transmit at low rates for a long time; e.g., hepatitis B, herpes

Example: West Nile Virus Dynamics
If we start with birds, they start as suseptable, and they get bitten by infectious mosquitoe→ bird moves to infectious category → then they could die or recover
If we start with mosquitos, they start in larvae stage then they grow up to become suseptable. If they bite an infectious bird, they carry the virus and become infectious themselves. → if mosquito bites the birds, they infect the bird again

Wave analogies are suitable for describing epidemic trajectories in hindsight, but they are problematic for managing an epidemic while it is occurring.
A lack of a clear definition of what constitutes a “wave” can lead to contradictory assessments by politicians and the media regarding whether current case increases constitute a wave or not. This can create pandemic response fatigue.
Actual waves do not behave like viruses at all. Epidemic “waves” are not a physical force that comes at us regardless of what we do. Rather, our behavior matters. Thinking of aquatic waves can lead people to be less vigilant while in a “trough”, thus encouraging exactly the type of behavior that will lead to a new outbreak – a panic-neglect cycle
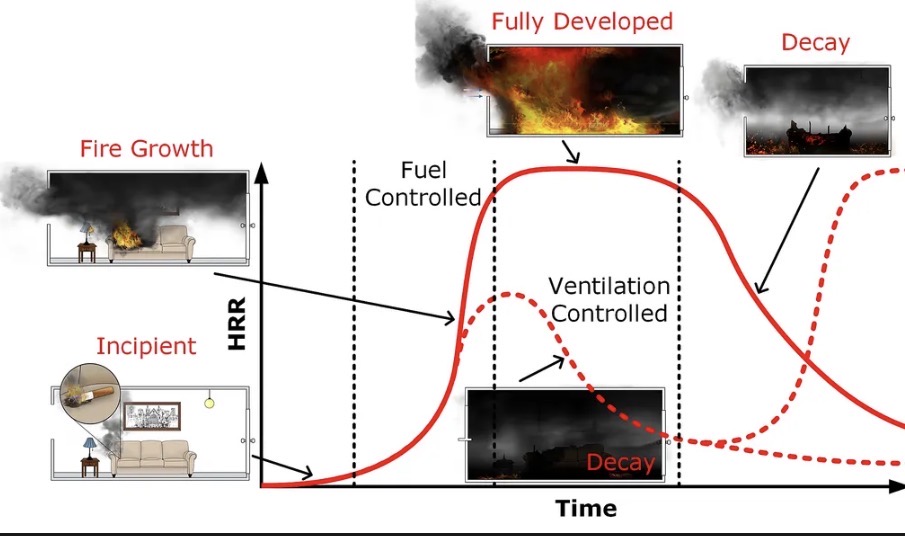
Thinking of campfires can help visualize the emergence and local spread of a disease, as well as potential control strategies.
Every stage of making a campfire can turn into an analogy on how disease spreads
First infection: A spark (match) lights one log → the first person is infected.
Spread: Each burning log can light others — if each log lights 3 others, R₀ = 3.
Burnout: When most logs are burning (most people infected), the fire fades as fuel runs out.
Unburned logs: Some remain untouched because they were too far apart — like people in low-density areas avoiding infection.
What firefighters learn
A fire starts when (a) conditions are conducive to a fire, and (b) something (often a random event) sets the first piece on fire
A fire grows (initially exponentially) when each burning piece lights at least one new piece on average (R0>1)
Physical distancing cools the fire; arranging pieces closely together stokes the fire
After a peak, the fire begins decaying. This is because the average number of new burning pieces decreases as many have already been burnt.
When the fire goes out, some pieces often remain unburnt due to the same mechanisms that explain herd immunity.