Chapter 17: Mass spectrometry + IR spectroscopy
1/26
There's no tags or description
Looks like no tags are added yet.
Name | Mastery | Learn | Test | Matching | Spaced |
|---|
No study sessions yet.
27 Terms
what can we work out from mass spectra?
the molecular mass of an organic compound
when an organic compound is placed in the mass spectrometer, what happens?
it loses an electron
forming a positive ion
this is the molecular ion
what is m/z ?
the mass to charge ratio of a molecular ion (the Mr of a compound)
how do we find the molecular ion peak?
it is the clear peak at the highest m/z value on the right ➡ of a mass spectrum
what is the very small peak after the molecular ion peak?
the M+1 peak → this is because 1.1% of carbon is present as a carbon-13 isotope
what is a fragment ion?
→ in a mass spectrometer, some molecular ions break into smaller pieces called fragments.
→ their peaks are called fragment ions
→ caused by the breakdown of the molecular ion.
what does the simplest kind of fragmentation break a molecular ion into?
a positive ion (will be detected by the mass spectrometer)
a radical
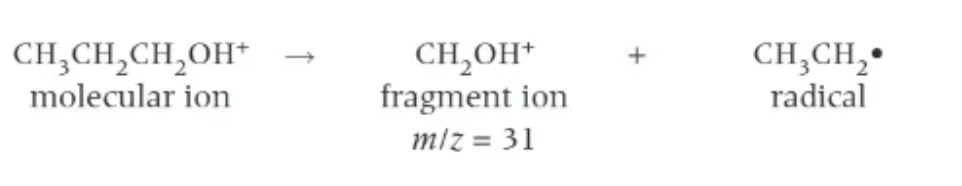
what can a fragment ion peak tell us?
how the molecule has fragmented → what size are the fragments?
how does temperature increasing affect the amount of vibration?
increases vibrations in the covalent bonds
what can bonds absorb that makes them stretch/bend more?
IR radiation
define a stretch in a covalent bond
the rhythmic movement along the line between two atoms so the distance between the two atomic centres increases and decreases.
what happens during a bend vibration?
there is a change in bond angle
the amount that a bond stretches or bends depends on:
the mass of the atoms in the bond → heavier atoms vibrate more slowly than lighter atoms
the strength of the bond → stronger bonds vibrate faster than weaker bonds.
what must radiation have to be absorbed by a bond?
the same frequency (as the natural frequency of the bond)
the vibrations of most bonds are observed in the IR wavenumber ranges of:
200cm-1 - 4000cm-1
infrared radiation and atmospheric gases → part 1
a lot of the sun’s visible + IR radiation is relatively unaffected by atmospheric gases
this radiation passes through the atmosphere to the Earth’s surface, where most of it is absorbed.
but SOME is re-emitted from the Earth’s surface in the form of longer wavelength IR radiation

infrared radiation and atmospheric gases → part 2
water vapour, carbon dioxide, and methane (greenhouse gases) absorb this longer-wavelength IR radiation
because is has the SAME FREQUENCY AS THE NATURAL FREQUENCY OF THEIR BONDS!
the vibrating bonds in these molecules re-emit their energy as radiation that increases the temperature of the atmosphere → global warming!
what is the purpose of IR spectroscopy?
to identify the function groups present in organic molecules
how does IR Spectroscopy work ?
place sample in an IR spectrometer
beam IR (in the range of 200 - 4000cm-1) through sample
molecule absorbs some of the IR frequencies, and the emerging beam is analysed to identify which frequencies have been absorbed.
the IR spectrometer is usually connected to a computer plotting a graph of transmittance against wavenumber
what are the dips in an IR spectrum called?
peaks
what is the fingerprint region?
below 1500cm-1 → this is the NOT useful part
all organic compounds produce a characteristic peak between [what] and [what] cm-1. Why?
between 2850-3100cm-1 → this is because of the C-H bonds!
don’t mix it up with the O-H peak in alcohols - they look similar!
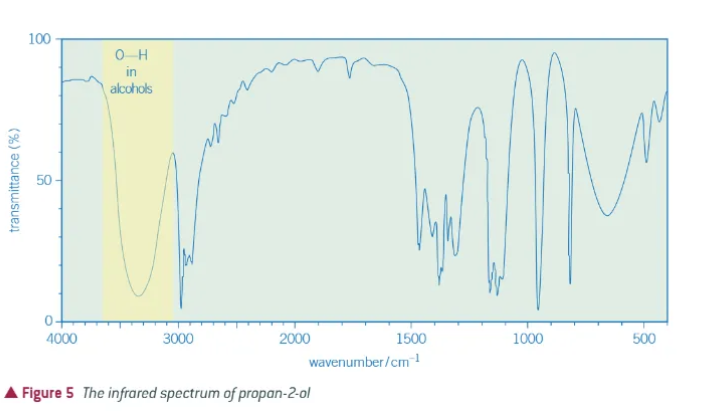
what does an alcohol peak look like?
3200-3600cm-1
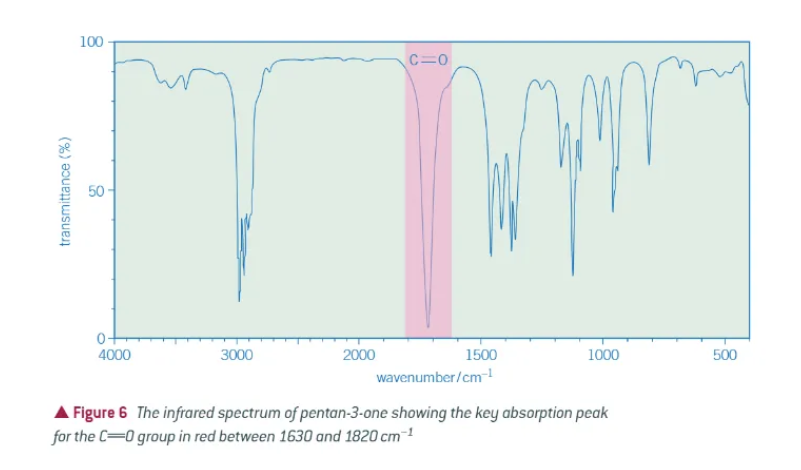
what does the key absorbance peak of an aldehyde or ketone look like?
1630-1820 cm-1 → typically absorbs close to 1700cm-1
what does the IR spectrum of a carboxylic acid look like?
looking out for the C=O AND the O-H bonds
C=O is around 1700cm-1
O-H is around 2500-3000cm-1 → and it is broad
applications of IR spectroscopy:
pollutants → detecting vehicle emissions of CO, CO2, and hydrocarbons
IR-based breathalysers → testing for ethanol in the breath
typical sequence of the identification of an organic molecule:
elemental analysis → percentage composition data to determine empirical analysis
mass spectrometry → molecular ion peak to get Mr + fragment ions to identify sections of a molecule
infrared spectroscopy → absorption peaks from an IR spectrum to identify bonds and functional groups of a molecule