Determine total suspended solids of a sample of water by filtration. The total dissolved solids by evaporation. The pH of a sample of water
1/16
There's no tags or description
Looks like no tags are added yet.
Name | Mastery | Learn | Test | Matching | Spaced |
|---|
No study sessions yet.
17 Terms
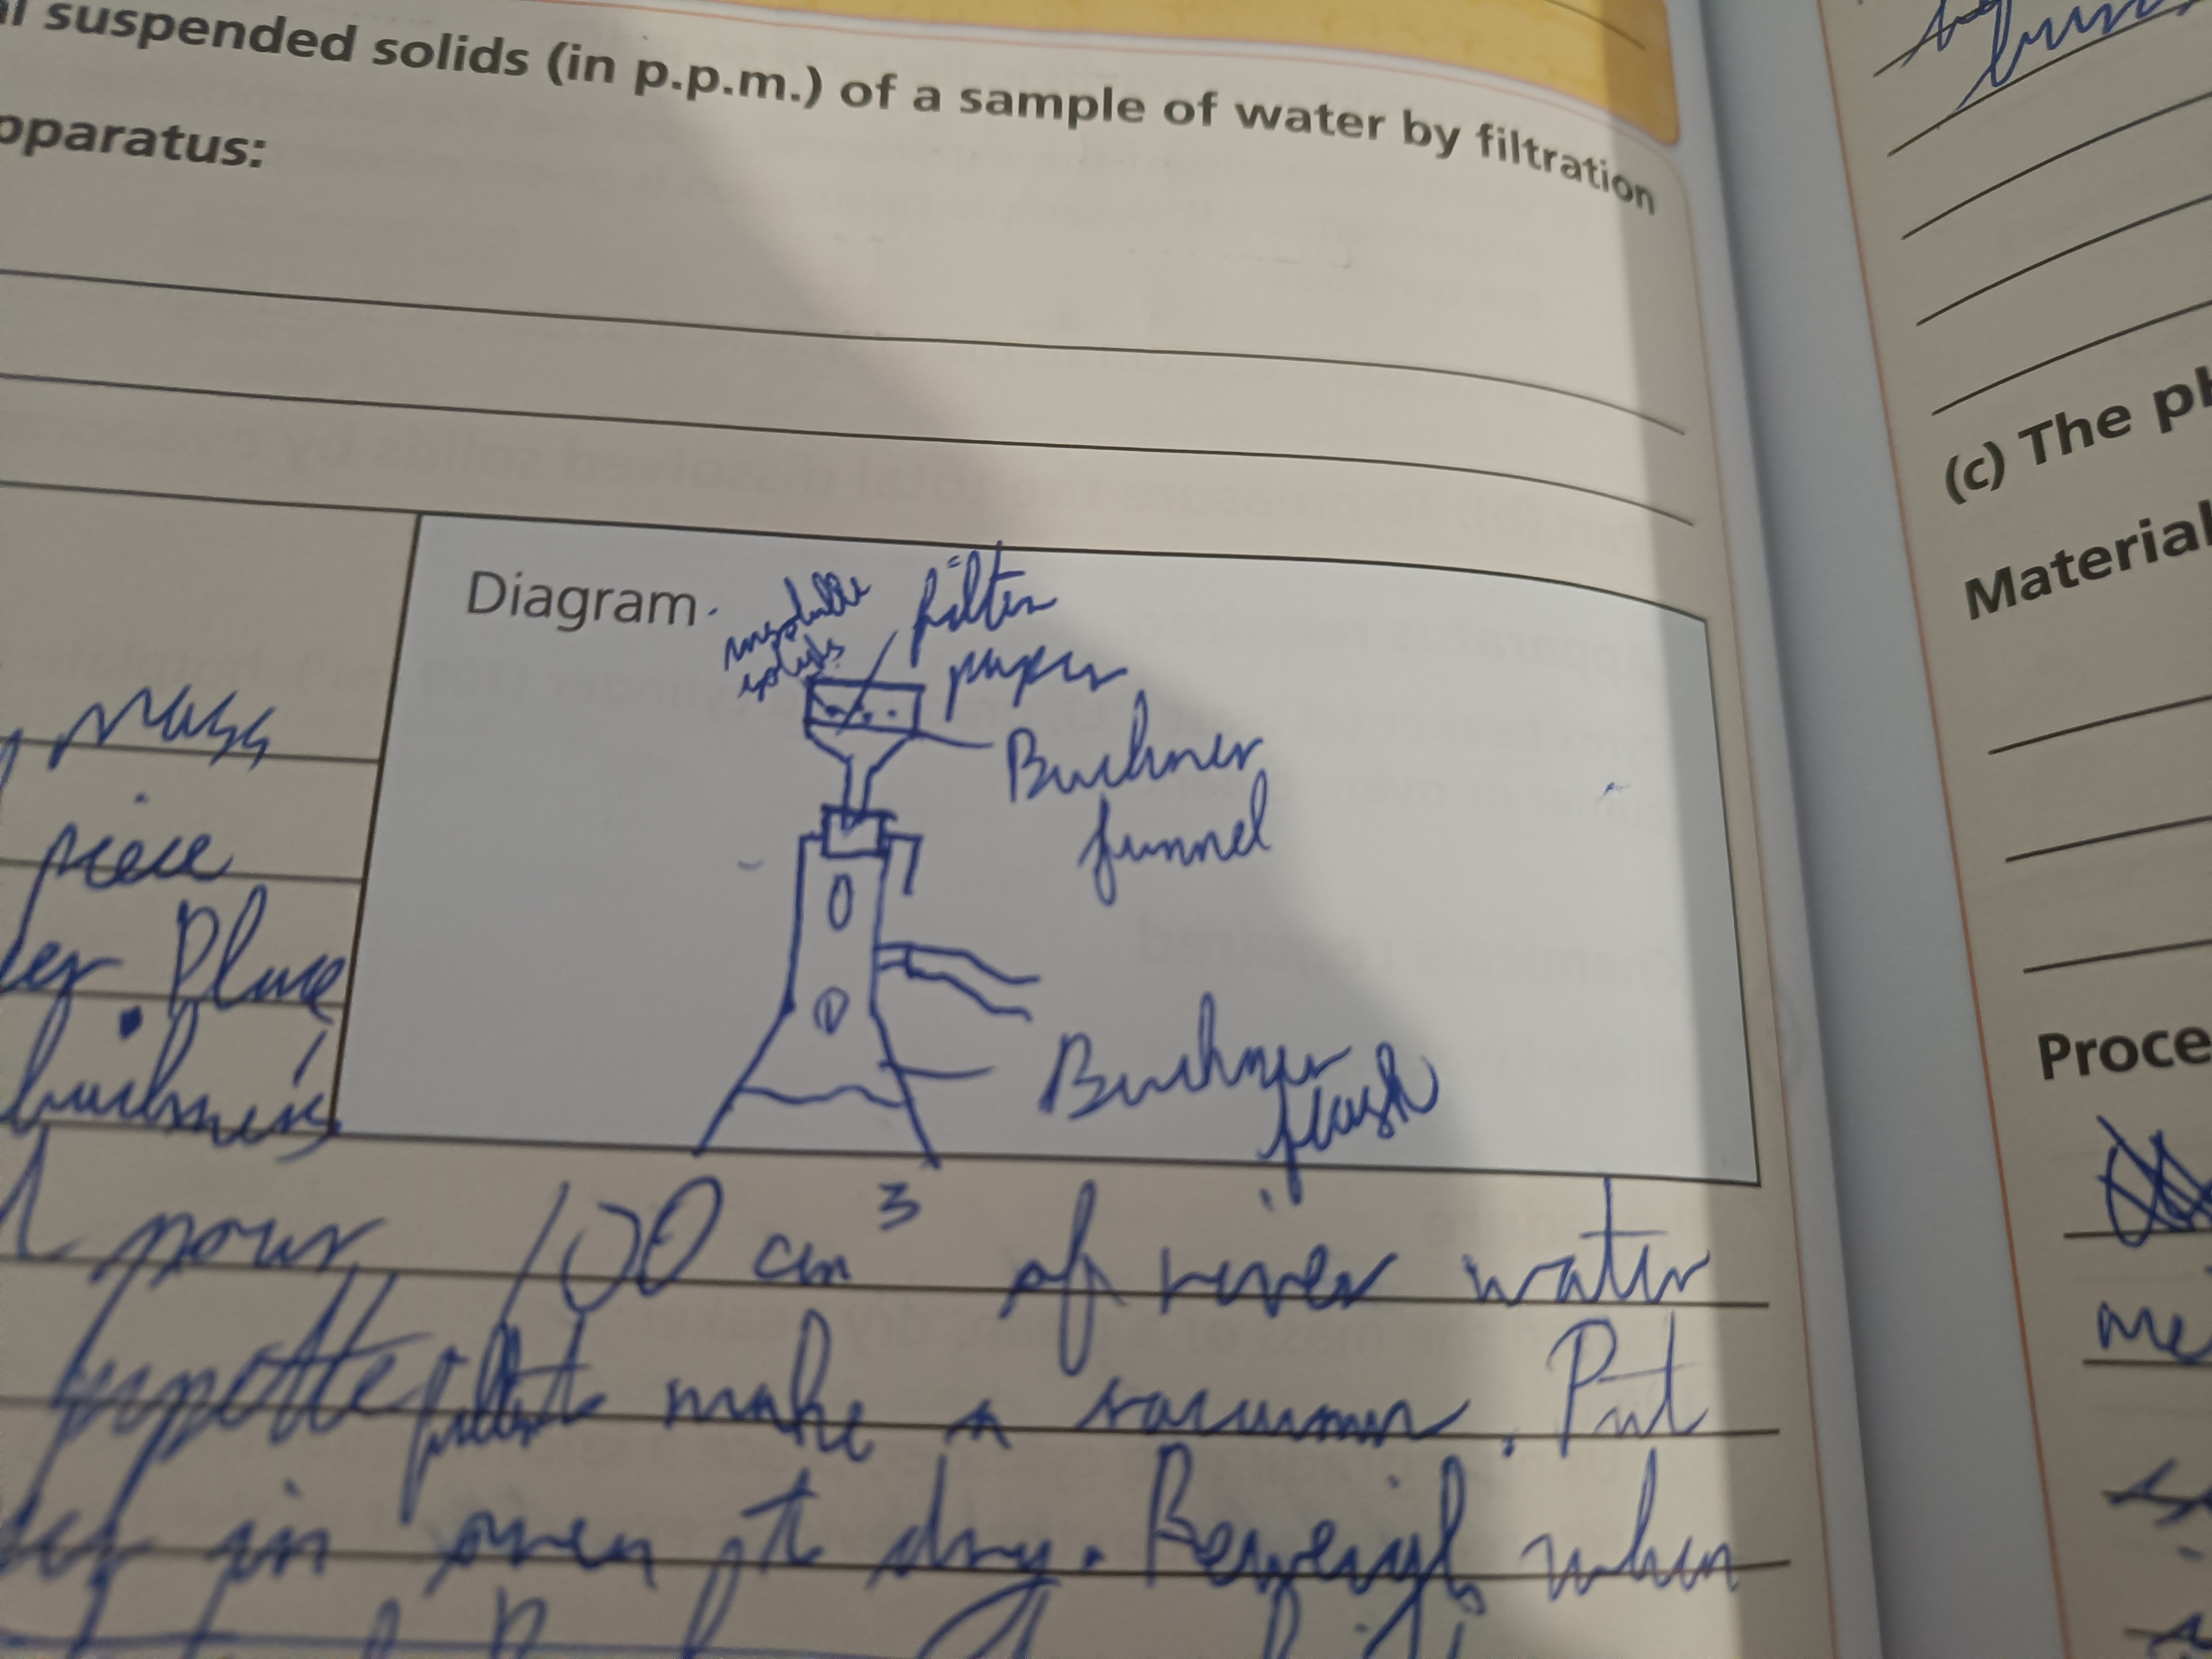
Draw a diagram to find the total suspended solids in a sample of water by filtration
…

Step 1 (Total suspended solids in a sample of water by filtration)
Find mass of a dry piece of filter paper and place it on a Buchner funnel and pour in river water.
Step 2 (Total suspended solids in a sample of water by filtration)
Use a pipette filler to make a vacuum. Put wet filter paper in oven to dry
Step 3 (Total suspended solids in a sample of water by filtration)
Reweigh when dry and subtract it from the initial mass
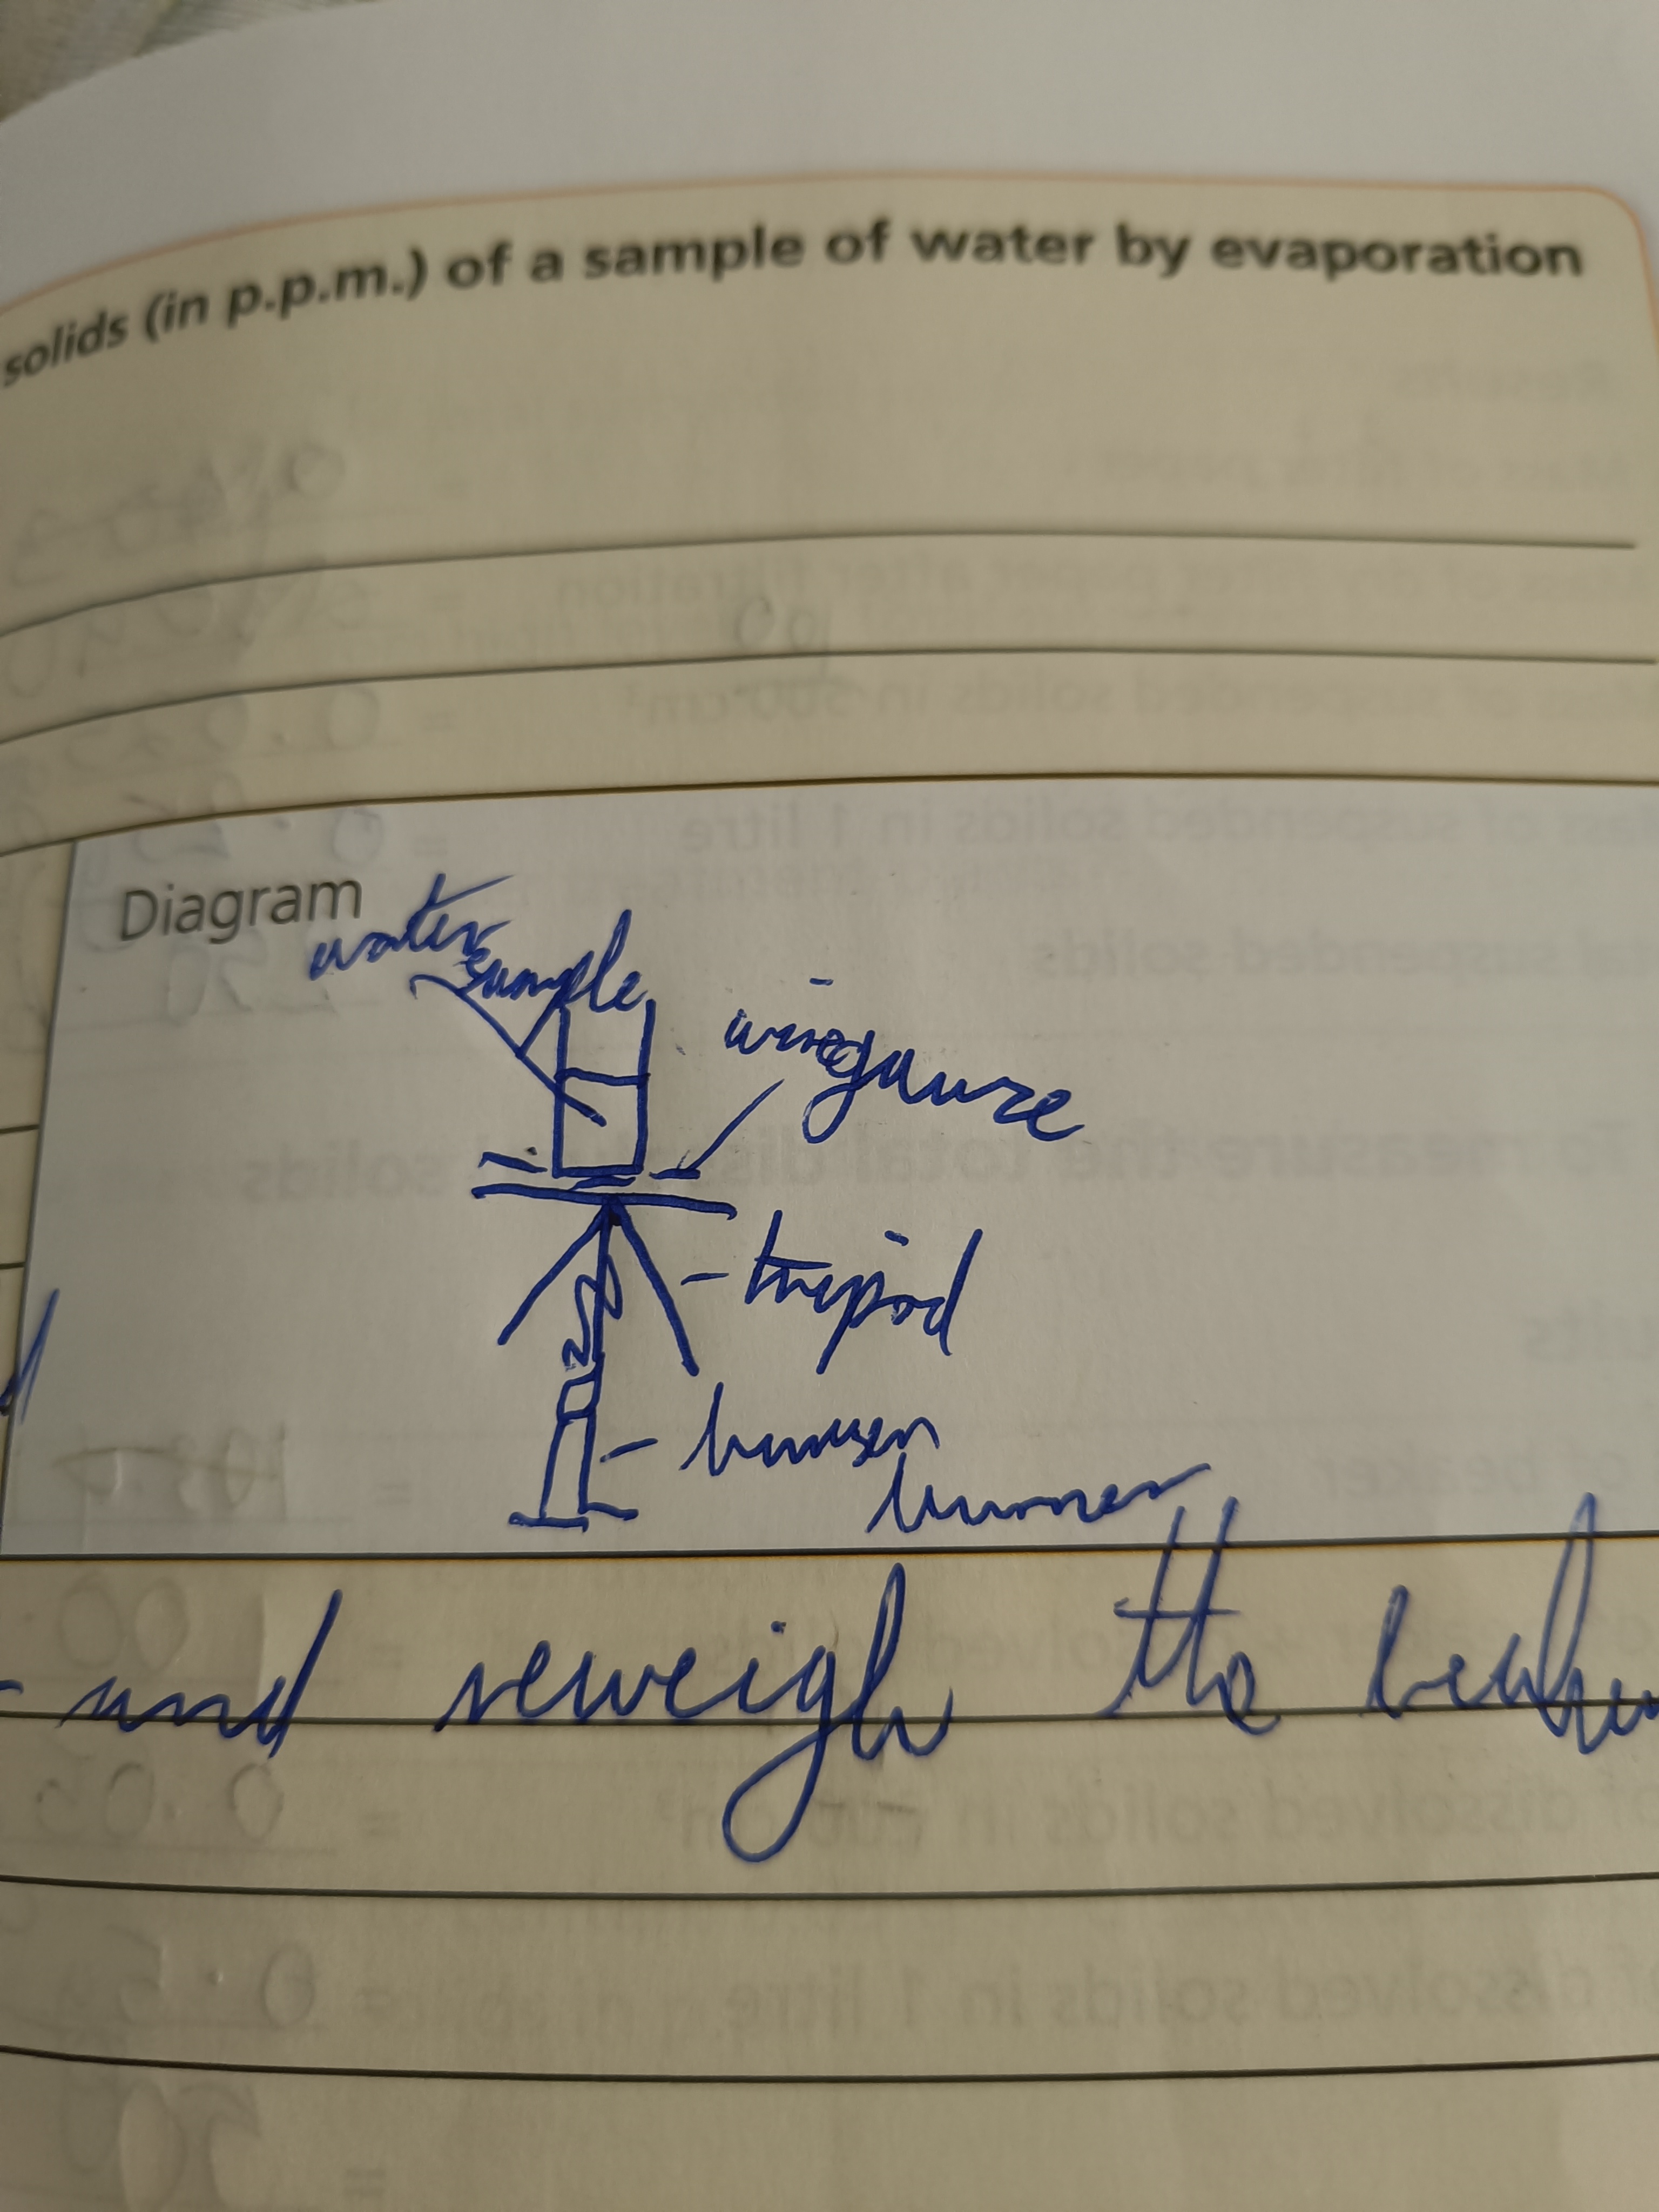
Draw a diagram to find the total dissolved solids in a sample of water by evaporation
…

Step 1 (Total dissolved solids in a sample of water by evaporation)
Pour contents of Buchner flask into a pre-weighed beaker
Step 2 (Total dissolved solids in a sample of water by evaporation)
Turn off bunsen burner and reweigh the beaker
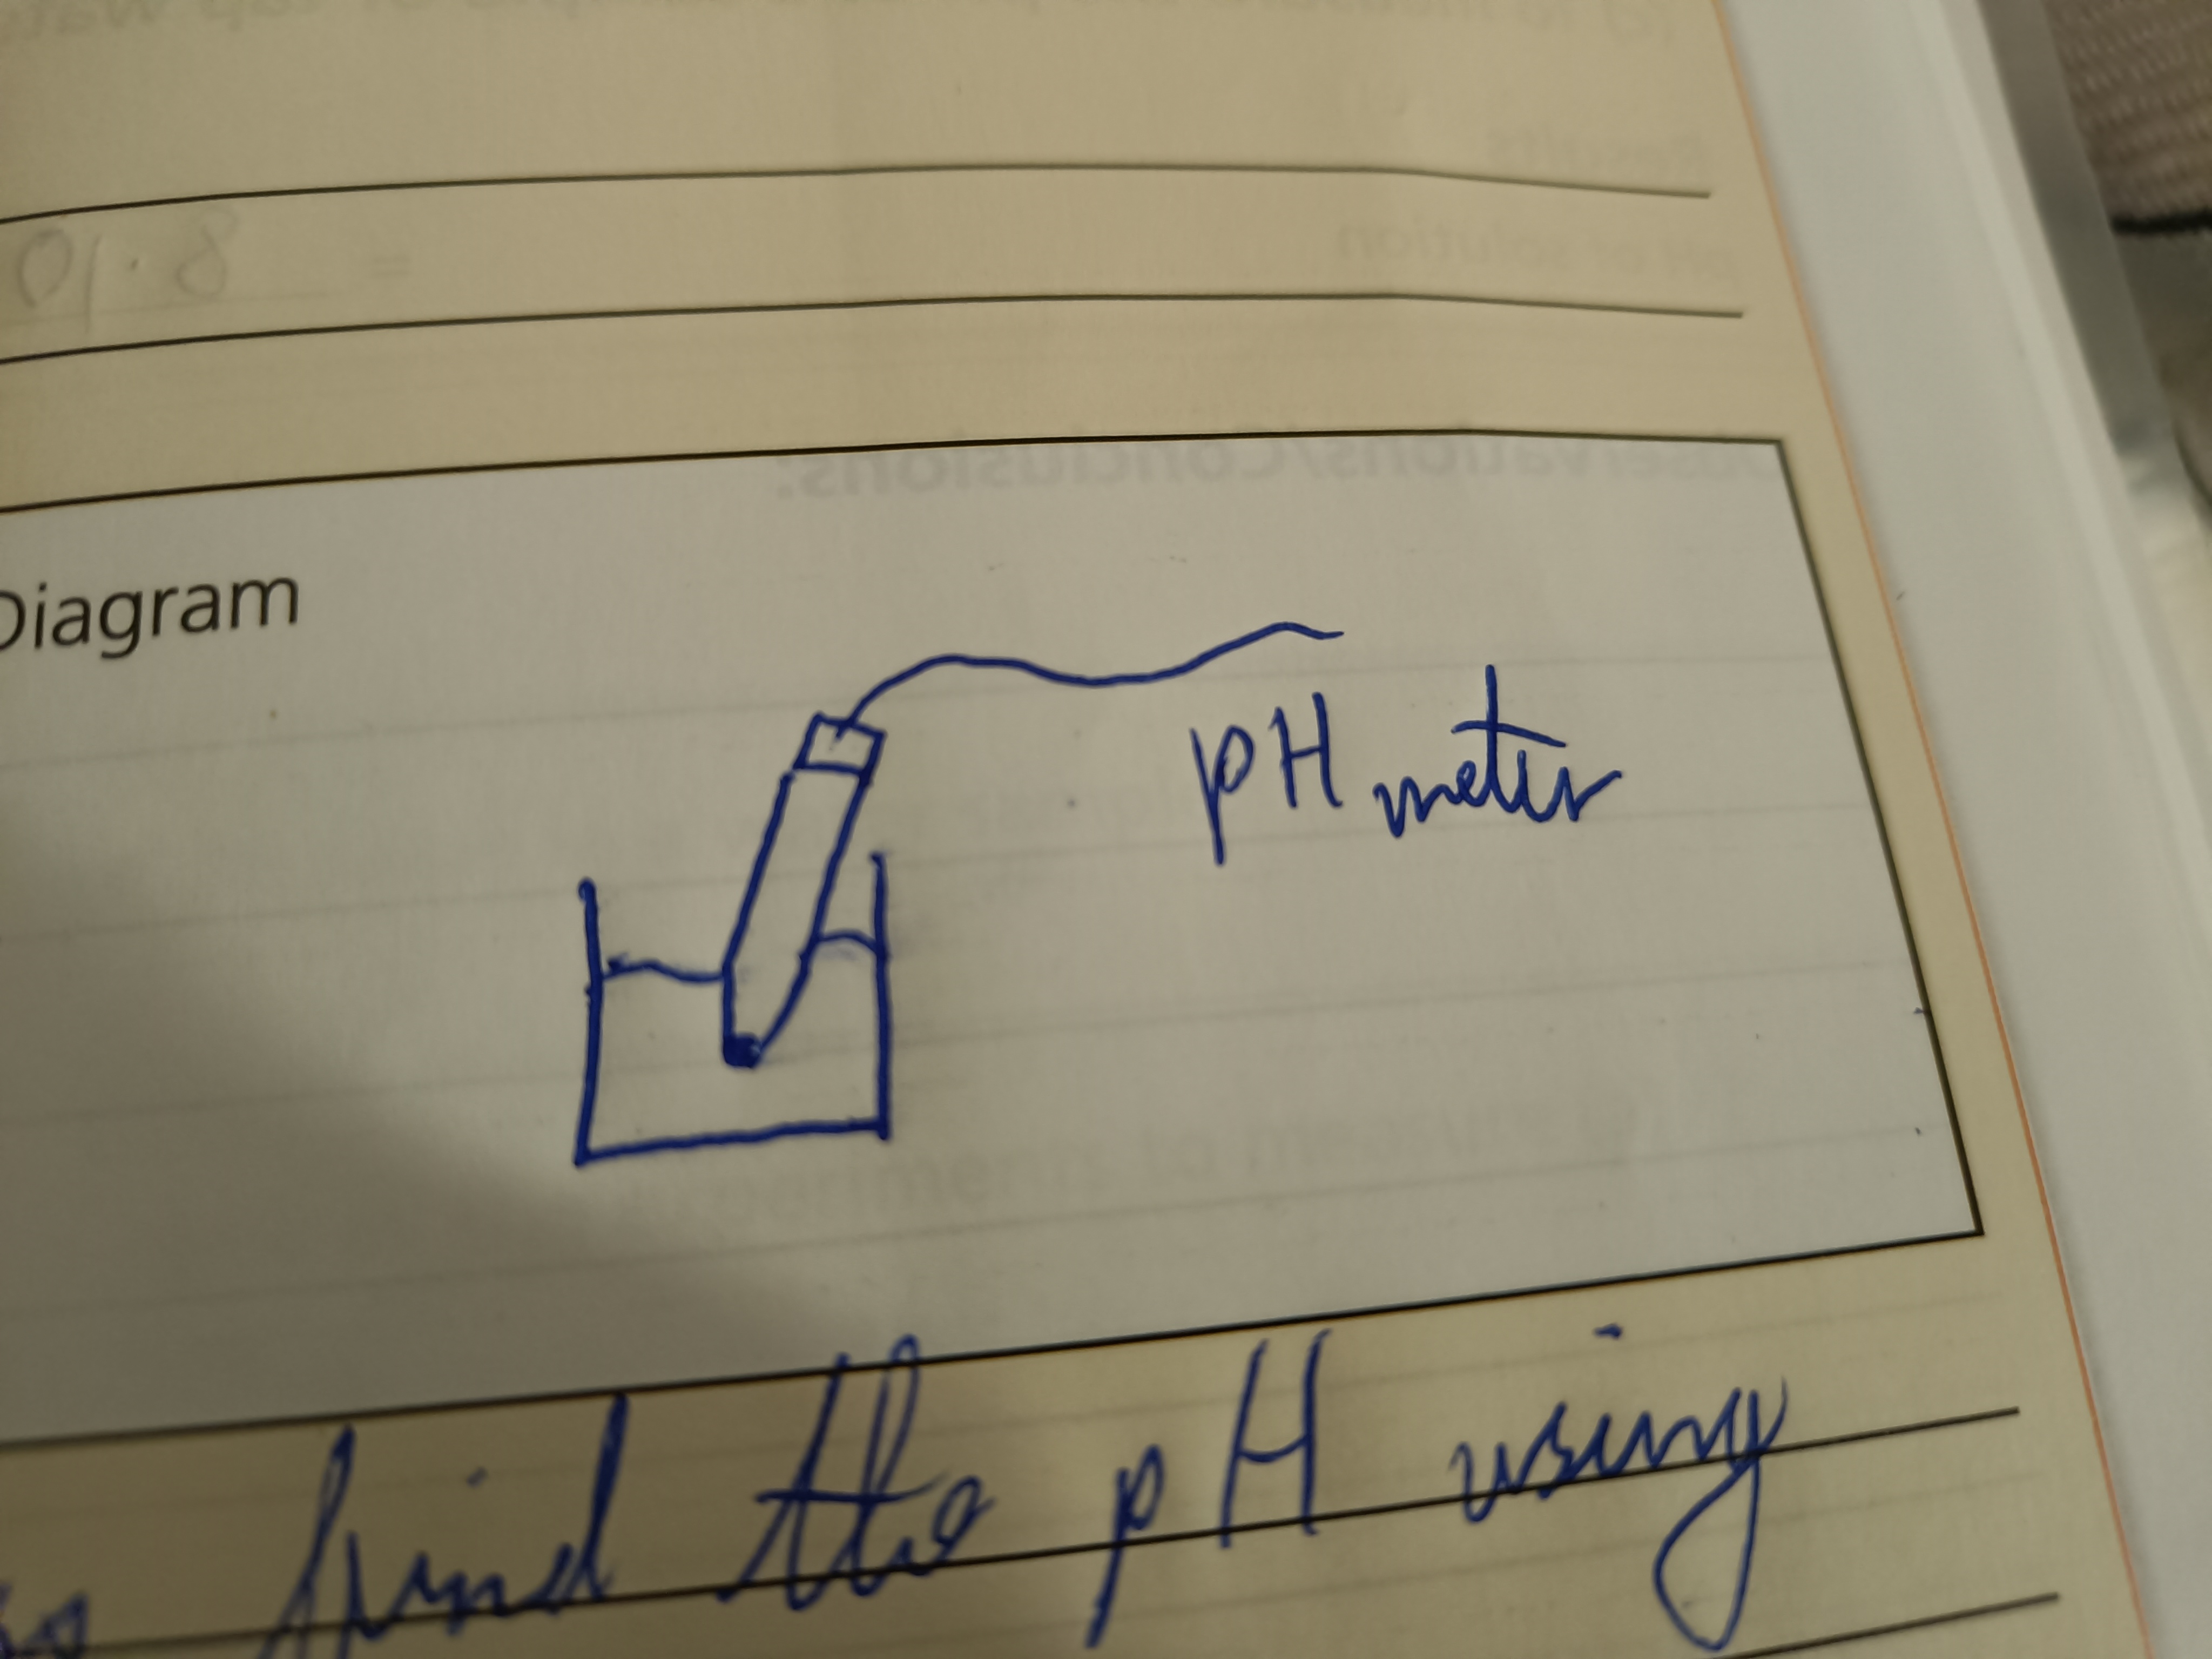
Draw a diagram to find the pH of a sample of water
…

Step 1 (pH of water sample)
Put pH meter into the sample and connect it to a computer
How else can you find the pH?
Universal indicator paper
Possible cause of high levels of suspended solids
Heavy rainfall or farm effluent
Undesirable effect which is caused by a high level of total suspended solids
Water may be cloudy or brown
Why must insoluble solids be removed before finding the concentration of dissolved solids?
Insoluble solids would lead to an inaccurate results
Reason for high levels of dissolved solids
River runs through 3 counties so lots of soluble minerals may dissolve in the water
Reasons for a high pH value in a water sample (2)
Water flows from a limestone region. Local water authority may have added sodium carbonate
Two sources of error in the experiment to measure suspended solids
Incomplete drying of filter paper. Loss of suspended solids under filter paper
Two sources of error in the experiment to measure dissolved solids
Inaccurate measurement of volume of water. Incomplete evaporation of water