Soil Properties 4.3
1/20
Earn XP
Description and Tags
Name | Mastery | Learn | Test | Matching | Spaced | Call with Kai |
|---|
No analytics yet
Send a link to your students to track their progress
21 Terms
Particle Size, Texture, & Porosity
geologic portion of soil = 3 particles
sand>silt>clay
Soil Texture
% sand/slit/clay in soil
always = 100% ; 40-40-20 (loam)

Sand
0.05-2mm
b/c sand is bigger, it has bigger pores
more sand in soil = more porous/higher porosity (easier for water and air to enter)

Silt
.002-0.05mm
middle ground
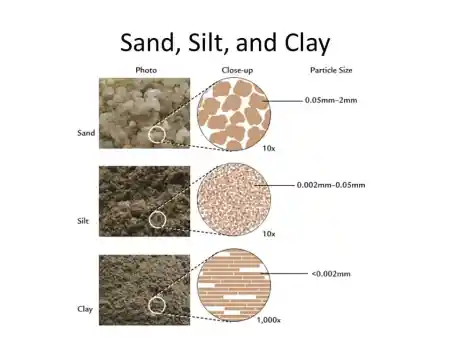
Clay
< .002
b/c sand is smaller, it has smallerpores
less sand in soil = less porous/lower porosity (harder for water and air to enter)
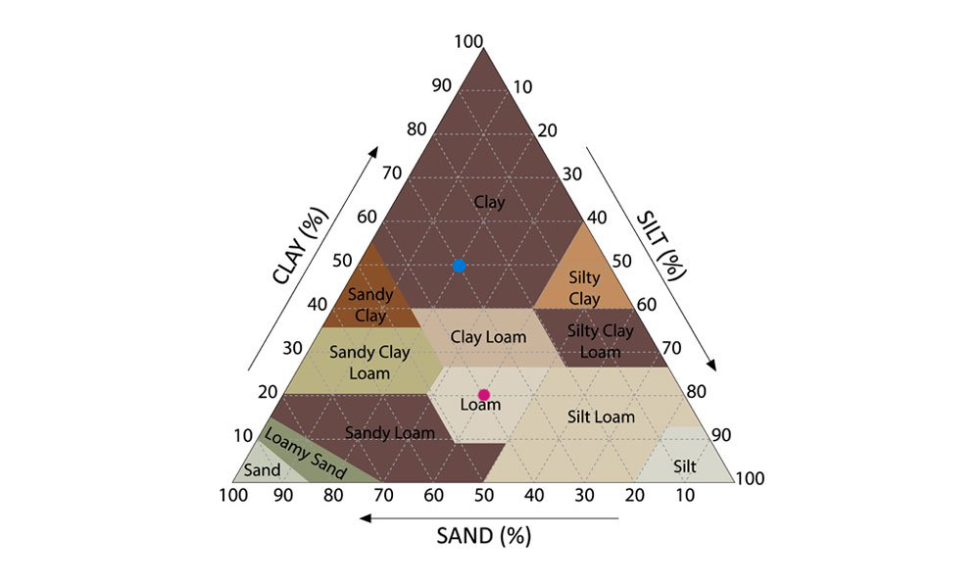
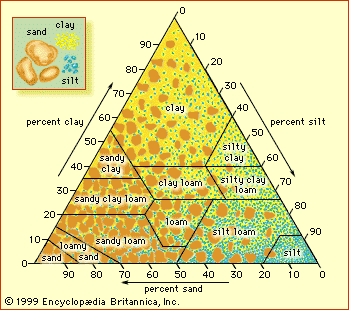
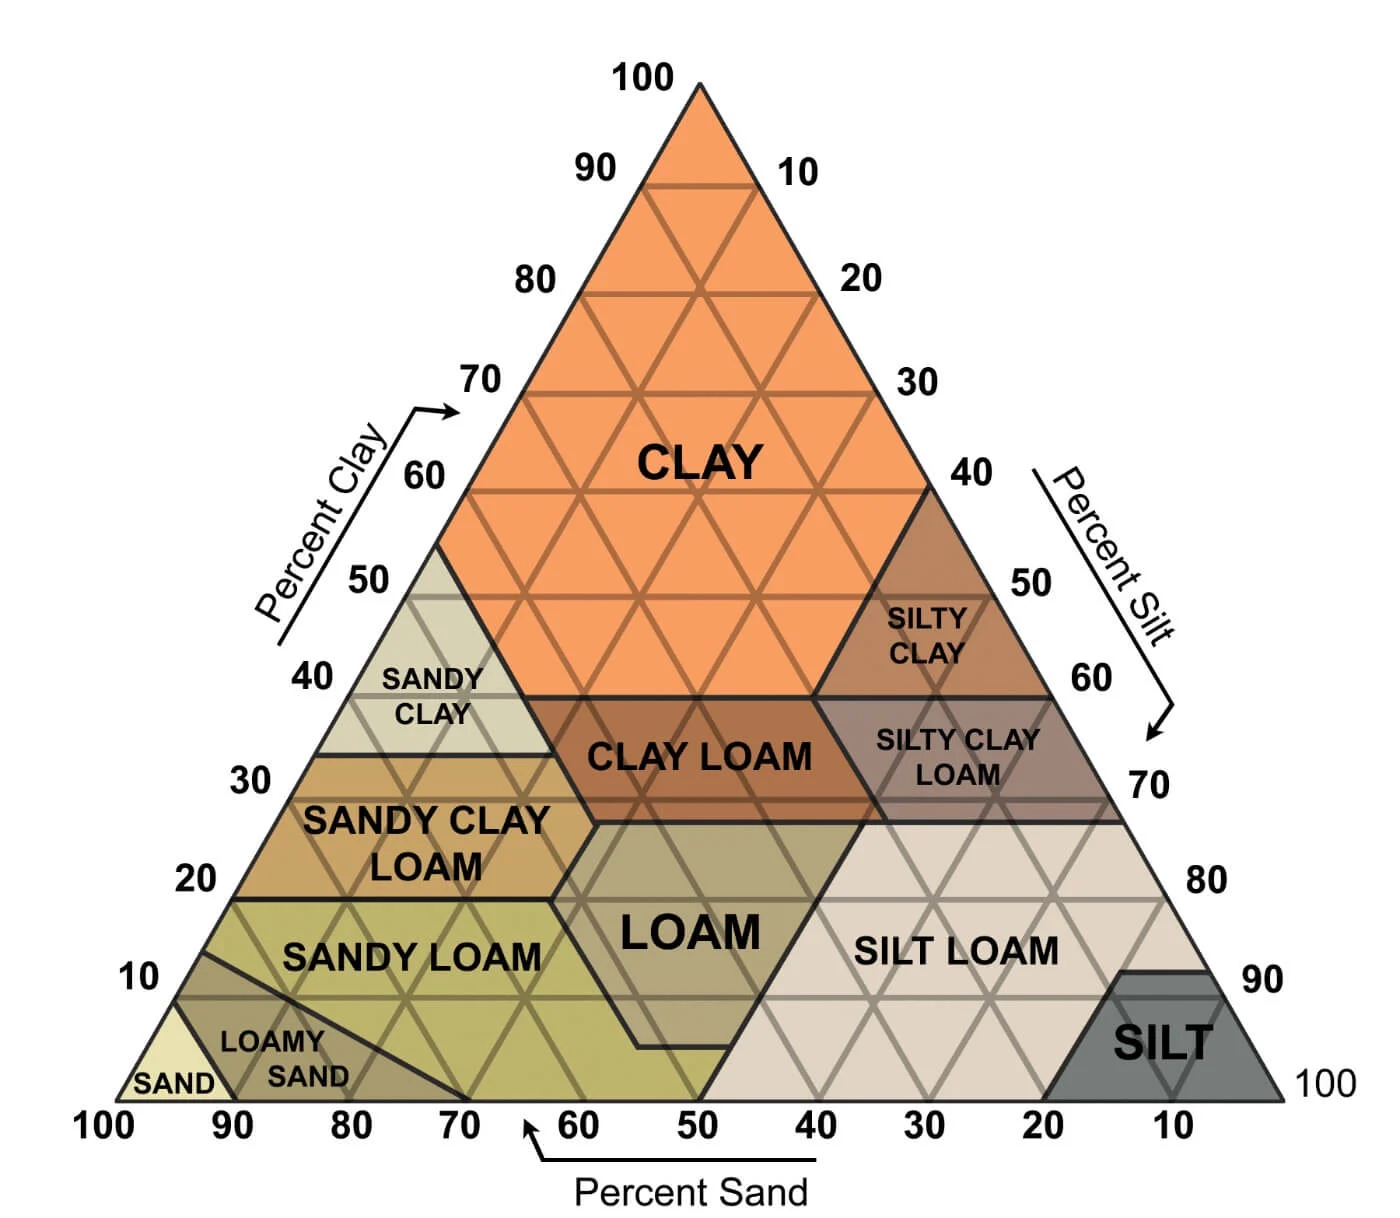
Soil Texture Chart
start w/ sand % (bottom)
move where sand meets silt
straight to clay
add to 100% always
blue circle; 30-20-50
pink circle; 40-40-20
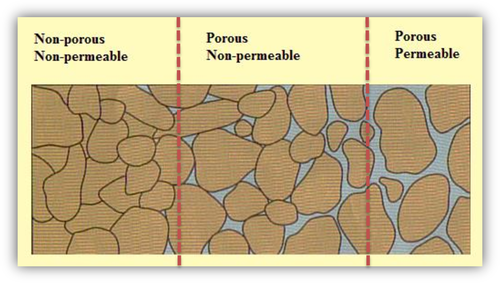
Porosity
space of pores within soil (> sand = > porosity)

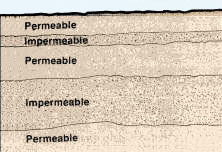
Permeability
ease at which water drains through soil
positive relationship between permeability and porosity
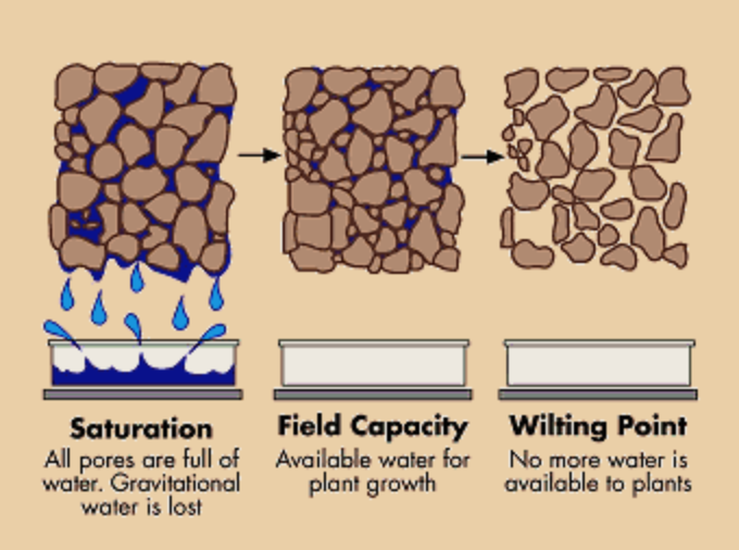
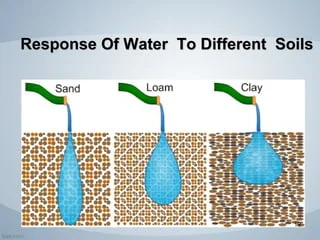
H2O Holding Capacity
how well water is retained by soil
more porous = lower H2O capacity
inverse relationship between porosity/permeability and H2O Holding Capacity
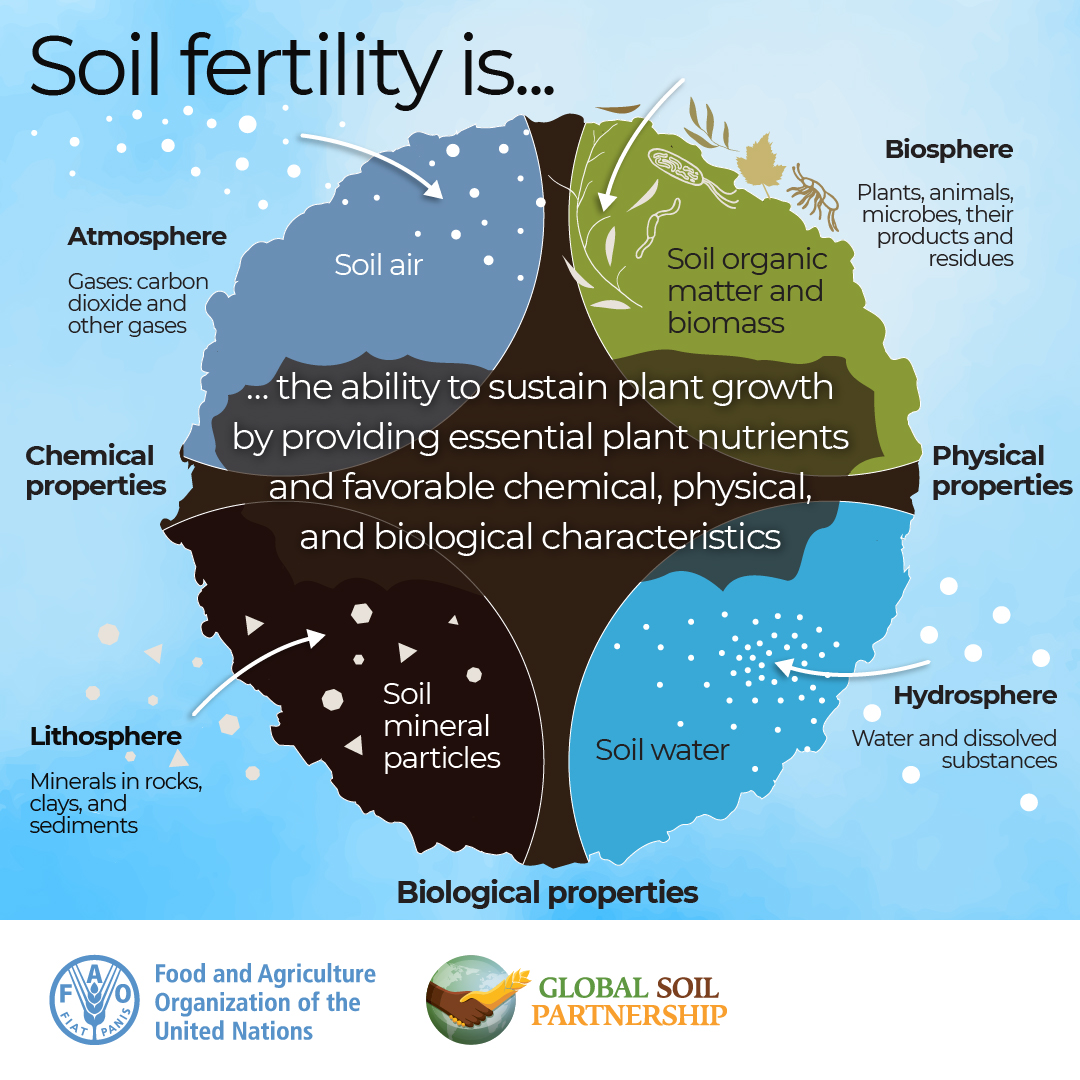
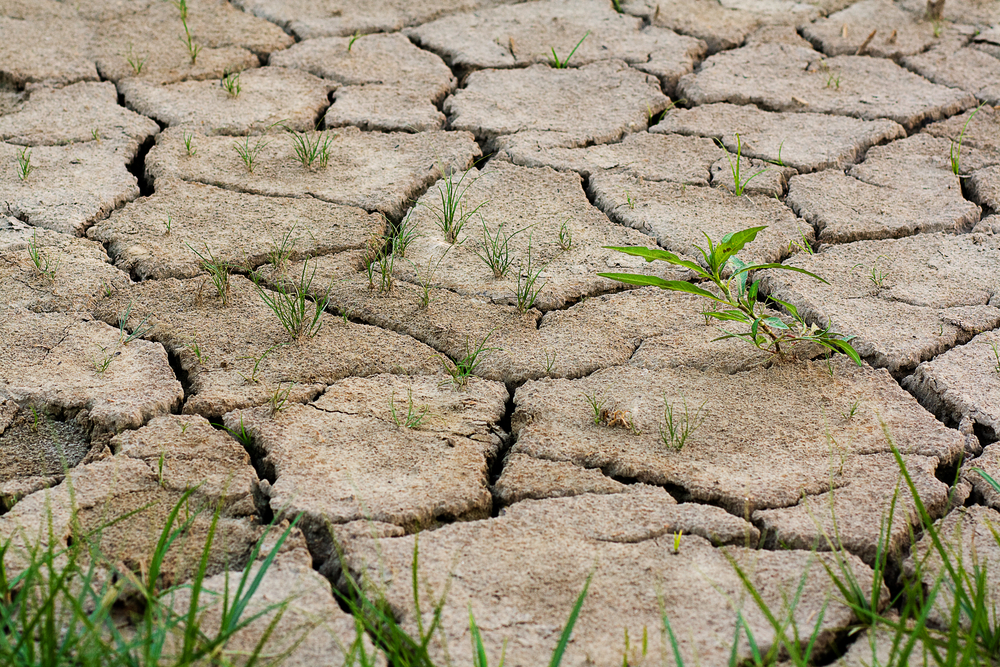
Effects on Fertility
if soil is too sandy (permeable), water drains too quickly for roots and dries out
clay - heavy soil doesn’t let H2O drain to roots: water logs (suffocating)
ideal soil is loam; balances porosity or drainage w/ H2O HC
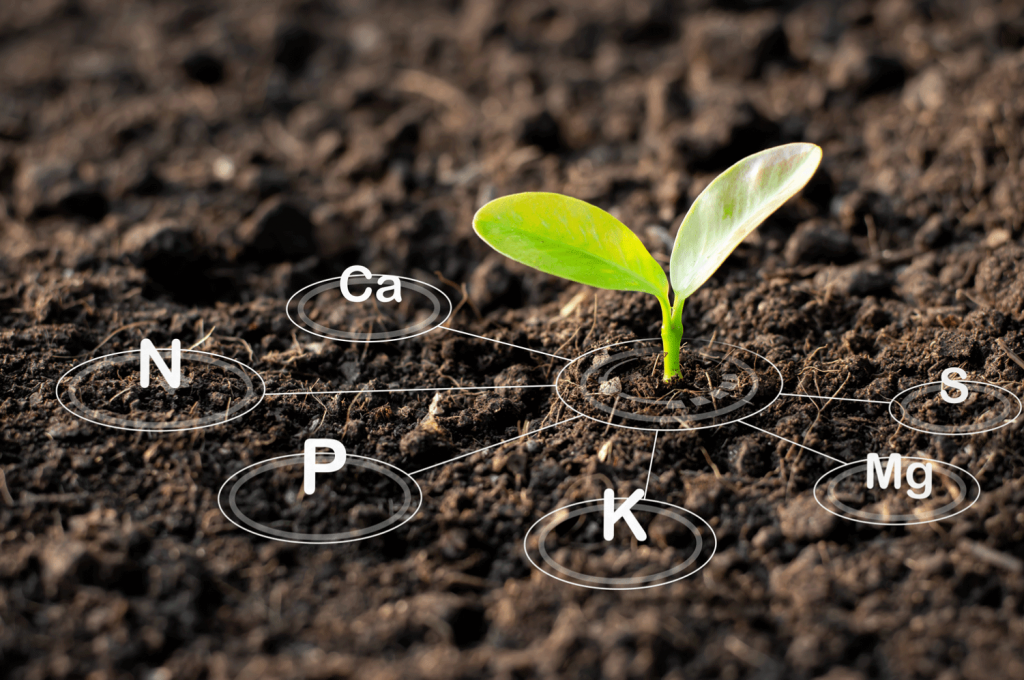
Nutrients
N, P, K+, Ca+, NA+
Increase Nutrient Factors
organic matter, humus, decomposer activity, clay, bases (calc-carb, limestone)
Decrease Nutrient Factors
acids leach positive charge nutrients, > precip/irri leach, > farming depletion, top soil erosion
Water/H2O
needs to hold water, not too much
Increase Water Factors
aeriated soil (bio activity), organic matter, clay %, root structure (esp native)

Decrease Water Factors
compacts soil, topsoil, sand %, root loss
Texture
what it tells you; % sand, silt, clay - % porous and permeable
how to test it; let soil settle in water, measure 3 layers
Permeability
what it tells you; ease at which water drains - > = dry, < = roots have no water or drown
how to test it; time H2O drains through soil column
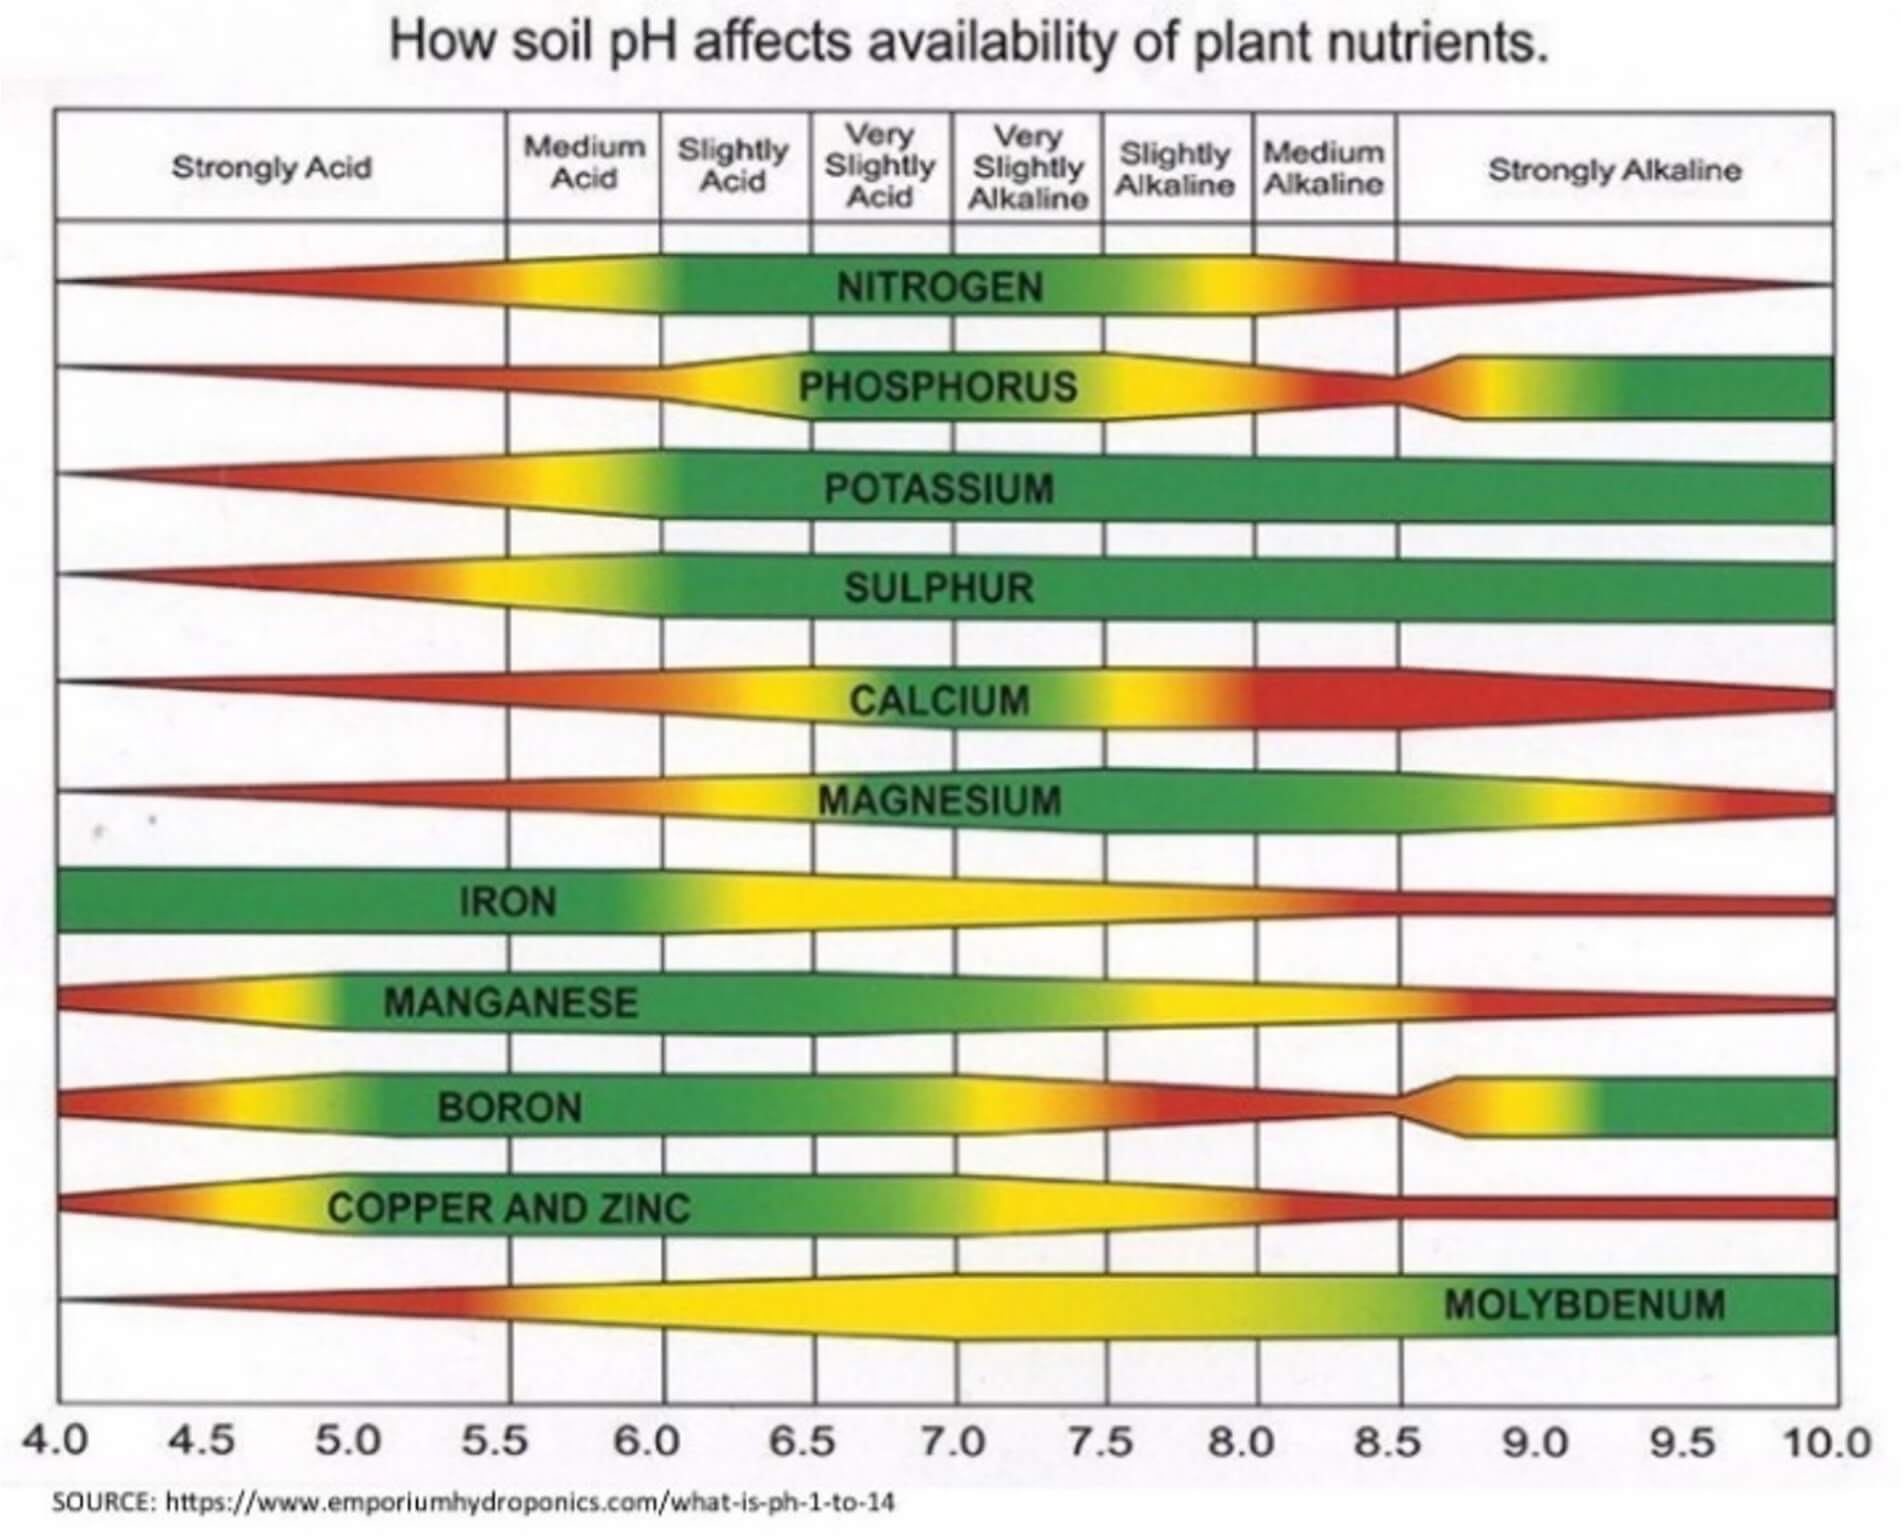
pH
what it tells you; how acidic (<) or basic/alkaline (>) in soils - < = < nutrient activity
how to test it; pH strip, H+ ion concentration, litmus
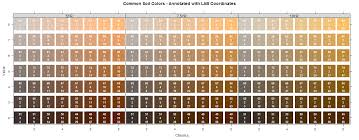
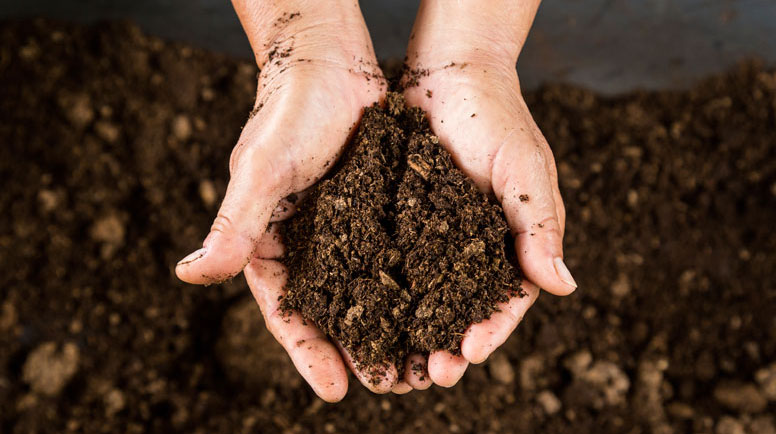
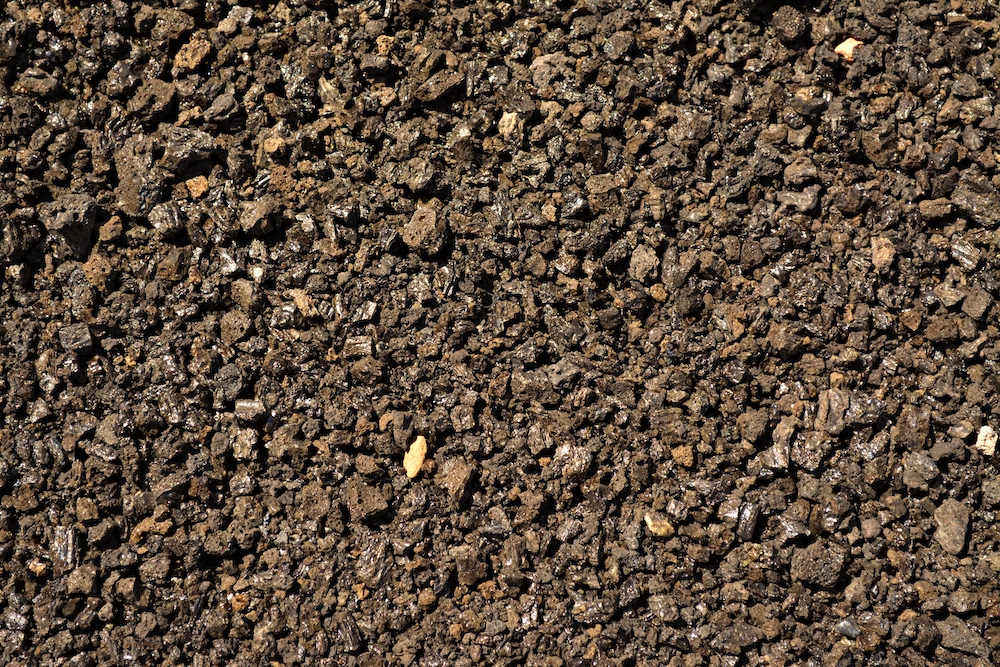
Color
what it tells you; dark = more humus, nutrients, and moisture
how to test it; compare w/ soil color chart
Nutrient %
what it tells you; > = > plant growth, < indicates acidic soil/depletion
how to test it; measure NH 4+, NO 3-, PO4 3-