Unit 2: Population Density and Distribution
1/64
There's no tags or description
Looks like no tags are added yet.
Name | Mastery | Learn | Test | Matching | Spaced |
|---|
No study sessions yet.
65 Terms
Demography
The study of human populations
Population density
The number of people per unit of area
Remember, the method used to calculate density reveals different information about the pressure that the population experts on the land
Population distribution
The pattern of where people live
How to calculate arithmetic population density
Divide a region’s population by its total area
How to calculate physiological population density
Divide a region’s population by the amount of arable land (land that can be farmed)
How to calculate agricultural population density
Divide the number of farmers in a country by the amount of arable land (land that can be farmed)
Demographers
People who study the demographics of human populations
Demographics
Statistical data relating to the population and groups within it
Reasons to study demographics:
Resource allocation
Economic planning
Political representation
Social policy/public health
Migration
Population change
Population pyrmaid
An age-sex composition graph that can provide information on birth rates, death rates, life expectancy, economic development, migration, and past events like natural disasters, wars, epidemics, etc.
Used to assess population growth and decline and used to predict markets for goods and services
Irregularities can reveal information about changes in population due to disasters and conflicts, migration patterns, and population control methods
Birth deficit
A slow down of births, often occurring during times of conflict, economic downturn, or cultural shifts
Baby boom
A spike of birth rates
Baby bust
The end of a baby boom, lasting until boomers reach childbearing age
Echo
A spike in birth rates once baby boomers have reached childbearing age
Crude birth rate (CBR)
The number of live births per year for every 1000 people
Crude death rate (CDR)
The number of deaths per year for every 1000 people
Natural increase rate (NIR)
The difference between the CBR and CDR; a statistic that estimates the population growth of a country, not including population loss or gain due to migration
NIR = CBR - CDR
Doubling time
A measurement of how long a country will take to double its population, based on its NIR
Doubling time = 70/NIR
Total fertility rate (TFR)
The average number of children born per woman
Reflective of cultural norms (aged 15-49)
Higher in the past than it is today
A TFR of 2.1 is needed to maintain a country’s population
Infant mortality rate (IMR)
A measure of the number of babies who die before their first birthday for every 1000 births
Happens due to a lack of access to healthcare, inadequate housing, poverty, unemployment, low to no maternal education
Life expectancy
The average number of years a person can be expected to live, given current social, economic, and medical conditions
Demographic transition model (DTM)
A model of the 5 typical stages of population change that countries pass through as they modernize
Cannot move backwards
Each stage lasts for an indeterminate period of time
Stage 1 of the DTM
Birth rate: High due to agricultural labor
Death rate: High due to diseases and poor sanitation
Population change: Very low
Population structure: Very young

Stage 2 of the DTM
Birth rate: High but fluctuating due to the desire for big families
Death rate: rapidly declining due to better nutrition, sanitation, and improved medical treatment
Population change: Rapid growth since death rates are falling faster than birth rates
Population structure: Very young

Stage 3 of the DTM
Birth rate: Declining due to urbanization decreasing the need for child labor
Death rate: Declining, not as fast as the previous stage though
Population change: Still growing but slowing down as BR declines
Population structure: Young with rising life expectancy

Stage 4 of the DTM
Birth rate: Low, but enough for a stable population
Death rate: Low and stable
Population change: Very low growth since birth and death rates are low
Population structure: Balanced but there are more people aging
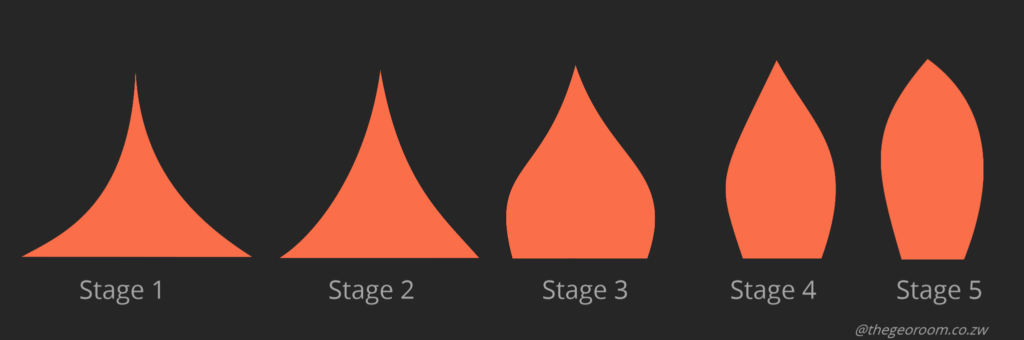
Stage 5 of the DTM
Birth rate: So low that it falls below the death rate
Death rate: Low, but sometimes increases as the population ages
Population change: Declining since birth rate falls below the death rate
Population structure: Older

Epidemiological Transition Model (ETM)
Predictable stages in disease and life expectancy that countries experience as they develop
Explains causes of changing death rate
Corresponds to the Demographic Transition Model
Stage 1 of the ETM
Description:
Parasitic infections
Infectious diseases
Accidents
Animal attacks
Human conflicts
Impact on population:
High death rate
Low life expectancy
Stage 2 of the ETM
Description:
Decline of pandemics
Result of improved sanitation, nutrition, and medicine
Impact on population:
Decreasing death rate
Increasing life expectancy
Stage 3 of the ETM
Description:
Infections/parasitic diseases decline
Aging diseases increase
Impact on population:
Death rate stabilizes at a low level
Life expectancy increases
Stage 4 of the ETM
Description:
Extension of stage 3
Age-related diseases such as Alzheimer’s and Dementia
Impact on population:
Death rate reaches its lowest level
Life expectancy reaches a peak
Stage 5 of the ETM
Description:
Infectious diseases and parasitic diseases become resistant to antibiotics and vaccines
Impact on population:
Life expectancy decreases
Malthusian Theory
Society is on the path to mass starvation. Food production will increase but so will population and faster! So, people should limit the number of children they have
Thomas Malthus
Criticisms:
Unrealistic - the supply of resources is not fixed
Population growth leads to new ideas and manpower
Doesn’t account for new areas/regions
Poverty and hunger - caused by institutions
Neo-Malthusians
People who have adopted Malthus’ ideas to modern conditions and believe overpopulation is a threat to the future and must be controlled
Advocate for population planning
Dependency ratio
The percentage of people within a population who are either too young or too old to work and must be supported by working adults 78i
Pronatalist policies
Programs aimed to increase the fertility rate of a place
Replace lost population
To build up the military
Replace retiring workers
Occupy empty parts of the country
Develop nation’s resources
Support increasingly older populations
Examples of pronatalist policies
Banning contraception
Discouraging family planning
Maternity leave
Discouraging abortion
Government-sponsored dating agencies
Subsidized child care
France’s pronatalist policy
1939
Gave pensions, tax breaks, etc. for mothers
Cash incentives
Generous maternity leave
Banned sale of contraceptives
Subsidized child care
Antinatalist policy
Programs aimed to decrease the fertility rate of a place
Cannot afford to provide for more people
Overpopulation
Limited resources
Women needed in workforce
To repress a group of people
Examples of antinatalist policies
Later marriage
Education for women
Access to free contraception
Family planning
Ad campaigns to promote smaller families
Forced sterilization programs
China’s antinatalist policy
1979-2015
Not forced, but could sign a contract to have only one child
Free medical care
Free daycare, school, and guarantee a job for the child
Better housing
Extra maternity leave
Migration
The permanent or semipermanent relocation of people from one place to another
Immigrate
To move to a country from somewhere else
Emigrate
To move away from a country to somewhere else
Internal migration
The permanent or semipermanent movement of individuals within a country
Transnational migration
The permanent or semipermanent movement of individuals between countries
Forced migration
A type of migration where people do not choose to relocate, but do so under threat of violence
Due to war, exile, persecution, etc.
Slavery
Refugee
Asylum seeker (wants to become a refugee)
Internally displaced persons (doesn’t move across a border)
Voluntary migration
Migration done by choice
People are compelled to move to seek out better opportunities or better quality of life
Chain (follow migratory path of friends or family)
Step (move to eventual destination through small steps)
Guestworker (temporary permission to immigrate to work in another country)
Trasnhumance (seasonal migration that pastoral herders make with their animals based on availability of food)
Push factor
Negative circumstances, events, or conditions present where someone lives that make them want to leave
Extreme temperature
Crime
War
Pollution
Lack of rights
Low wages
High taxes
Pull factor
Positive conditions or circumstances that draw people to choose a destination
Friends/family
Climate
Clean air/water
Educational opportunities
Safety
Peace
Intervening obstacles
Barriers that make it difficult for migrants to reach their desired destination
Physical barriers
Discrimination
Pirates
Closed borders
Tied down by dependents
Cannot obtain passport
Intervening opportunities
Something that causes a migrant to choose a destination other than the one they originally intended
Cheaper housing
Job opportunity
Relationships
Ravenstein’s Laws of Migration
A set of 11 laws proposed by Ernst Ravenstein in 1885 that describe why immigrants move, how they move, and their characteristics
Short distances - most migrants only travel short distances
Larger not smaller - most likely to come from large centers than small towns
Rural to urban - migrants tend to move from rural areas to urban areas
Families play it safe - families are less likely to migrate across international borders
Counter migration - every migration flow produces a counter migration in the opposite direction
Women stay close - females migrate within their home country; male migrants migrate internationally
Urban growth - Large cities/towns grow more through migration than natural births
Economic opportunity - migration creates more opportunities and innovation, leading to economic growth
All about the money - migration mainly occurs for economic reasons
Away from agriculture - migrants tend to move away from agricultural communities to areas where they have better pay
Breaking barriers - migration increases as technology and transportation improve
Net migration rate
The difference between the number of immigrants and the number of emigrants in a place in a year
Net = number of immigrants - number of migrants
Migration flow
The immigrants entering or leaving a place during a given period of time
Internal migration
What motivates it?
Claiming land of frontier, establishing settlements
Better economic opportunities and wages
3 main patterns:
Rural to urban
Urban to suburban
East to west
Transnational migration
What motivates it?
Escaping violence and persecution
Better employment
Quality of life
Largest transnational migration flow:
Asia to Europe
Latin American to United States
Poorer countries to wealthy, oil-producing countries
Transnational migration in the United States
17th and 18th - Colonial settlement
2 million Europeans
650,000 slaves
Late 19th and early 20th - Mass European immigration
Ireland, Germany, Norway, Sweden, Italy
Late 20th and early 21st - Asian/Latin America
Mexico, Central, China, Vietnam, India
Unauthorized immigrant
A person who enters a country without the proper documentation or permission
Driven by desire for safety, better quality of life, more opportunities
Main source countries:
Mexico
Guatemala
Nicaragua
Honduras
China
India
El Salvador
Where do they settle:
Texas
California
Selective immigration
Process to control immigration that bars individuals of certain backgrounds and gives preference to others who have traits that are viewed favorably
Immigration quota
A law that limits the number of prospective immigrants who can be admitted into a country every year
Affect society by:
Less workers
Less diversity
Discriminatory attitudes
US Immigration quotas
1882 Chinese Exclusion Act
25,000 Chinese immigrants settled in California by 1850
1st American immigration quota introduced, banning Chinese laborers
1921 Emergency Quota Act
Limited annual migration to 3% of the total number of people from that country that were already in the US
1924 National Origins Act
Limited annual migration to 2% of the total number of people from that country that were already in the US; excluded southern and eastern Europeans and Asians; Mexicans exempted since they were needed for work
1965 Immigration and Nationality Act
Ended policy of restricting immigration with quotas based on nationality; based on reuniting immigrant families and attracting skilled labor
Impacts of Immigration on Migrants
Economic:
Positive:
Better paying jobs
Better working opportunities
Negative:
Lack of job opportunities
Low minimum wage
Social:
Positive:
Less persecution
Better access to basic services
Negative:
Discriminatory acts
Lack of affordable housing
Political:
Positive:
Less violence
Government stability
Negative:
Instability due to changing immigration laws
Laws not reflective of culture values
Environmental:
Positive:
Favorable climate
Less pollution
Less natural disasters
Negative:
Natural disasters
More pollution
Less favorable climate conditions
Remittances
Money sent from a foreign worker to friends and family in their country of origin
Benefits:
Beneficial to recipients (50% - 80% of household income)
Benefits economy
Drawbacks:
Widens gap of inequality within developing countries, and government becomes dependent
Brain Drain
Emigration of skilled workers to other countries
Move from less to more developed
Search for better work, educational opportunities, improved living conditions, etc.