Binding
 Call Kai
 Learn
Learn Practice Test
 Spaced Repetition
 Match
Match Flashcards
 Knowt Play
1/13

There's no tags or description
Looks like no tags are added yet.
Name | Mastery | Learn | Test | Matching | Spaced | Call with Kai | Chat |
|---|
No analytics yet
Send a link to your students to track their progress
14 Terms
Binding (Definition)
Binding is a process by which a protein or any biological macro molecule interacts with the ligand.
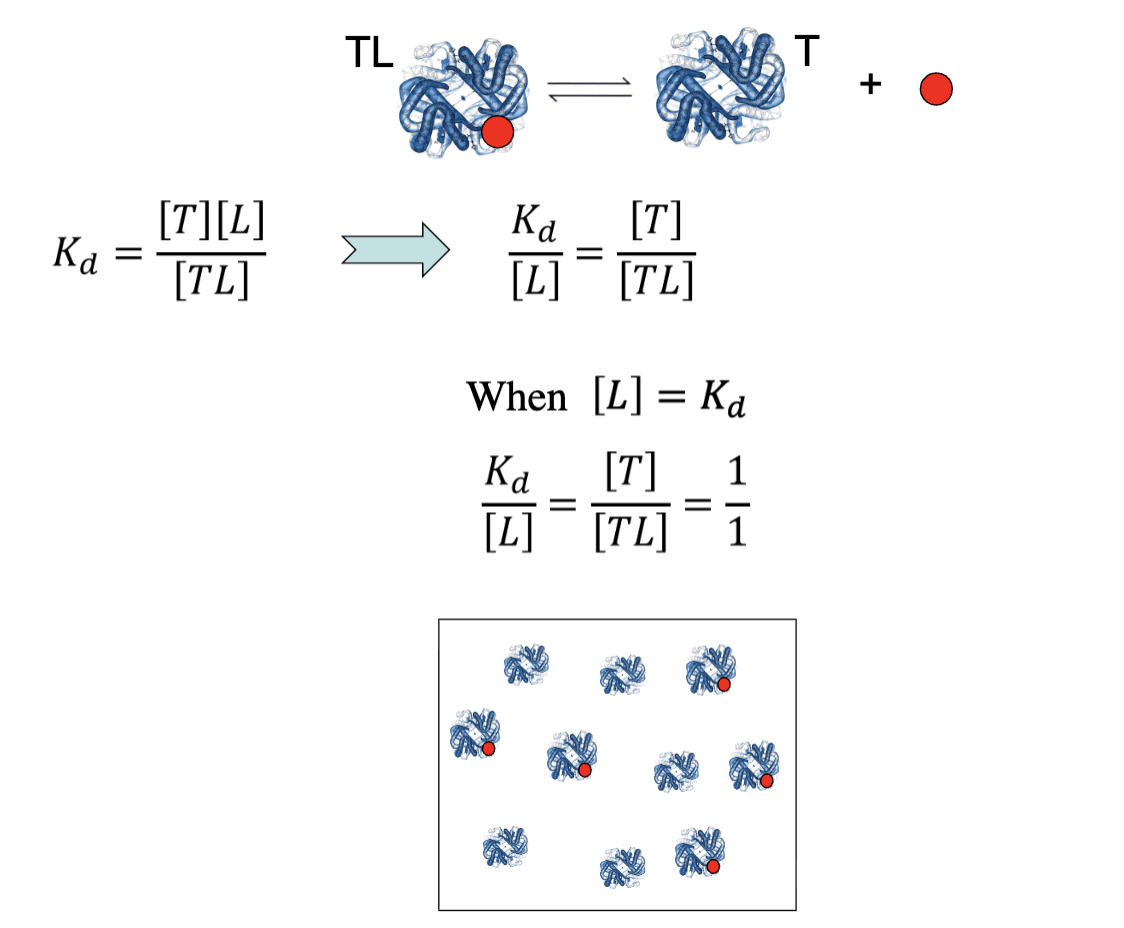
A binding equilibrium
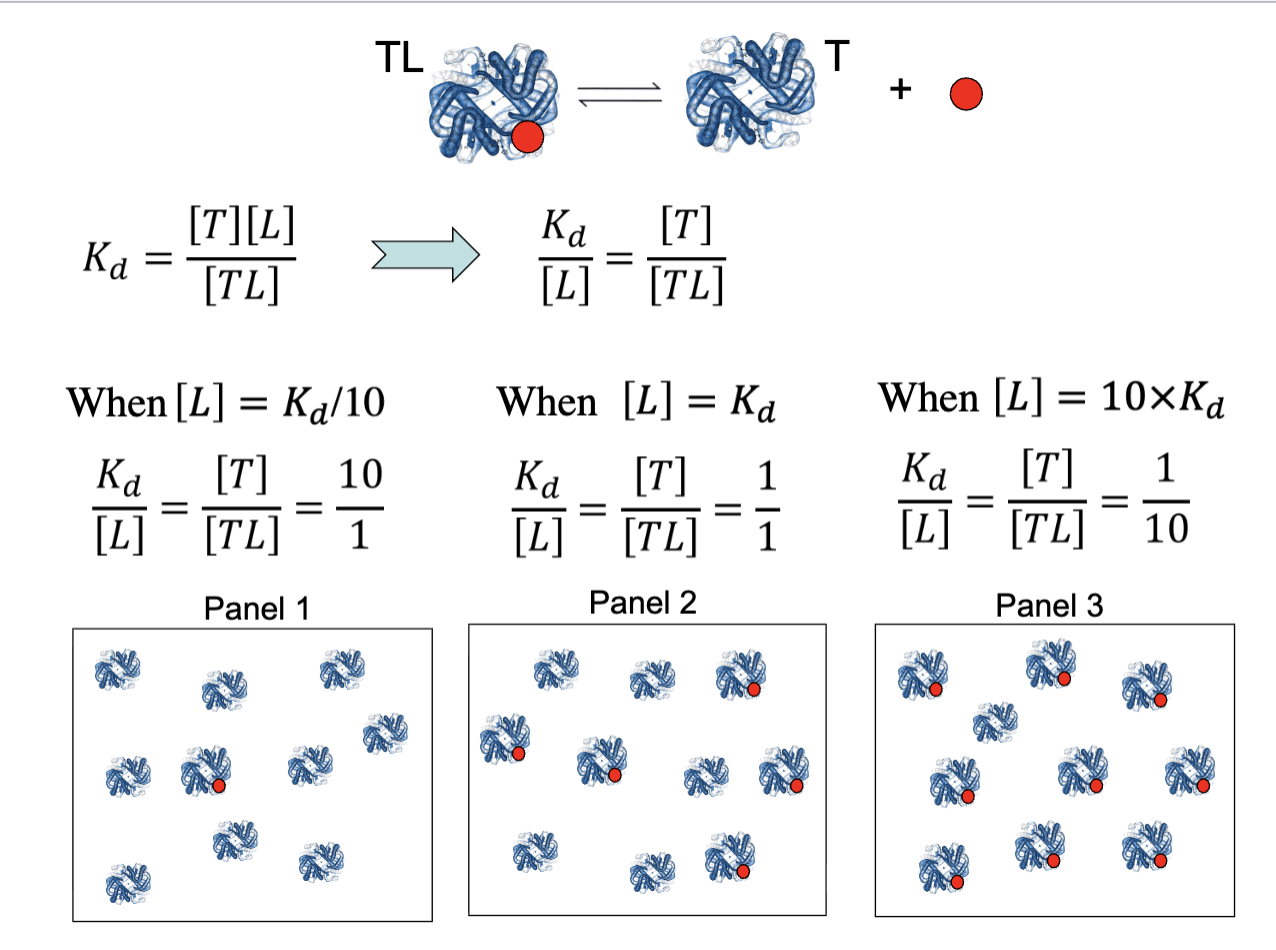
is schematically represented here by the blue protein molecule, which can bind a ligand, represented by the red ball. Shown are the two possible states. The bound state depicted as TL and the free state, depicted as T.

Dissociation Constant
Binding equilibria are usually described by the dissociation constant, Kd, which is typically represented as the ratio of the product of the concentration of unbound species or dissociated components, over the bound species.
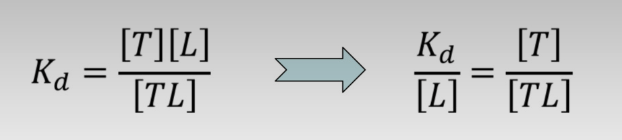
Although technically correct, this is not a particularly straightforward way to understand the significance of the binding constant.
However, rearranging this expression by moving the ligand concentration to the left side of the equation results in a more intuitive representation of binding, where it becomes clear that by comparing the ligand concentration to the Kd, one immediately gets the ratio of bound to free protein.

Interpreting Kd with Ligand Concentration
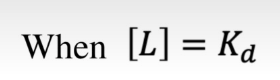
This can be demonstrated for the case where the ligand concentration [L] is equal to the Kd.
Plugging this into the expression reveals that when this ratio is equal to one, so too is the ratio of bound to free forms of the protein as shown in the panel, thus giving us an intuitive understanding of the binding constant.

Namely, it is the concentration of ligand where half of the protein molecules have a ligand bound and half do not.
when the ligand concentration is either below or above the Kd.
For example, when the ligand concentration is say 1/10 the Kd, then the bound form of the protein will be 1/10 of the free form as shown in the panel.
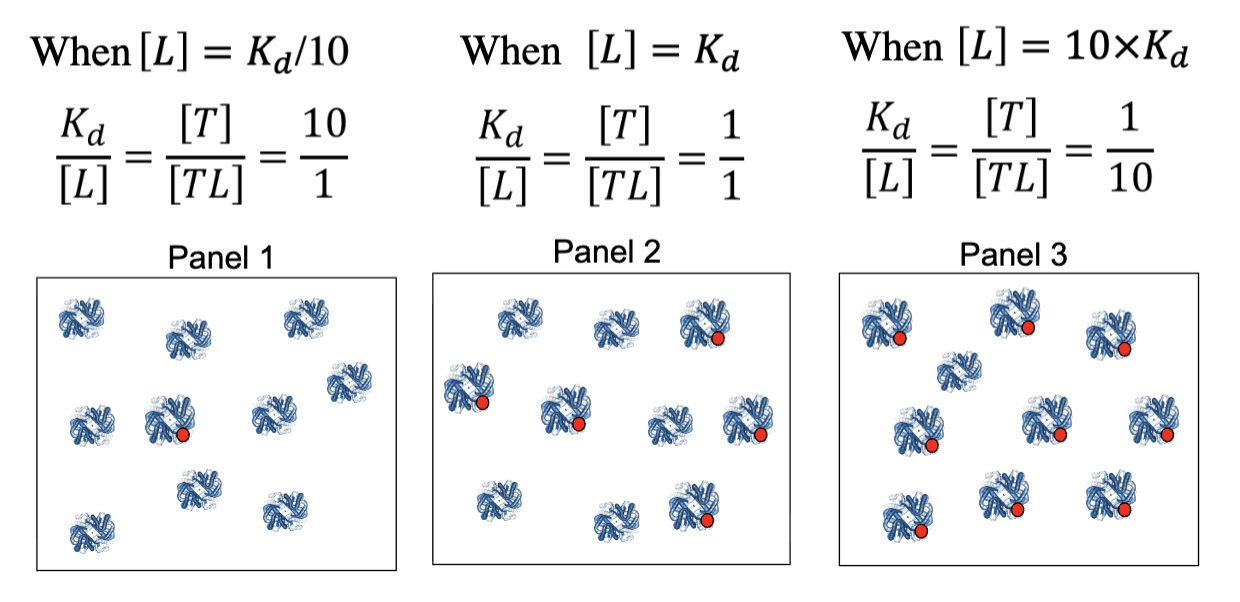
Similarly, when the ligand concentration is ten times the Kd, so too will the ratio of bound to free form of the protein has shown once again in the panel.
bound or free
by knowing whether the bound or free form of the protein is dominant, we know immediately whether the ligand concentration is above or below the Kd.
At low ligand concentration, the free form is dominant as panel 1 indicates.
When ligand concentration equals Kd, the bound and free forms are equal as shown in panel 2.
And when the ligand concentration exceeds the Kd, the bound form dominates as panel 3 reveals.
Binding Isotherm
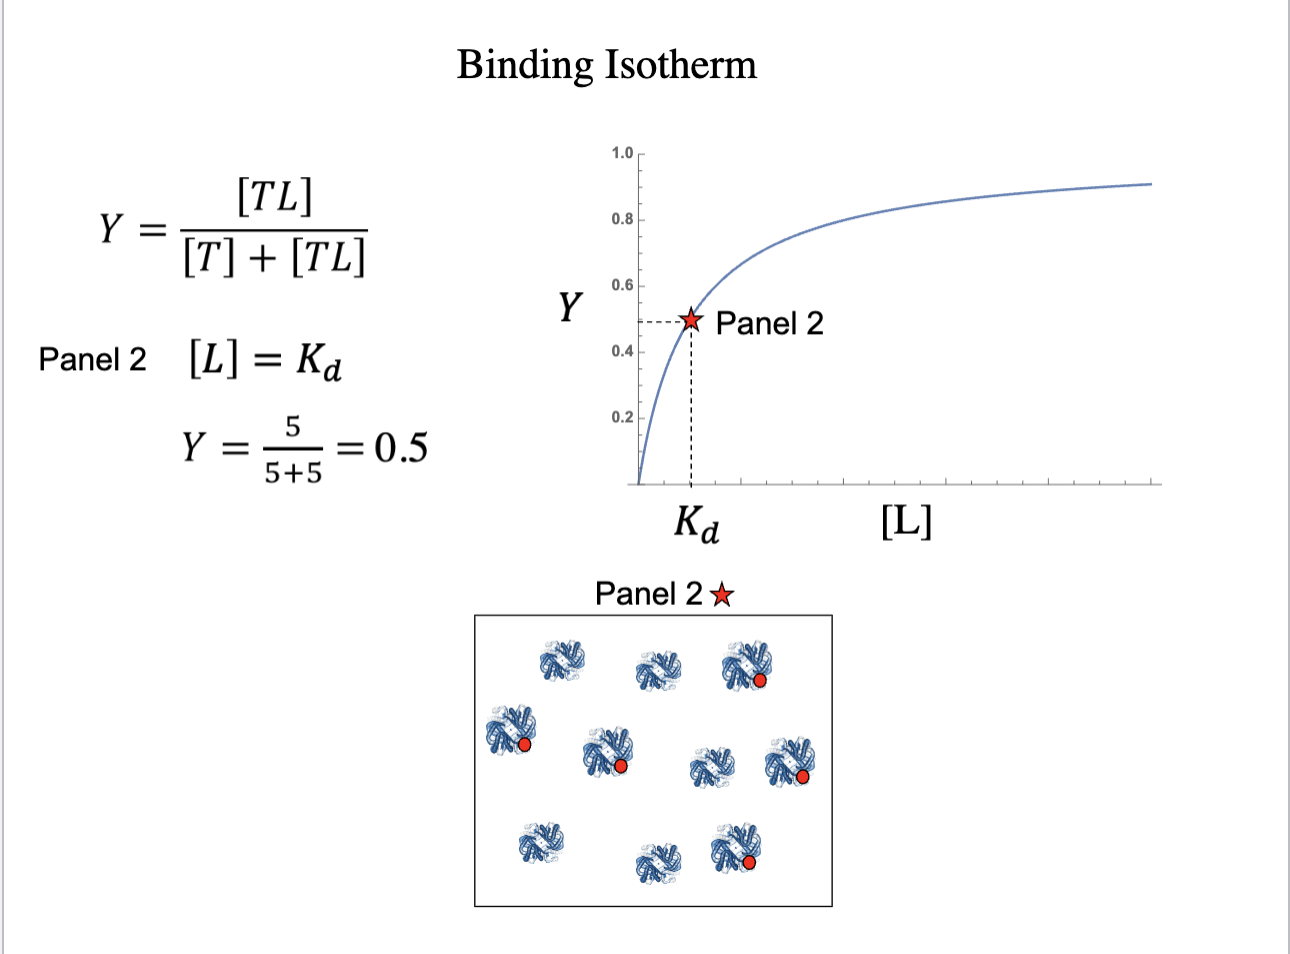
Binding reactions are usually depicted graphically using what is called a binding isotherm, which is a plot of the fraction of protein that is bound, (y) versus the ligand concentration (x).
The fraction bound is simply a graphical representation of what we show using the panels.
As the Y axis reveals, the fraction bound varies between zero and one. T
value of y is when the ligand concentration is equal to the Kd. fraction bound is the ratio of the bound protein to the total protein, which is 5 over 10, or 0.5.
Thus, the Kd can be directly inferred from a binding Isotherm, as it is the ligand concentration where half of the protein molecules are bound, or y equals 0.5.
Interpreting the Binding Isotherm with Panel Examples
We can also use the binding isotherm to see where our other panels appear on the graph.
In the case of panel 1 where the bound form is 1/10 of the free form, y equals 0.1.
Similarly, in the case of Panel 3, where the bound form is 10 fold the free form, Y equals 0.9.
binding
Kd vs ligand concentration
Binding Isotherm

Summary
Binding:
* The binding is described in terms of the dissociation constant (i.e., Kd), which when compared to the ligand concentration (i.e., [L]), provides the ratio of unbound (i.e., [T]) and bound (i.e., [TL]) forms of the protein.
* Binding is graphically represented using a ‘binding isotherm’, wherein the Kd can be identified at the ligand concentration where the fractional saturation (i.e., Y) is 1/2.

comparing Kd
lower means higher binding affinity