maths
1/266
Earn XP
Description and Tags
Name | Mastery | Learn | Test | Matching | Spaced | Call with Kai |
|---|
No analytics yet
Send a link to your students to track their progress
267 Terms
The five ways to prove triangles congruent
Side angle side, side side side, angle side angle, angle angle side and hypotenuse leg theorem
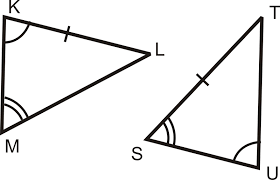
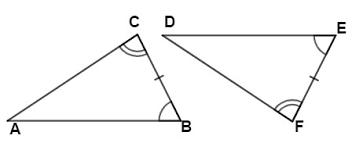
What are these triangles congruent by
Angle angle side
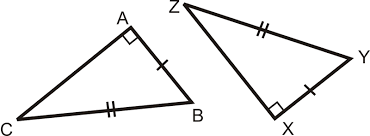
What are these triangles congruent by
Hypotenuse leg theorem
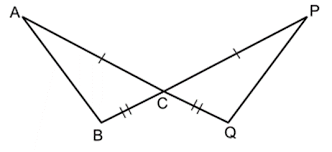
What are these triangles congruent by
Side angle side
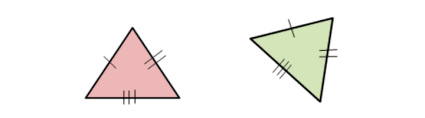
What are these triangles congruent by
Side side side
What are these triangles congruent by
Angle side angle
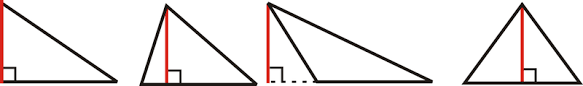
what is the red line on all these called
An altitude
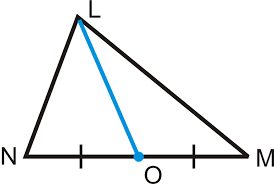
What would the blue line on this triangle be called
The median
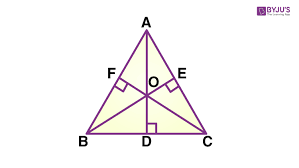
What would point O be called on this graph
The orthocenter
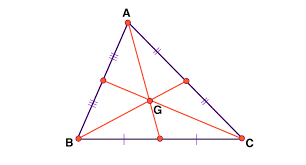
What would point G in this image be
The centroid
what is the formula for the centroid of a triangle
((x₁+x₂+x₃)/3,(y₁+y₂+y₃)/3)
Definition of midpoint
The middle point of a line segment.
definition of perpendicular
A straight line at an angle of 90°
Definition of parallel
Extending in the same direction, equidistant at all points, and never converging or diverging
Definition of angle bisector
A line that splits an angle into two equal angles
What is a scalene triangle
It is a triangle with no equal sides
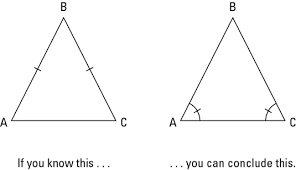
What is an isosceles triangle
A triangle that has two equal sides
What is an equilateral triangle
A triangle in which all sides are equal
What shortcuts can you not take when proving triangles congruent
Angle side side and Angle angle angle
What does CPCTC stand for
Corresponding Parts of Congruent Triangles are Congruent
What are these angles called
Corresponding angles
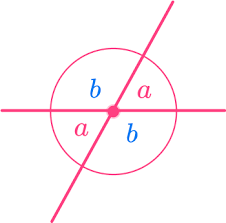
What theorem could you use to find what is equal to each other in this picture
Vertical Angles theorem
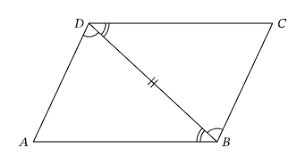
how do you know that DB is equal to BD
Reflexive property
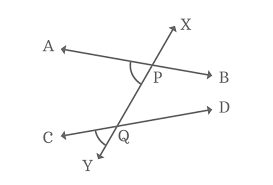
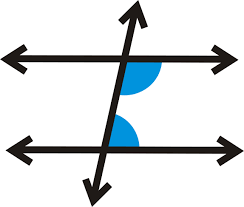
What are these angles
Alternate interior angles
What are these angles
Alternate exterior angles
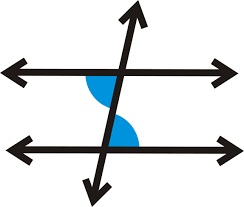
What are these angles
Same side interior angles
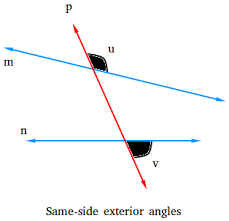
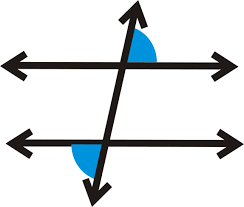
What are these angles
Same side exterior angles
What theorem is this
Isosceles triangle theorem
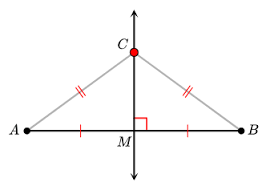
What theorem is this
Perpendicular bisector theorem
Data Representation
Involves interpreting graphs and understanding frequency tables.
Probability
Includes basic probability calculations and the use of tree and Venn diagrams.
Sampling
Encompasses different sampling methods (random, stratified, systematic) and considerations for bias and sample size calculations.
Statistical Measures
Involves understanding range, mean, median, mode, interquartile range, and standard deviation.
Hypothesis Testing
Focuses on formulating null and alternative hypotheses, conducting tests, and interpreting significance levels.
Scatter Graphs and Correlation
Includes drawing scatter graphs, identifying correlation, and interpreting correlation coefficients.
Time Series Analysis
Involves interpreting time series data, recognizing trends, patterns, and making predictions.
Critical Evaluation
Focuses on evaluating statistical methods, identifying limitations, improvements, and drawing conclusions.
Practical Applications
Applying statistical concepts to real-life scenarios, problem-solving, and effectively communicating findings.
t-Test
t = \frac{\bar{x} - \mu}{\frac{s}{\sqrt{n}}}
Sample Mean
\bar{x}
Population Mean
\mu
Sample Standard Deviation
{s}
Sample Size
{n}
Chi-Square Test
\chi^2 = \sum \frac{(O_i - E_i)^2}{E_i}
Observed Frequency in Category {i}
{O_i}
Expected Frequency in Category {i}
{E_i}
Type I Error
A false positive, meaning that you falsely reject a true null hypothesis.
Type II Error
A false negative, meaning that you fail to reject a false null hypothesis.
In real life scenarios, Type II Errors commonly result in more serious/dangerous errors than Type I.
You can never __________ a __________ hypothesis.
Accept; Null.
Null Hypothesis
H_0: \text{No effect or difference}
Alternative hypothesis
\newline H_1: \text{There is an effect or difference}
Significance Level
\alpha = 0.05\ (5\%)
Low p-value (< .05)
→ strong evidence against null evidence indicating a significant effect of observations
High p-value (≥ .05)
→ weak/insufficient evidence against null hypothesis indicating observations are likely a coincidence/random chance
Random Sampling
Every member of the population has an equal chance of being selected
Systematic Sampling
Selecting every nth member from a list
Stratified Sampling
Population divided into subgroups, sample taken from each subgroup
Cluster Sampling
Population divided into random groups (clusters), then the clusters to collect data from are randomly selected
Quota Sampling
Non-probability, balanced method in which the population is divided into groups (quotas) based on categories (i.e., age, gender, etc.) to ensure each quota has an equal size.
Probability of an Event Formula
P(E) = \frac{\text{Number of favorable outcomes}}{\text{Total number of outcomes}}
Complementary Events Formula:
P(\text{not } E) = 1 - P(E)
Range
Difference between the highest and lowest values
Formula: \text{Range} = \text{Max} - \text{Min}
Standard Deviation
Square root of the variance
Formula: \sigma = \sqrt{\frac{\sum{(x - \bar{x})^2}}{n}}
Mean
Sum of all values divided by the number of values
Formula: Mean = Total/Number of Values
Median
Middle value when data is ordered
If even number of values, median is the average of the two central values
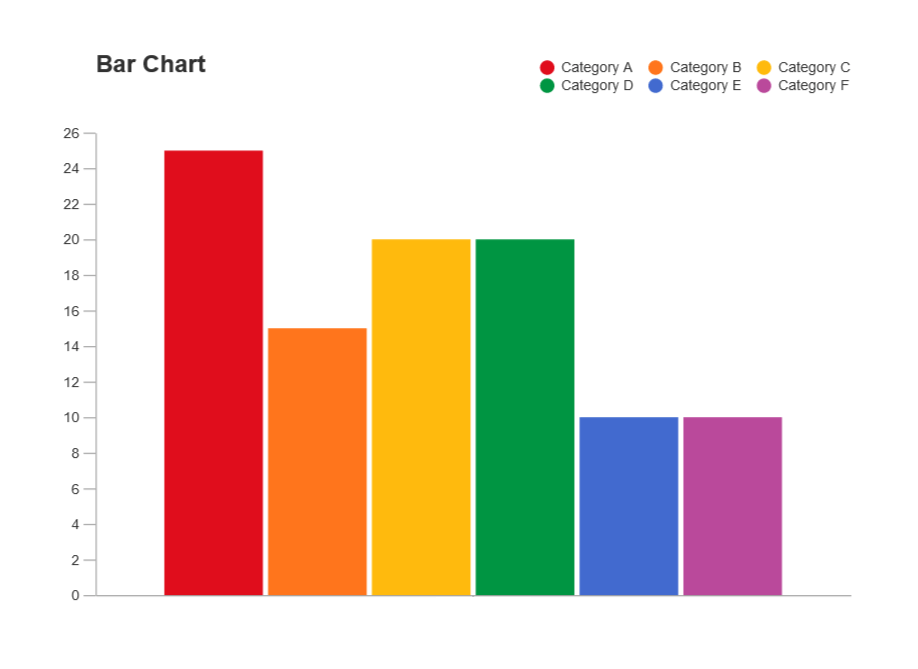
Bar Graph
a graph made of bars whose heights represent the frequencies of respective categories (chapter 2)
Bernoulli Trial
one repetition of a binomial experiment (chapter 5)
Binomial Experiment
an experiment that contains n identical trials such that each of these n trials has only two possible outcomes; the probabilities of these two outcomes remain constant for each trial, and the trials are independent (chapter 5)
Binomial Probability Distribution
the probability distribution that gives the probability of x successes in n trials when the probability of success is p for each trial of a binomial experiment (chapter 5)
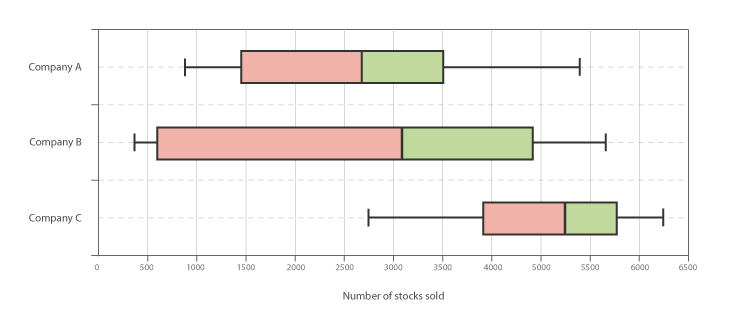
Box-And-Whisker Plot
a plot that shows the center, spread, and skewness of a data set with a box and two whiskers using the median, the first quartile, the third quartile, and the smallest and the largest values in the data set between the lower and the upper inner fences (chapter 3)
Census
a survey conducted by including every element of the population (chapter 1)
Central Limit Theorem
the theorem from which it is inferred that for a large sample size (n ≥ 30), the shape of the sampling distribution of x̄ is approximately normal; also states that the shape of the sampling distribution of p̂ is approximately normal for a sample if np > 5 and nq > 5 (chapter 7)
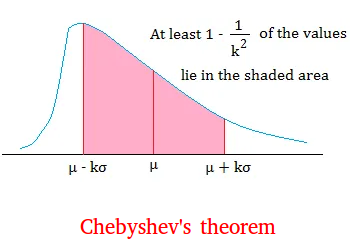
Chebyshev’s Theorem
for any number k greater than 1, at least (1 - 1/k^2) of the values for any distribution lie within k standard deviations of the mean (chapter 3)
Classical Probability Rule
the method of assigning probability to outcomes or events of an experiment with equally likely outcomes (chapter 4)
Combinations
the number of ways x elements can be selected from n elements; order of selection is not important (chapter 4)
Complementary Events
two events that taken together include all the outcomes for an experiment but do not contain any common outcome
EX: true and false, yes and no (chapter 4)
Compound Event
an event that contains more than one outcome of an experiment (chapter 4)
Conditional Probability
the probability of an event subject to the condition that another event has already occurred (chapter 4)
Continuous Variable
a quantitative variable that can assume any numerical value over a certain interval or intervals (chapter 1)
Cumulative Frequency
the frequency of a class that includes all values in a data set that fall below the upper boundary or limit of that class (chapter 2)
Cumulative Frequency Distribution
a table that lists the total number of values that fall below the upper boundary or limit of each class (chapter 2)
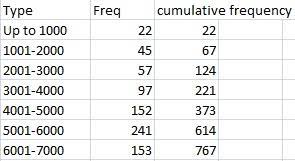
Cumulative Relative Frequency
the cumulative frequency of a class divided by the total number of observations (chapter 2)
Dependent Events
two events for which the occurrence of one does change the probability of the occurrence of the other (chapter 4)
Descriptive Statistics
collection of methods for organizing, displaying, and describing, data using tables, graphs, and summary measures (chapter 1)
Discrete Variable
a quantitative variable whose values are countable (chapter 1)
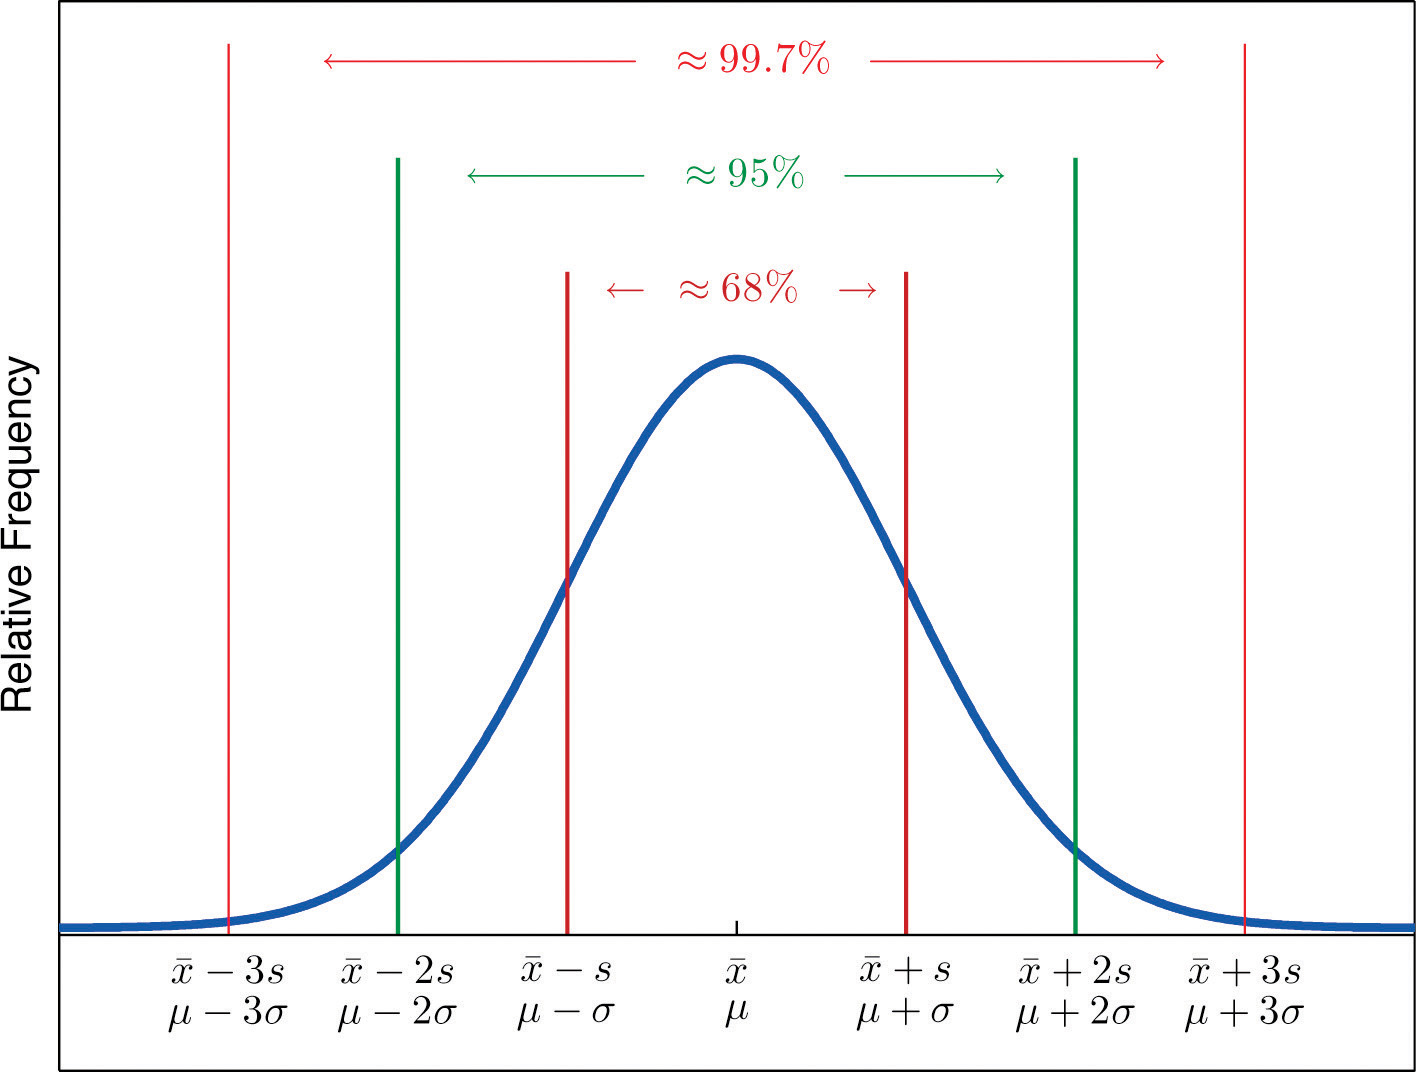
Empirical Rule
for a specific bell-shaped distribution, about 68% of the observations fall in the interval (μ - σ) to (μ + σ), about 95% fall in the interval (μ - 2σ) to (μ + 2σ), and about 99.7% fall in the interval (μ - 3σ) to (μ + 3σ) (chapter 3)
Equally Likely Outcomes
two (or more) outcomes or events that have the same probability of occurrence (chapter 4)
Factorial
denoted by the symbol !; the product of all the integers from a given number to 1
EX: n! = the product of all integers from n to 1 (chapter 4)
Frequency Distribution
a table that lists all the categories or classes and the number of values that belong to each of these categories or classes (chapter 2)
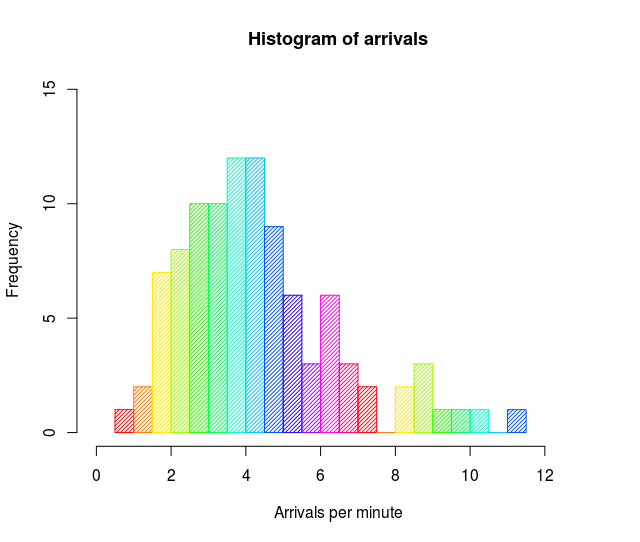
Histogram
a graph in which classes are marked on the horizontal axis and frequencies, relative frequencies, or percentages are marked on the vertical axis represented by the heights of bars that are drawn adjacent to each other (chapter 2)
Hypergeometric Probability Distribution
the probability distribution that is applied to determine the probability of x successes in n trials when the trials are not independent (chapter 5)
Independent Events
two events for which the occurrence of one does not change the probability of the occurrence of the other (chapter 4)
Inferential Statistics
collection of methods that help make decisions about a population based on sample results (chapter 1)
Interquartile Range (IQR)
the difference between the third and the first quartiles (chapter 3)
Intersection of Events
given by the outcomes that are common to two (or more) events (chapter 4)
Joint Probability
the probability that two (or more) events occur together (chapter 4)
Law of Large Numbers
theory which states that if an experiment is repeated again and again, the probability of an event obtained from the relative frequency approaches the actual/theoretical probability (chapter 4)
Margin of Error
the quantity that is subtracted from and added to the value of a sample statistic to obtain a confidence interval for the corresponding population parameter (chapter 8)
Marginal Probability
the probability of one event or characteristic without consideration of any other event (chapter 4)
Mean
a measure of center calculated by dividing the sum of all values by the number of values in the data set; denoted by μ (chapter 3)