AP Statistics Unit 1: Exploring One-Variable Data
1/27
Name | Mastery | Learn | Test | Matching | Spaced | Call with Kai |
|---|
No analytics yet
Send a link to your students to track their progress
28 Terms
Quantitative Variable
Thsi type of variable takes on numerical values for measured or counted quantities
Categorical Variable
Takes on values that are category names or group labels
16/23
What is the marginal proportion in this table
(External out of all students)

3/23
What is the joint proportion in this table
(Internal Math out of all students)
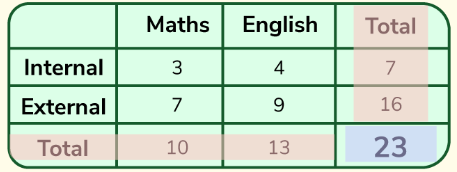
3/7
What is the conditional proportion in this table
(Internal out of math)

0
To avoid misleading graphs, all graphs need to start at ____
Segmented Bar Graph
In this type of graph, the bars stack up to make 100%
Mosaic Plot
In this type of segmented bag graph, the width of the bars is proportional to the group size
Association
Knowing the value of one variable helps us predict the other
Discrete
This type of variable can contain a countable number of values (no decimals)
Continuous
This type of vaariable can contain an infinite number of values (decimals are ok)
Skewed Left
The second graph in this image is _____

symmetrical
The first graph in this image is _____
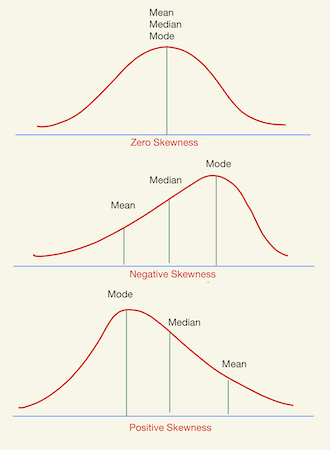
Skewed Right
The third graph in this image is _____

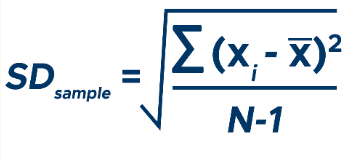
Standard Deviation
Average distance from the mean
Variance
(SD)2
Nonresistant
The mean and Standard Deviation of a data set are ______ because they are greatly affected by outliers
Resistant
The median of a data set is _________ because it is minimally affected by outliers
IQR
Interquartile Range (Q3-Q1)
Low outliers
These are <Q1 - 1.5 * IQR or <mean - 2SD
High outliers
These are >Q3 + 1.5 * IQR or >mean + 2SD
Unimodal
When data is this shape, it has one “peak”
Bimodal
When data is in this shape, it has two “peaks”
Mean
Sum of all values divided by the number of values
Median
“middle value” of a data set
Q1
Median of the first half of a data set (Not including the median)
Q3
Median of the second half of the data set (Not including the median)
Range
Difference between the max and min values