RMA Week 10: distributions and z-scores
1/23
Earn XP
Description and Tags
Name | Mastery | Learn | Test | Matching | Spaced | Call with Kai |
|---|
No analytics yet
Send a link to your students to track their progress
24 Terms
when are density curves useful?
when dealing with lots of participants, generalising results to the population
what is a density curve?
a histogram distribution of scores of participants. they use a mathematical model to describe how the scores of all participants in the population are distributed.
state 2 facts about density curves
the more real data points, the better the fit to the curve
ignore outliers and extreme values
to what side is the peak if a distribution is positively skewed
the left
to what side is the peak if a distribution is negatively skewed
the right
what axis are distributions always presented on
the horizontal (x) axis
what will the area under the curve always exactly equal
1
give an example of how you can make predictions about the overall population if you know certain values of the model (mean or SD)
if the area above the mean = 0.6, 60% of scores will be above the mean
what’s the median on a distribution graph
the point that divides the area into two equal parts - 50% above and 50% below
what are quartiles on a distribution graph
points that divide the area under the curve into quarters - 25% below Q1 and 25% above Q3
what is the mode on a distribution graph
positions at the peak of the curve
what is the mean on a distribution graph
the balancing point of the curve - e.g. - positive deviations from the mean match negative deviations
what are the positions of mean, median and mode on a normal distribution
mean = median = mode (all in the middle)
what are the positions of mean, median and mode on a positively skewed distribution
mode, median, then mean
what are the positions of mean, median and mode on a negatively skewed distribution
mean, median, then mode
what symbol is the sample mean for a distribution
x̄
what symbol is the population mean for a distribution
μ
what symbol is the sample SD for a distribution
S
what is the population SD symbol for a distribution
σ
describe a normal distribution in 5 points
symmetrical
single-peaked
the tails meet the x-axis at infinity
location determined by its mean
shape determined by SD
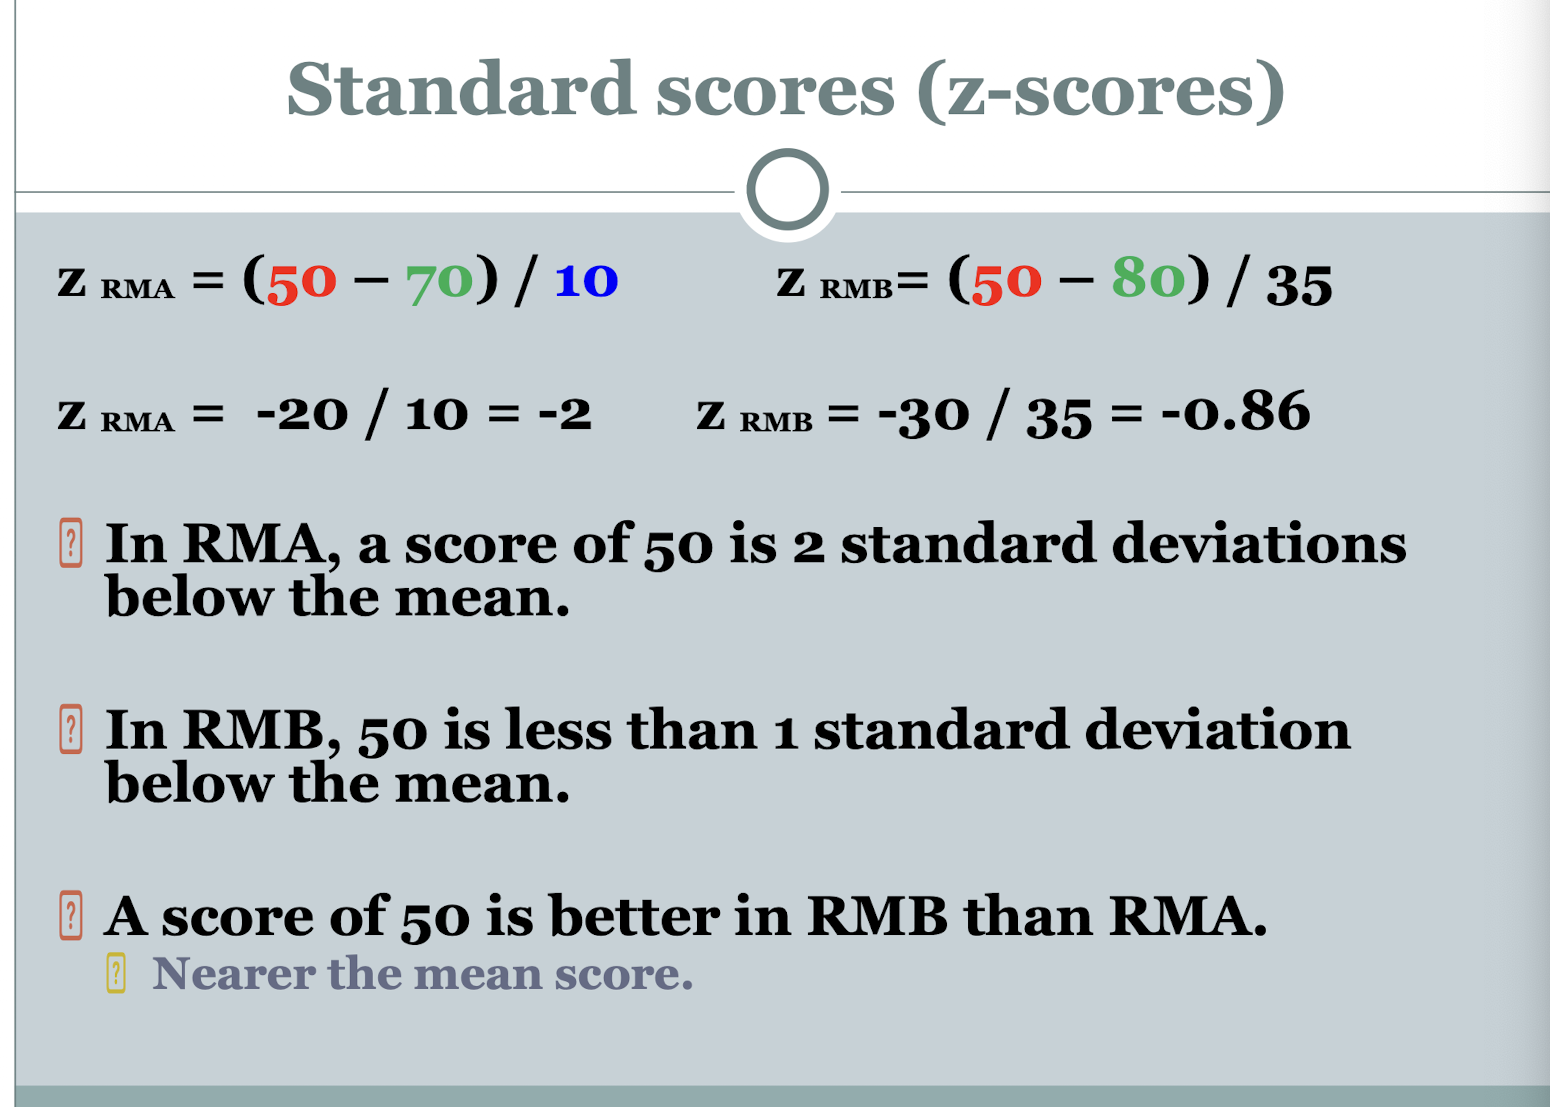
what are standard scores (z-scores) used for
comparing values from different data sets
when we know the mean and SD of the population
not when taking samples
e.g. is a score of 50 in RMA the same as 50 in RMB when they have different means and SDs?
how do z-scores solve the comparison problem between the data sets
by translating both data sets into a standard normal distribution - standardising the data
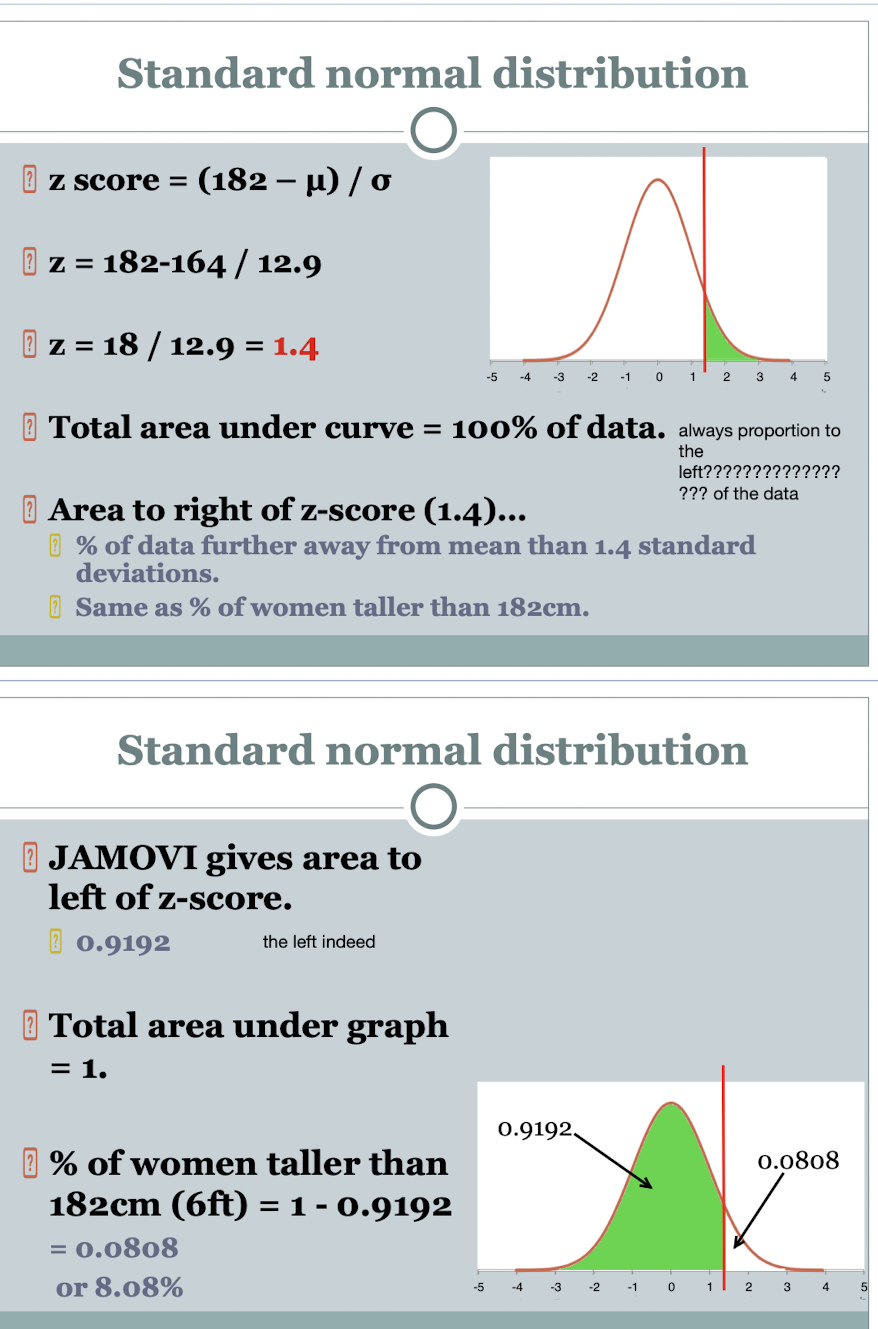
how do you calculate a z-score
the number of SDs that the observation deviates from the mean
Z = deviation of x (the score you’re looking at) from (sample or population) mean / (sample or population) SD
z = x - x̄ / S
how would you calculate a z-score on a graph with the selected figure, population SD and population mean
(score - mean) / SD