Lecture 7 - Repeated Measures ANOVA
1/19
There's no tags or description
Looks like no tags are added yet.
Name | Mastery | Learn | Test | Matching | Spaced |
|---|
No study sessions yet.
20 Terms
Difference in between subjects and within subjects
Within subjects = repeated measures
Between subjects: Each person assigned to one condition only one goal per person
Repeated measures: same people providing multiple observations in multiple conditions at different times
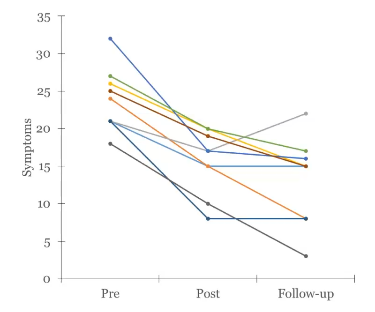
You run a study on PTSD treatment pre, during, and post…. Describe the between-subjects and within-subjects variability
There is a lot of between-subjects variability (people are just different from eachother on average)
Looking at the mean, there is a change over time → within-subject variability across the three measures (change within a subject)
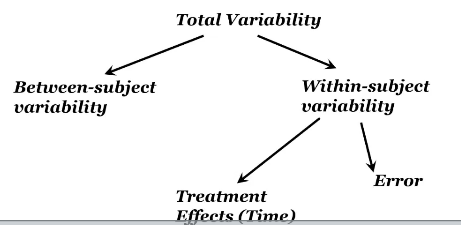
What does partitioning variance mean
In ANOVAs, in the total variability of the DV we want to know how much of the variability is between subjects vs within subjects
We also want to know how much within subjects variability is due to the treatment effect and how much is just error left over
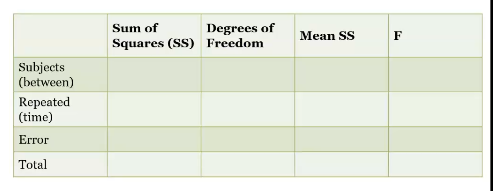
We use a source table to partition variance
Source Table for within subjects ANOVA
Between subjects → compute SS for between subjects to remove between subjects variability and have within subjects left over
Once we have within, we can divide it into error and time (repeated)
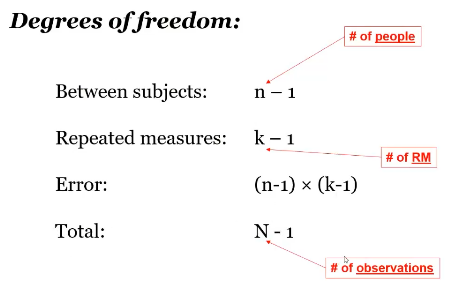
Calculating df
people vs observations (9 people = n) (number of total observations = N)
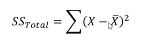
SS total
Calculating between subjects SS
need to know each persons mean (subject mean) *only fill out first two columns for this one (not mean SS or F)
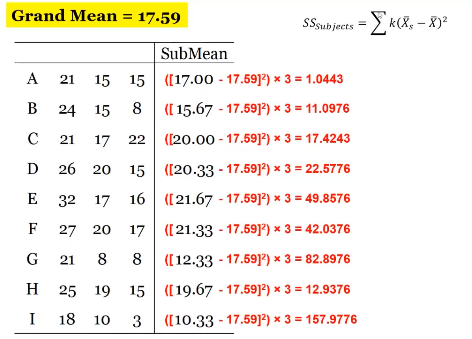
Why dont we fill out SS or F for between subjects variability?
All it would tell us is that people in the sample are on average different from each other, which is almost always going to be the case so it’s not that interesting
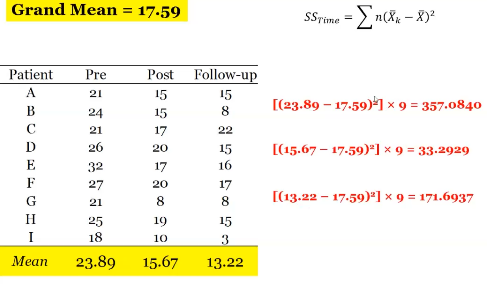
Repeated measures SS
Mean for each observation period
Whatever is repeated = time
Error SS

Calculating mean SS
Dividing SS by df
Mean ss
Devide mean squared by the error term
Now you can use the table (is it higher than the f critical)
What happens when you look at the table and the value is bigger than f critical
The means are different from eachother
What would happen if you used a between subjects ANOVA
Total SS and repeated SS would be the same would be the same
Error would be different
We can remove the variance due to individual differences which makes our error term smaller and have more power
Why are btwn subjects stronger than independent or vise versa
We can remove the variance due to individual differences which makes our error term smaller and have more power
What are the three assumptions in a repeated measure
This test will work properly if…
Observations are normally distributed
Population variances are equal (homogeneity of variance)
Observations are no longer independent → Compound sphericity of the variance and covariations matrix
What does this mean: At each time period you can compute a variance (diaginal)
What does Compound sphericity of the variance and covariations matrix mean?
Compound sphericity of the variance and covariations matrix
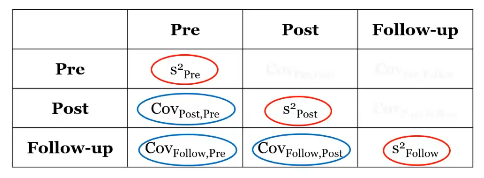
Correlation vs Covariance
Covariance: the strength of the relationship between one variable and another (post and pre = pre and post, making it semetrical) → if the test is nonsignificant, it means all of them are the same, if it is significant, the test is violated
This assumption is often violated
Similar to how variance and sd are if you now one you know the otehr
Same as correlation and covariance
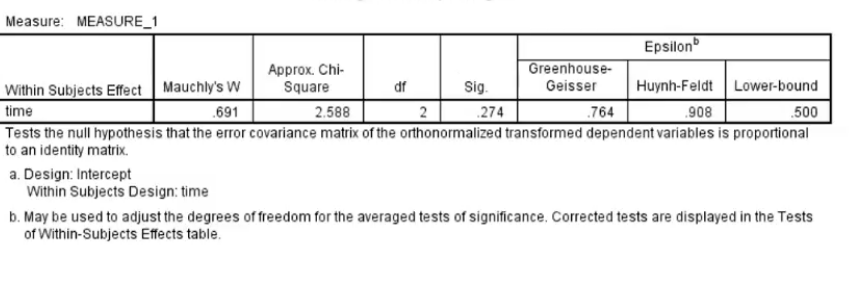
Mochlys Test of Sphericity
Are covariances equal of not
For eg if p=.274 (bigger than 0.05) it is non significant meaning covariances are equal (not statistically different)
Use sherisity assumed line
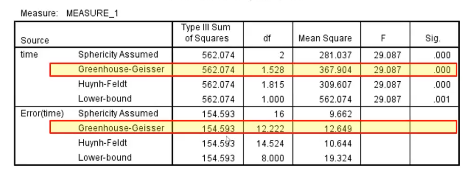
Greenhouse-Geisser
Used if Mauchly’s test is significant
If the compound symmetry assumption is violated, using F-test that assumes compound symmetry can inflate the type 1 error rate (have an effect when you don’t)
Adjusts the df (fewer df)