167 - Quality Methods - Topic 2
1/41
There's no tags or description
Looks like no tags are added yet.
Name | Mastery | Learn | Test | Matching | Spaced | Call with Kai |
|---|
No analytics yet
Send a link to your students to track their progress
42 Terms
What is a descriptive statistic?
Describes the characteristics of a product or process using information collected on it.
What are inferential statistics (inductive)?
Draws conclusions on unknown process parameters based on information contained in a sample.
Uses probability
What is attribute data?
Discrete data. Data values can only be integers. Counted data or attribute data.
What is variable data?
Continuous data. Data values can be any real number. Measured data.
What is precision?
The precision of a measurement is determined by how reproducible that measurement value is.
(For example if a sample is weighed by a student to be 42.58 g, and then measured by another student five different times with the resulting data: 42.09 g, 42.15 g, 42.1 g, 42.16 g, 42.12 g … )
then the original measurement is not very precise since it cannot be reproduced.
What is accuracy?
The accuracy of a measurement is determined by how close a measured value is to its “true” value.
(For example, if a sample is known to weigh 3.182 g, then weighed five different times by a student with the resulting data: 3.200 g, 3.180 g, 3.152 g, 3.168 g, 3.189 g)
The most accurate measurement would be 3.180 g, because it is closest to the true “weight” of the sample.
Six sigma application
What three types of frequency distribution data are there?
Categorical, ungrouped and grouped
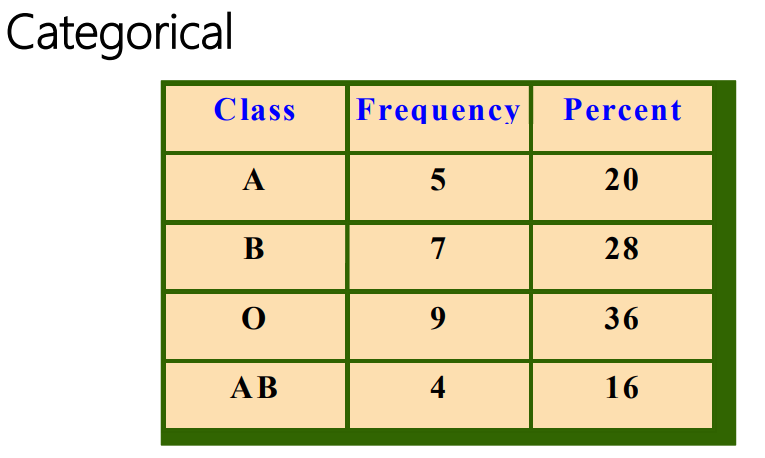
What is categorical frequency distributions?
Data that can be placed in specific categories, such as nominal- or ordinal-level data.
Examples - political affiliation, blood type, etc.
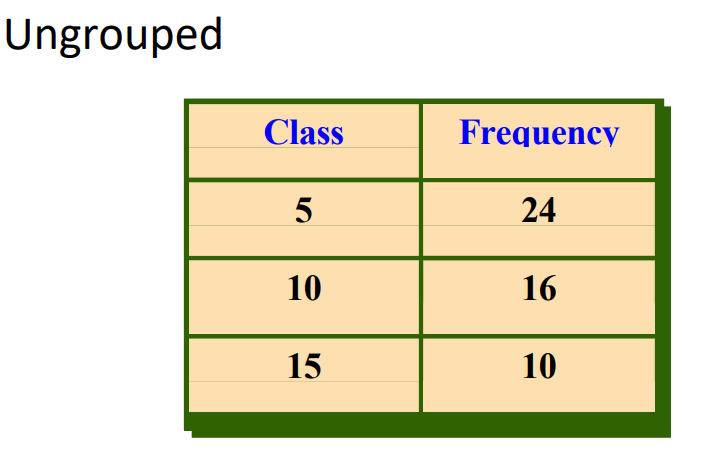
What are ungrouped frequency distributions?
It can be used for data that can be enumerated and when the range of values in the data set is not large.
Examples - number of miles your instructors have to travel from home to campus, number of girls in a 4-child family etc.
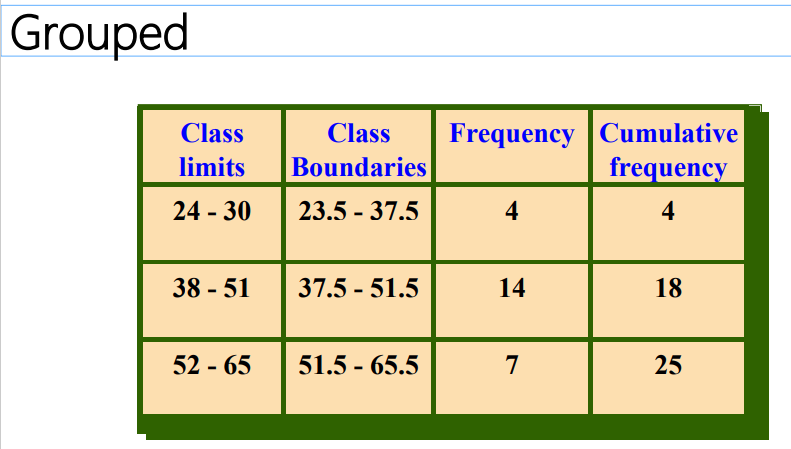
What are grouped frequency distributions?
Can be used when the range of values in the data set is very large. The data must be grouped into classes that are more than one unit in width.
Examples - the life of batteries in hours.
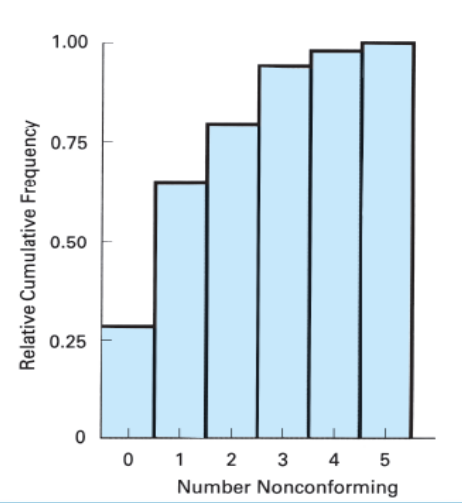
What is a Relative Cumulative Frequency Histogram?
Helps us to observe (and hence find out) the number of data observations that lie below a particular range of data sets.
It also helps us to observe and understand how the values within a particular data set change. It also keeps us updated with the total frequency of everything.
How do you construct a histogram?
Step 1: Find range of distribution, largest - smallest values
Step 2: Choose number of classes, 5 to 20
Step 3: Determine width of classes, one decimal place more than the data, class width = range/number of classes
Step 4: Determine class boundaries
Step 5: Draw frequency histogram
(If no. of observations < 100 – 5 to 9 cells Between 100-500 – 8 to 17 cells Greater than 500 – 15 to 20 cells)
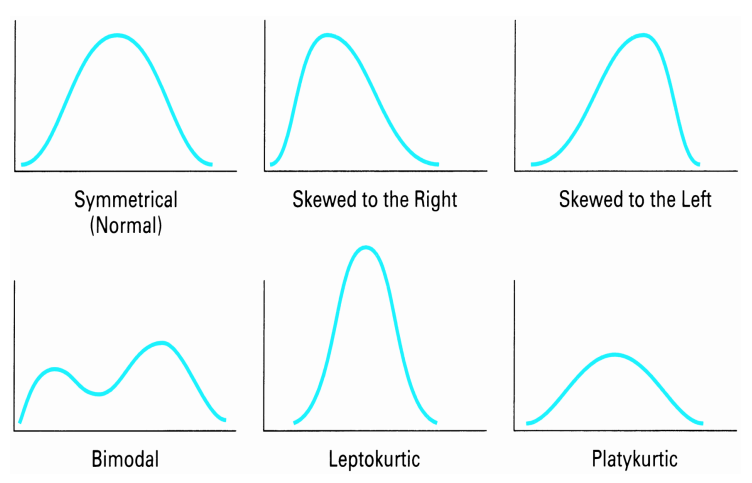
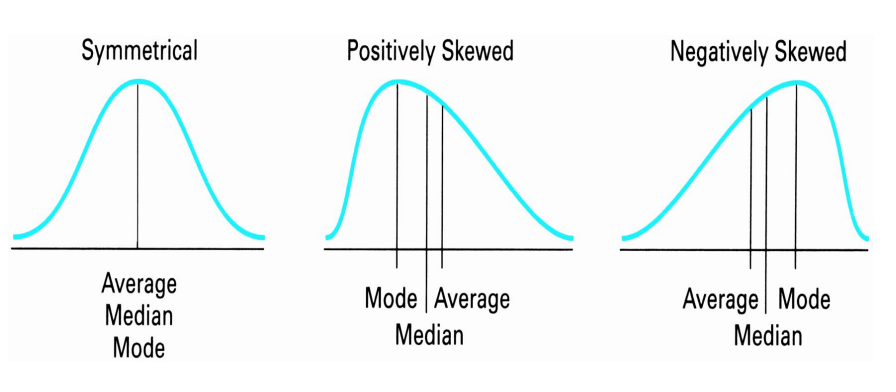
What are the characteristics of different frequency distribution graphs?
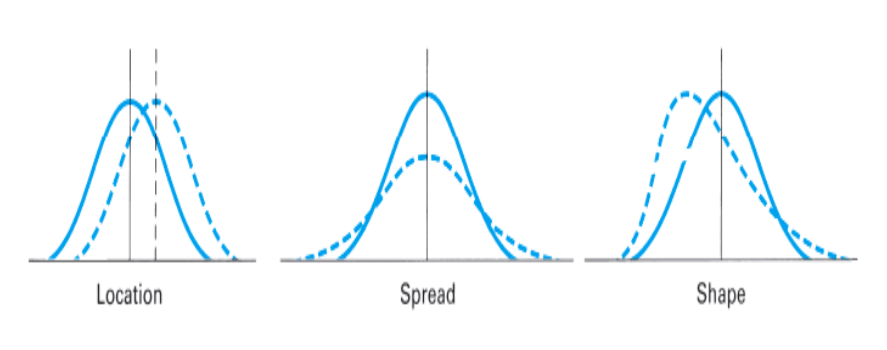
What is the different between location, spread and shape?
Draw and label three graphs: symmetrical, positively skewed and negatively skewed
What are the measures of central tendency?
A measure of central tendency of a distribution is a numerical value that describes the central position of the data or how data tend to build up in the centre
The three measures in common use are the: Average Median Mode
What are the three different techniques for calculating the average?
Ungrouped data, grouped data and weighted average
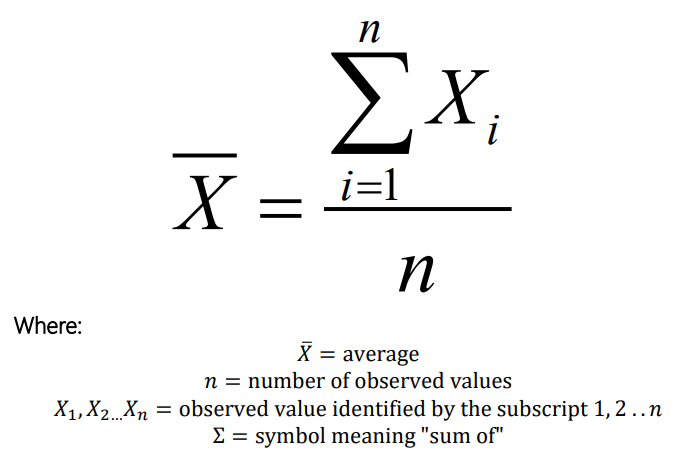
How do you calculate the average of ungrouped data?
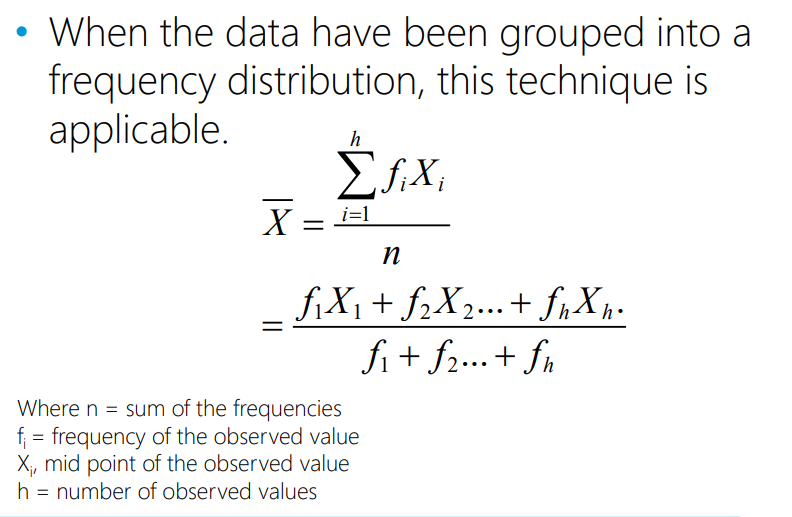
How do you calculate the average of grouped data?
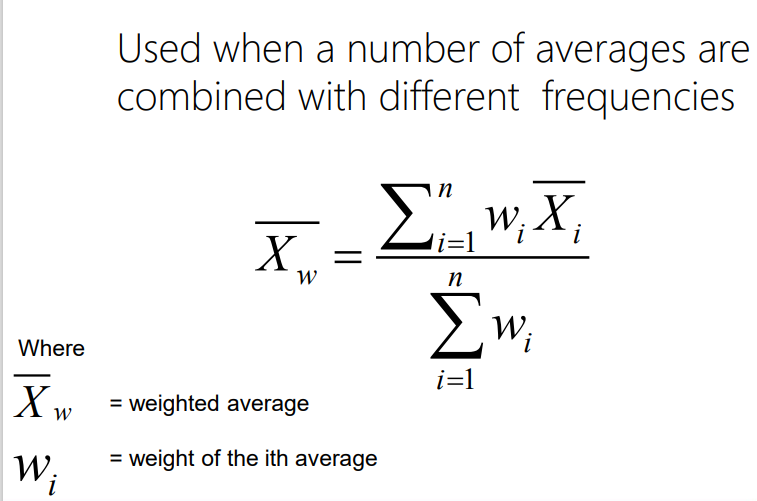
How do you calculate the weighted average of grouped data?
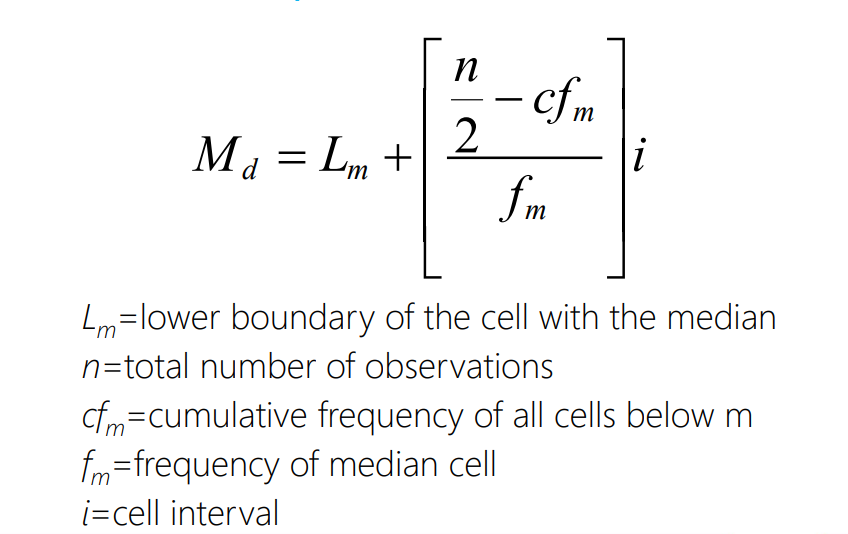
How do you calculate the median of grouped data?
What are the three measures of dispersion?
Range, standard deviation and variance
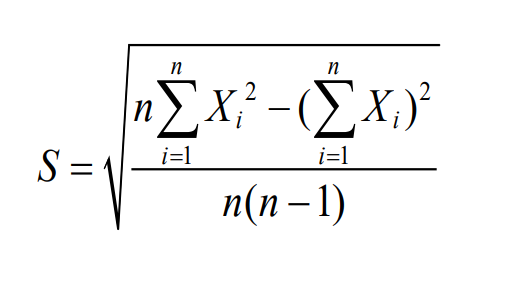
How do you calculate the sample standard deviation for ungrouped data?
This is the ungrouped technique and alternative formulas can be used (however are typically more complex
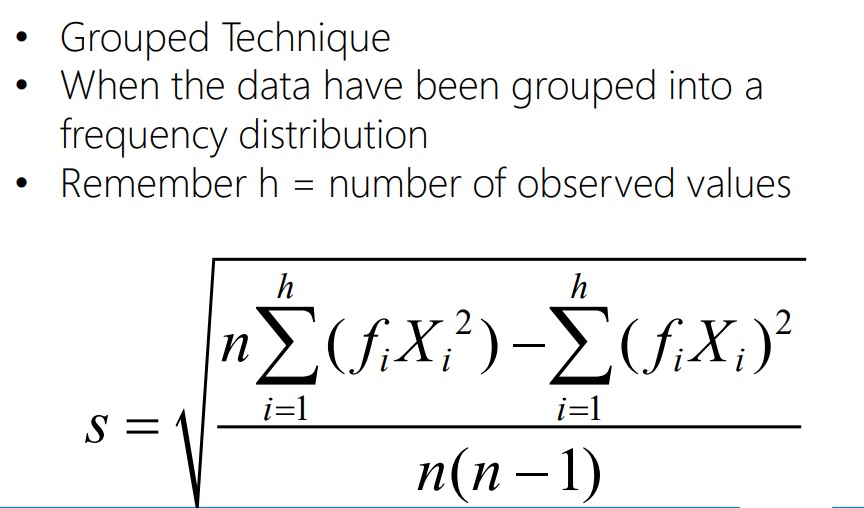
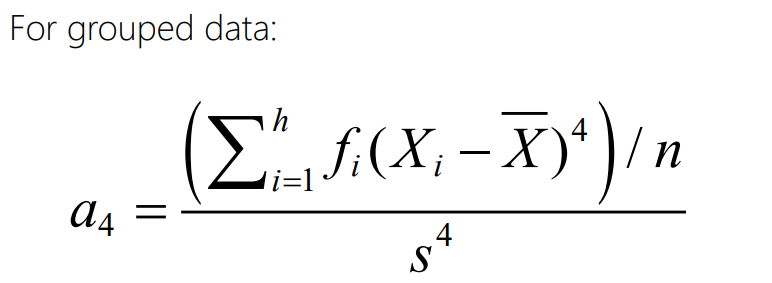
How do you calculate the sample standard deviation for grouped data?
In terms of quality, is a smaller or larger standard deviation better?
The smaller the value of the SD, the better the quality, because the distribution is compacted around the central value
What are the other three measures that are frequently used to analyse a collection of data?
Skewness, Kurtosis and the coefficient of variation
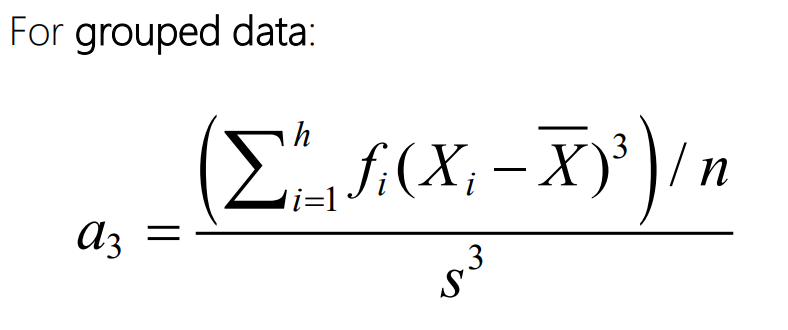
What is Skewness? And how do you calculate it?
Skewness a(3) is the lack of symmetry of the data.
Skewness is a number whose size tells us the extent of departure from symmetry
if the value of a3 is 0, the data are symmetrical
>0 = positive (skewed to the right; i.e. the long tail is on the right hand side)
<0 = negative (skewed to the left; i.e. the long tail is on the left hand side)
Values of +1 or -1 imply a strongly unsymmetrical distribution
What is Kurtosis? And how do you calculate it?
Kurtosis provides information regarding the shape of the population distribution (the ‘peakedness’ or ‘heaviness’ of the tails of a distribution).
What is the coefficient of variation? And how do you calculate it?
Correlation variation (CV) is a measure of how much variation exists in relation to the mean.
Having the standard deviation alone is not particularly useful as it requires a context - the coefficient of variation provides a reference for this.
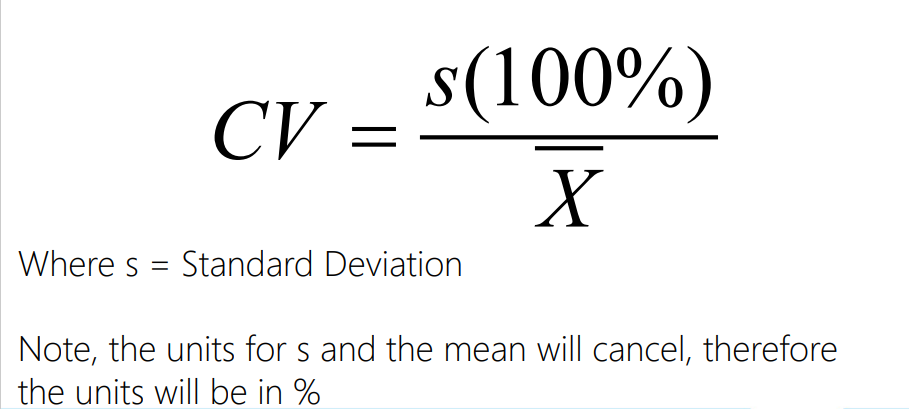
What does it mean to have a small value for the coefficient of variation?
The smaller the value, the smaller is the amount of variation relative to the mean
What is a population/universe?
Set of all items that possess a characteristic of interest
What is a sample?
A subset of a population
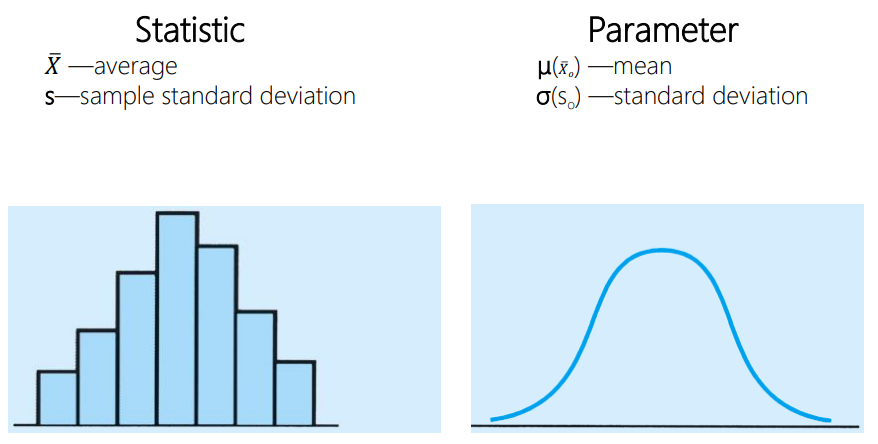
What is the components that make up a statistic vs a comparison
Parameter is a characteristic of a population, i.e. it describes a population
• Example: average weight of the population, 50,000 cans made in a month.
Statistic is a characteristic of a sample, used to make inferences on the population parameters that are typically unknown, called an estimator
• Example: average weight of a sample of 500 cans from that month’s output, an estimate of the average weight of the 50,000 cans
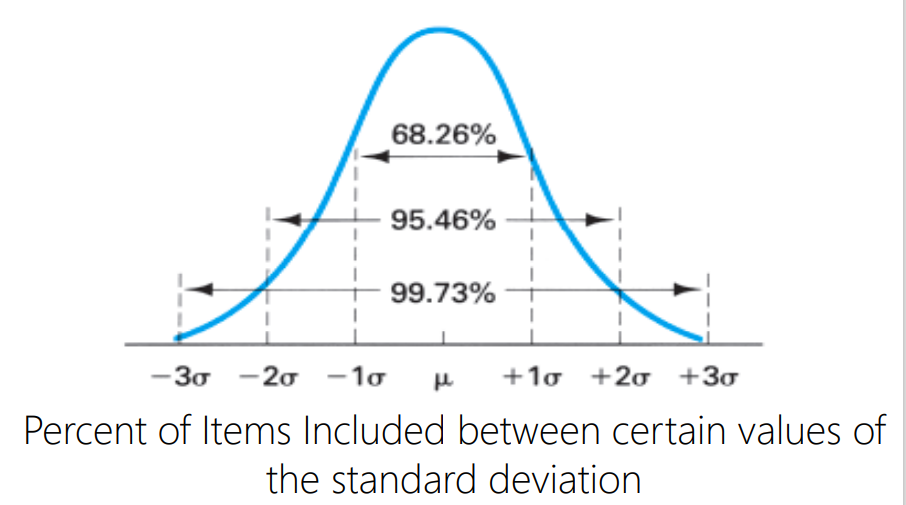
What are the characteristics of a normal curve?
It is symmetrical -- Half the cases are to one side of the centre; the other half is on the other side.
The distribution is single peaked, not bimodal or multi-modal
Also known as the Gaussian distribution
Mean is best measure of central tendency
Most of the cases will fall in the centre portion of the curve and as values of the variable become more extreme they become less frequent, with "outliers" at the "tail" of the distribution few in number. It is one of many frequency distributions.
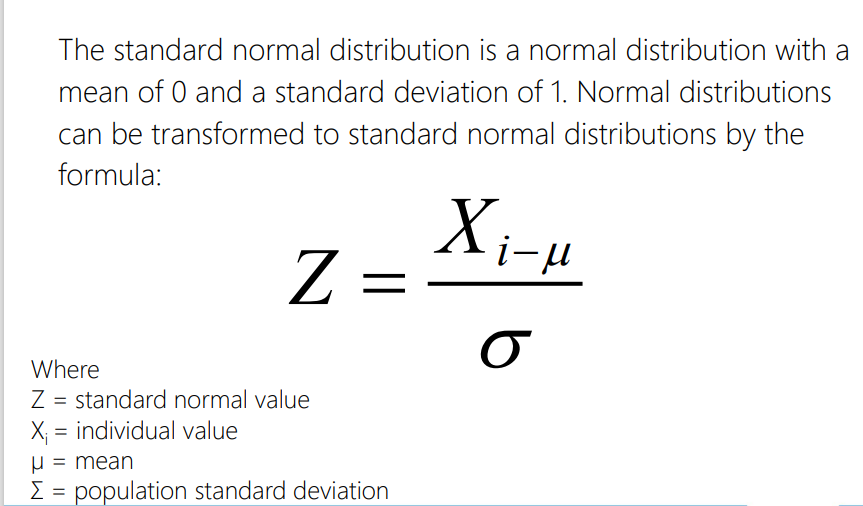
What is the standard normal distribution and how do you calculate it?
What area/percentage is covered by one to 3 standard deviations?
How do you test for normality?
By using Skewness (a3 ) and Kurtosis (a4 )
Skewed to the left or to the right (a3=0 for a normal distribution)
The data are peaked as the normal distribution (a4=3 for a normal distribution)
The larger the sample size, the better the judgment of normality (sample size of 100 is recommended).
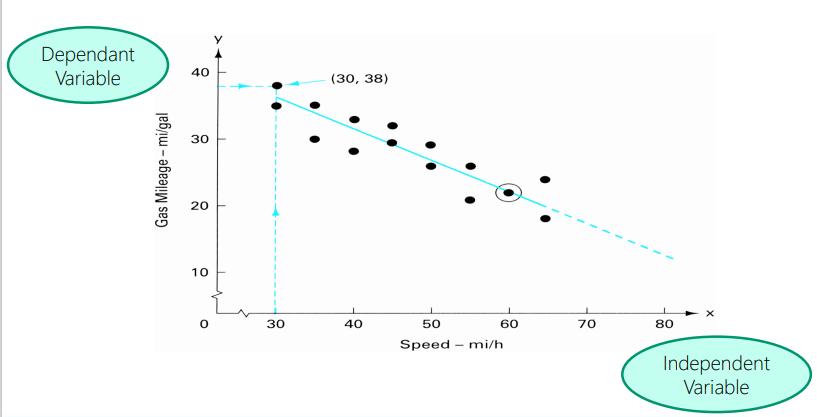
What can a scatter diagram show?
Its a way to determine if a cause and effect relationship exists between to variables.
Supplies the data to confirm a hypothesis that two variables are related
• Provides both a visual and statistical means to test the strength of a relationship
• Provides a good follow-up to cause and effect diagrams
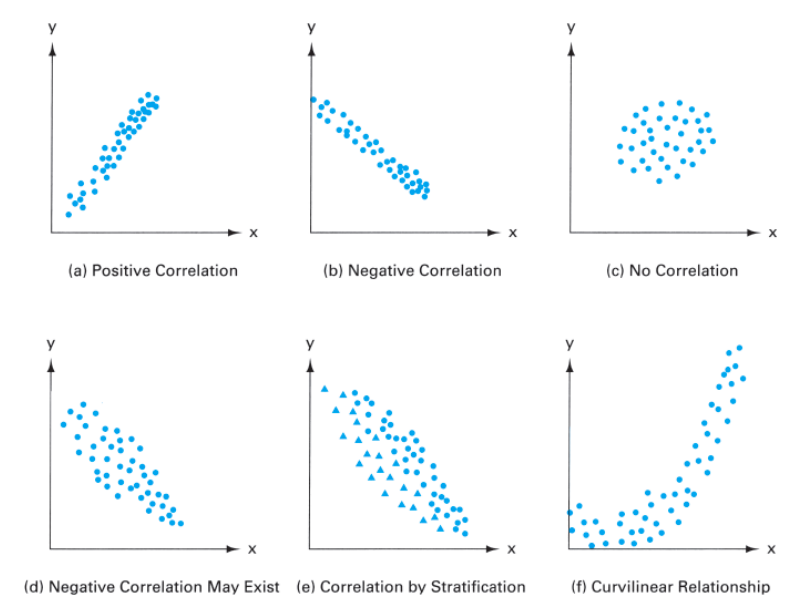
• Scatter diagram pattern
What are the 6 scatter diagram patterns?
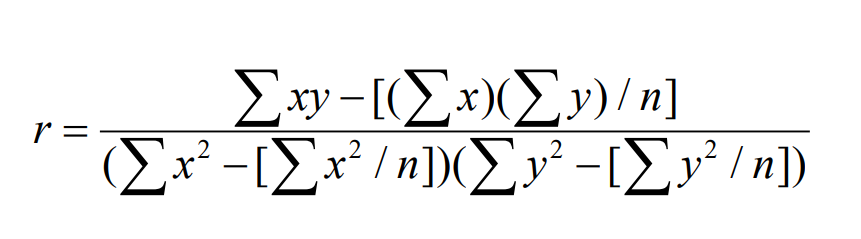
What is the significance of the coefficient of correlation?
A useful statistic - coefficient of correlation (r)
Describes the goodness of fit of the linear model
It is a dimensionless number (r) that lies between +1 and -1
The + and – signs tell whether the there is a negative correlation or a positive correlation
The closer the value is to 1 the better the fit.
If the r value = 1, then all points fall on the line
How do you calculate the coefficient of correlation?