Dynamic Bayesian Networks & Hidden Markov Models
1/24
Earn XP
Description and Tags
basically about how bayesian networks can model sequences or temporal data, how to build HMMs (generate sequences / calculate useful probabilities)
Name | Mastery | Learn | Test | Matching | Spaced | Call with Kai | Chat |
|---|
No analytics yet
Send a link to your students to track their progress
25 Terms
what are dynamic bayesian networks
a probabilistic graphical model that captures systems' temporal dependencies and evolution over time.
nodes represent variables (features) at distinct time slice
there are directed links between nodes within the same time slice (BN) and between time slices (new)
e.g. lag between an observation in one feature and an observation in another
often assumes 1st order Markov Assumption
for a single time slice, the base network captures the conditional dependencies for a given point in time like a normal BN
e.g., 2 time slices, n features, can have auto-regressive links
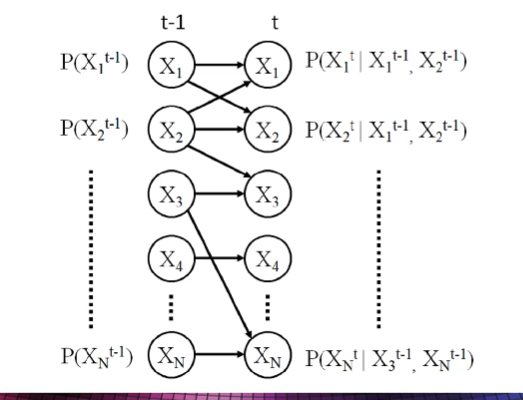
what is an auto-regressive link
a link from the same feature at a previous time slice to the feature at the current time slice
the feature is influenced by its previous self
what are the ‘rules’ of DBN
no cycles
can’t have links going back in time
what is the 1st Order Markov Assumption
links only need to span adjacent time slices in order to make predictions over time
e.g. link between T → T1, not a huge jump which causes complexity like T → T10
links can’t jump over many time slices, only adjacent
what can we use DBN for
can still enter info and see the impact it has on the rest of the notes, even across different time points
EXPLAINING: can come up with an explanation for while a current time point value has a certain value
FORECASTING: make predictions on the future trajectory of the features
what are Markov Chains
one of the simplest state-based models that links a number of possible state transitions over a sequence or time window
models 1 variable as it changes over time
H is a sequence of data being modelled
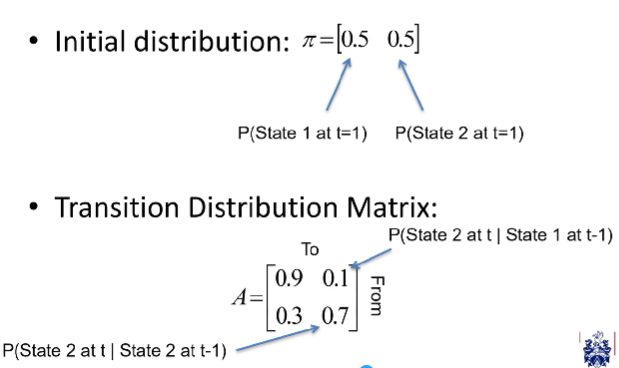
what do Markov Chains require
requires
an initial probability distribution (PD for the states at the initial time slice)
a transition probability distribution matrix (determines state changes over time given previous states)
assumes 1st order markov assumption where only immediate previous state is needed to calculate the next state p(ht|ht-1) which is the conditional probability
where current state determines probability distribution of next stat
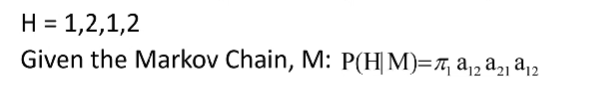
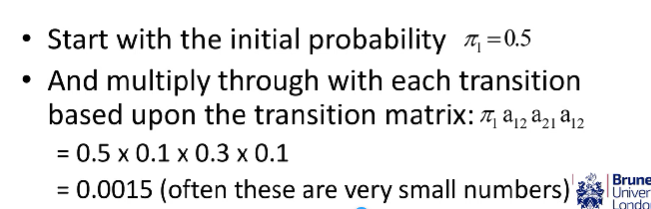
how can we calculate the probability of a sequence H using markov chains
Initial state = {0.5, 0.5}
H = 1, 2, 1, 2
P = 0.5, 0.1, 0.3, 0.1
transitions = initial 1, from 1 to 2, from 2 to 1, from 1 to 2
the first value is always the initial state since there’s nothing to transition from, so use the probability from the initial probability distribution
use the transition probability distribution values starting from the second value in the sequence
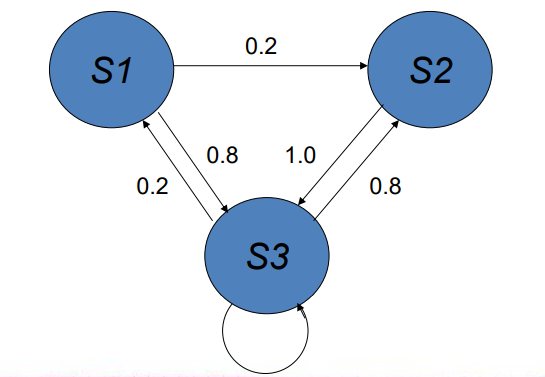
how can we visualise state transition probabilities
create a state transition diagram using the given markov chain and its state transition distribution matrix
e.g. a markov chain with three states
what is a hidden state
underlying variables that generate the observed data, but they are not directly observable
e.g. in the example, the hidden state is which urn we have been given, we don’t know what we’ve been given but we can observe it
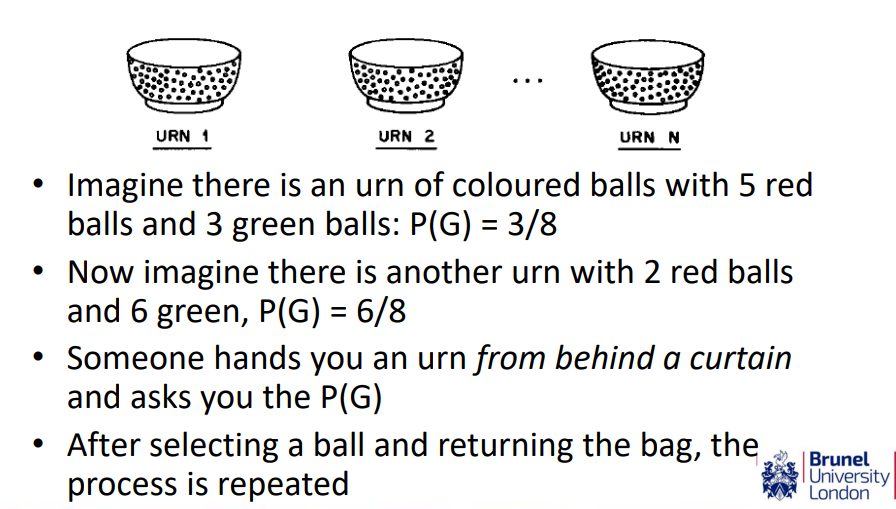
what are observations
the variables that are measured and observed
what is a hidden markov model (HMM)
used to model the probabilistic relationship between a sequence of observations and a sequence of hidden states
generate sequences of observed states based on hidden states
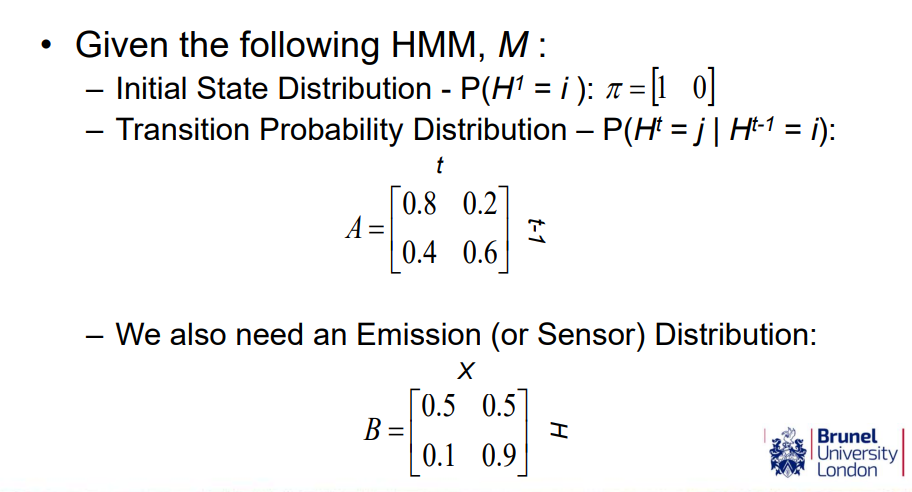
what do HMMs require
initial state distribution
transition distribution - the probability of transitioning from one hidden state to another, using a Markov Chain H that represents the hidden states that the hidden variable transitions between over time
P(Ht |Ht-1 )
emission distribution - the probability of observing an output given (conditioned upon) a hidden state, where observed nodes are X. linked directly to the hidden node in the same time slice
P(Xt |Ht )
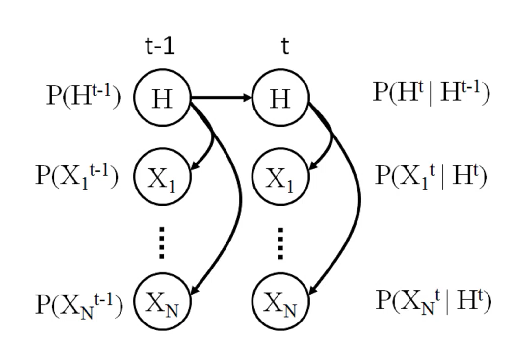
what is the graphical representation of a HMM
the H nodes are hidden, all we see are the observable X nodes, but we know that the X nodes are controlled in some way by the H hidden nodes
this structure is fixed and not learnt from data like BN, just imposed
what are the benefits of the hidden state
can capture more complexities in the probabilities
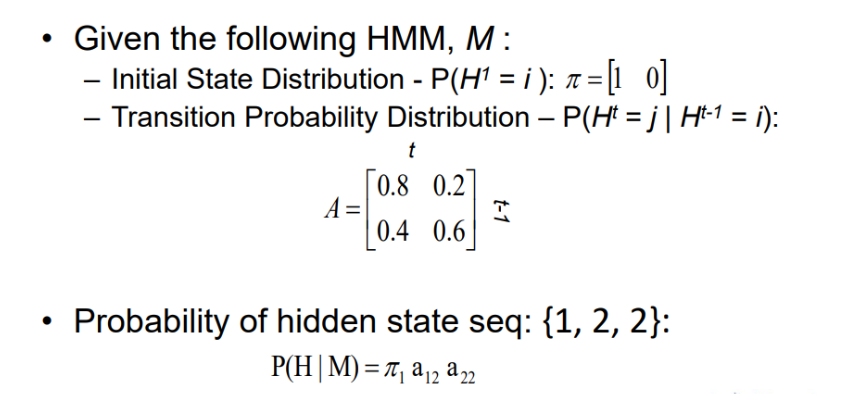
what is the probability of the hidden state sequence {1, 2, 2}
= 1 × 0.2 × 0.6 = 0.12
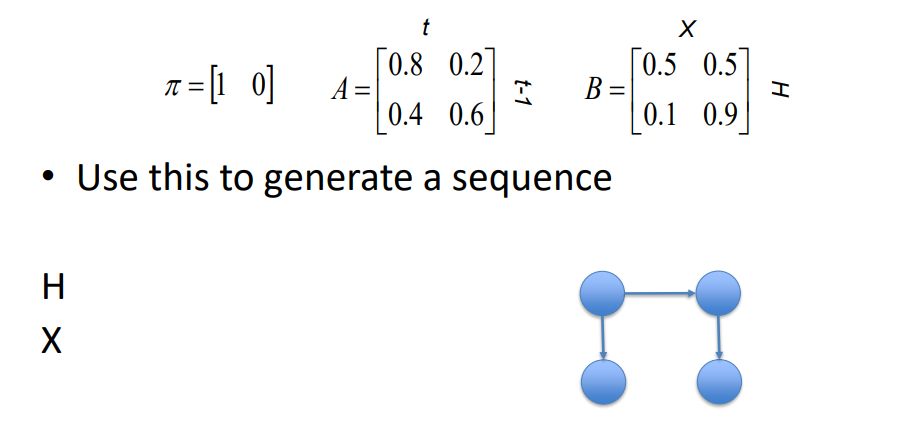
given this HMM set up, how can a sequence be modelled
1st loop:
start with the initial state for H = 1 (since this model it can’t be 2)
then based on H = 1, look at the emission probability for X, (since probably is both 50/50, its randomly chosen as 1
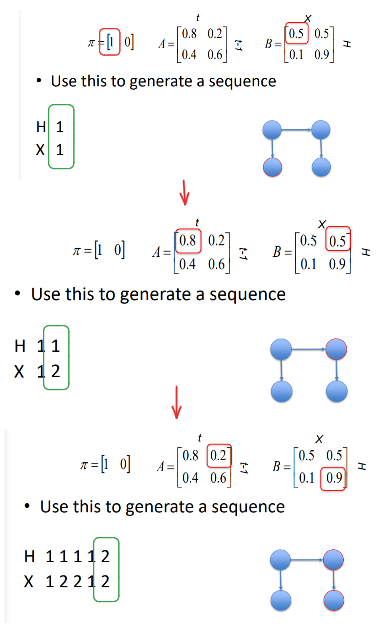
2nd loop
since H is hidden, the value of if it transitions or not is based on its transition distribution, but we don’t change or choose this (imagine hidden state is acting by itself simulated with a random number generator), we just observe the new state H e.g. H is 1 again
based on new state H, look at emission distribution to get the value for X e.g. 50 % change it could be in either state 1 or 2, (this can also be simulated to randomly choose, we are observing, not choosing)
3rd loop
let’s assume H transitions to state 2 (on its own accord)
then looking at the emission distribution, the probabilities for X being 2 are heavily biased to state 1 compared to before. so more likely it will be state 2.
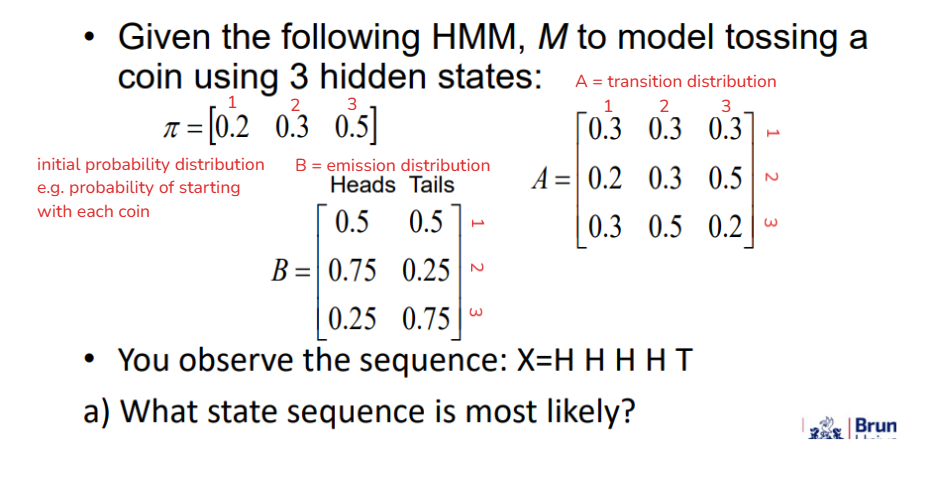
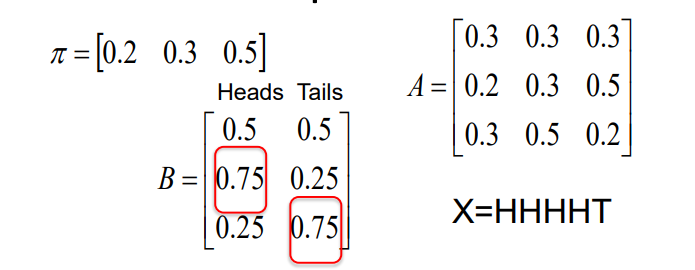
what state sequence is most likely for the hidden state given the observed state
assume that the most likely state sequence always uses the state where the probably of each individual observation is max
Heads - max is 0.75 in state 2
Tails - max is 0.75 in state 3
therefore assume
every H in sequence X comes from state 2
every T in sequence X comes from state 3
final answer
H = 2, 2, 2, 2, 3

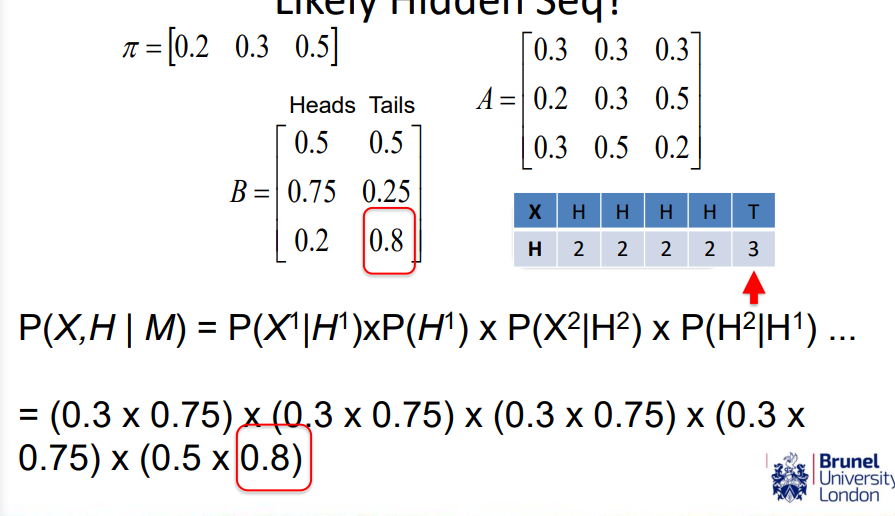
what is the probability of the observation sequence AND the most likely hidden sequence
H = 2, 2, 2, 2, 3
X = H, H, H, H, T
times everything together
1st loop with state 2 and X = H = 0.3 × 0.75
2nd loop with state 2 and X = H = 0.3 × 0.75
3rd loop with state 2 and X = H = 0.3 × 0.75
4th loop with state 2 and X = H = 0.3 × 0.75
5th loop with state change to 3 and X = T = 0.5 × 0.75 (slides are incorrect)
times all 5 values together
what are some typical algorithms for HMMs
Forward algorithm
Viterbi algorithm (most probable explanation)
Expectation Maximisation algorithm
what is the forward algorithm
Given an observed sequence, X and a known model (HMM), M, how do we compute the probability of seeing that sequence from the model?: p(X | M)
helps us learn and parameterise the model
basically, what’s the most likely model that fits the data
what is the Viterbi algorithm
Used for Most Probable Explanation
Given the observed sequence and the model, how do we choose an optimal hidden state sequence?
how can we predict what the underlying hidden state sequence is given some observations
what is the Learning using the Expectation Maximisation algorithm
How do we adjust the model parameters to maximise the probability of the observed sequence given the model?
how can we learn what the hidden parameters are
used to do clustering where H is the hidden class variable which becomes the cluster variable
what are the applications of HMMs (and thus DBN)
aligning sequences of nucleotides (genetic medicine)
Finding where sequences are the same
text modelling, sequence of words
speech recognition
monitoring and tracking behaviours, e.g. modelling an elderly person in a house, classifying whether someone is sitting down or cooking based on the dynamics of an accelerometer to detect between normal and abnormal behaviour
recognition of mouse gestures like swiping tapping recognition
what’s the difference between HMM and DBN
HMM are a specific type of DBN
HMM are temporal models for time-series data where a single hidden state changes through time, influencing the observations
DBN capture how dependencies among a wide range of relationships between variables change through time