Calculating Reaction Rates
 View linked note
 Call Kai
 Learn
Learn Practice Test
 Spaced Repetition
 Match
Match Flashcards
 Knowt Play
1/21

There's no tags or description
Looks like no tags are added yet.
Name | Mastery | Learn | Test | Matching | Spaced | Call with Kai | Chat |
|---|
No analytics yet
Send a link to your students to track their progress
22 Terms
Define Reaction Rates.
change in concentration of reactant/product over a certain unit of time
Define Species
any distinct type of atom, molecule, ion, or compound that participates in chemical processes
What are Overall Reaction Rates?
the rate of a particular species (particles) divided by its stoichiometric coeffient (moles)
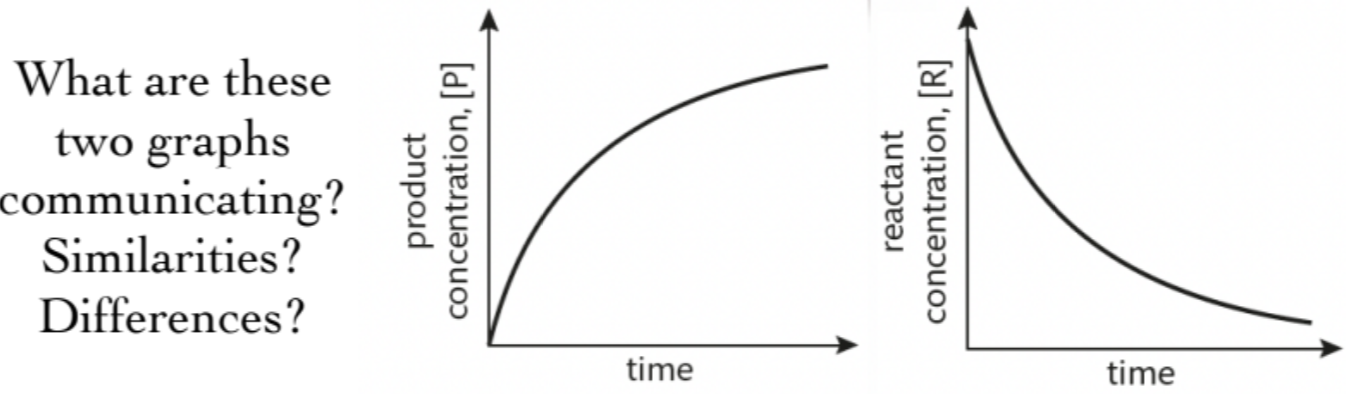
the left graph communicates that as the reaction occurs, the number of product molecules increases
the right graph communicates that as the reaction occurs, the number of reactant molecules decreases
They are opposites of each other
What is the equation for Average Reaction Rate?
rateA = [A] at time t2 - [A] at time t1 / t2 - t1
![<p>rate<sub>A</sub> = [A] at time t<sub>2</sub> - [A] at time t<sub>1 </sub>/ t<sub>2</sub> - t<sub>1</sub> </p>](https://knowt-user-attachments.s3.amazonaws.com/eed7643d-20eb-4569-826c-ad6a840ea5e8.png)
In a reaction, what happens to the concentration of the reactants? What equation can we create from this fact?
creactants gradually decrease
rater = -∆[R] / ∆t
![<h4 collapsed="false" seolevelmigrated="true">c<sub>reactants</sub> gradually decrease </h4><p>rate<sub>r</sub> = -∆[R] / ∆t</p>](https://knowt-user-attachments.s3.amazonaws.com/e9fe6032-968c-4c45-b73d-dde8a27e5dd1.png)
In a reaction, what happens to the concentration of the products? What equation can we create from this fact?
cproducts gradually increase
rateP = ∆[P] / ∆t
What is important to note about reaction rates?
they cannot be negative so you must use absolute value
What does [x] represent?
concentration in mol dm-3
What is the unit for rate?
mol dm-3 s-1
What is the Instantaneous Reaction Rate? How do you find it on a graph?
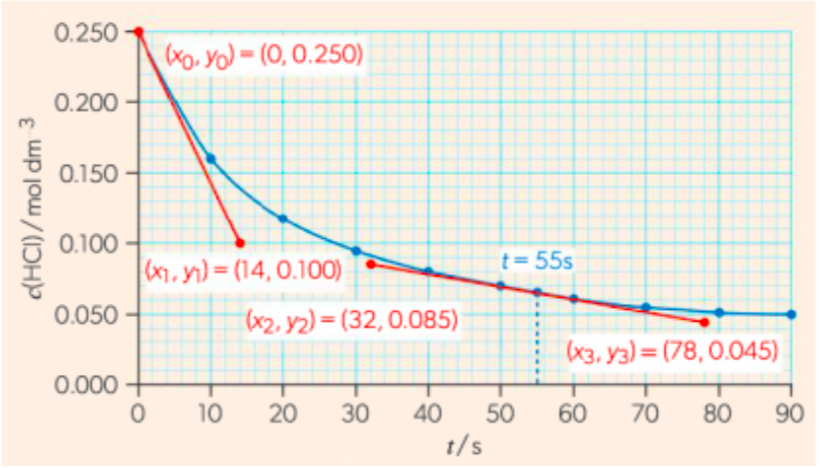
reaction rate at a certain moment
1. From a concentration vs. time graph, if you draw a TANGENT to the curve at desired time, t, the slope of the line = the reaction rate at that time
once you get the tangent, take the mol dm at t=0 and divide it by the t when mol dm = 0
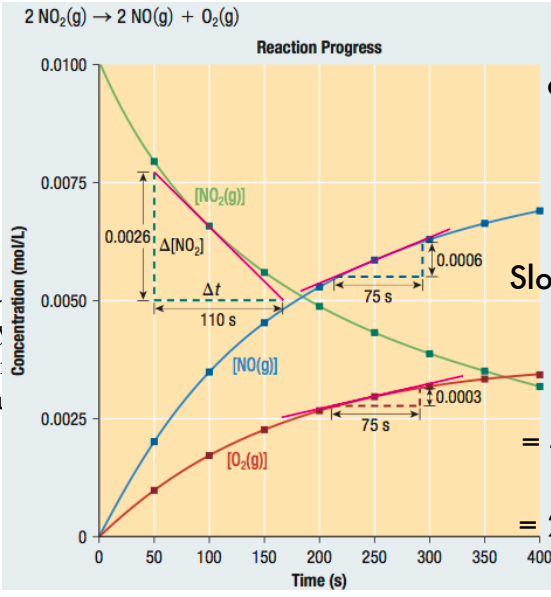
What’s the average rate of NO2
How do chemists track the progress of a reaction?
by appearance of a product/ disappearance of a reactant
What signal of progression you track depends on…
the reaction itself
What are the methods used to track change in a reaction?
change in gas volume
change in mass
change in light transmission
change in concentration via titration
change in concentration by conductivity
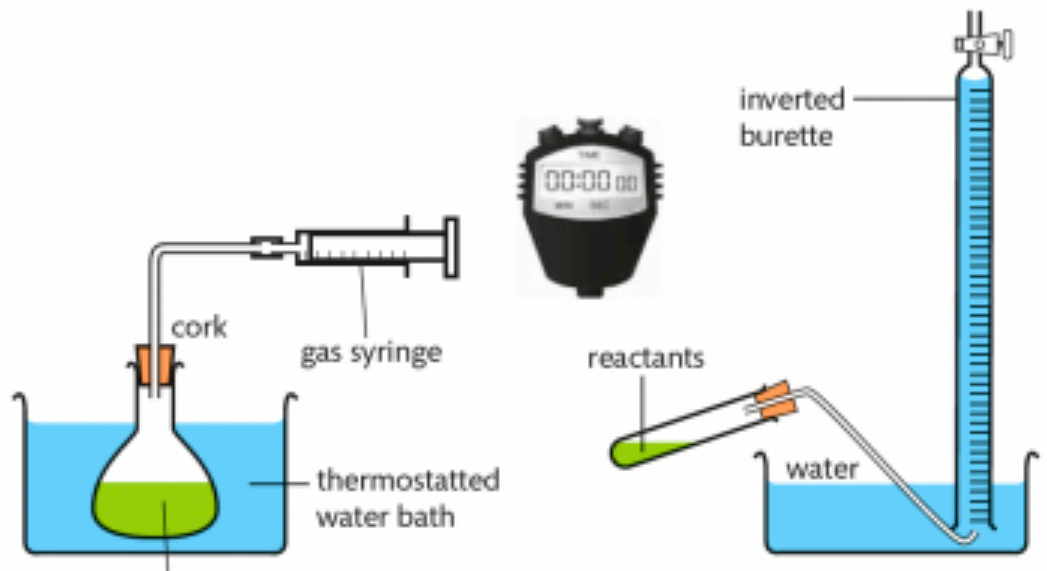
Tell me about Reaction Progress measured through Change in Gas Volume
useful if gas is a product
uses gas syringe or inverted burette for water displacement
collect gas at regular intervals and plot a volume vs. time graph
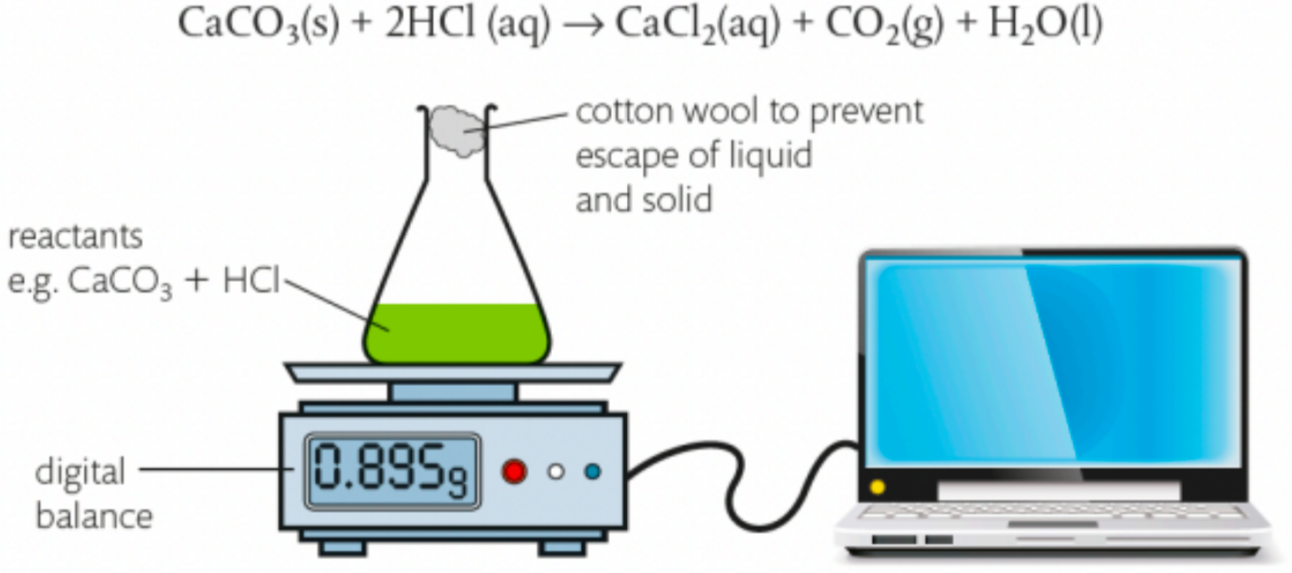
Tell me about Reaction Progress measured through Change in Mass
applicable for most reactions
changes in mass could be continuous if reaction occurs on a scale
if reaction gives off gas, decrease in mass is measured
Tell me about Reaction Progress measured through Change in Light Transmission
useful is substance is coloured
continuous method that uses absorbance vs. time graph
uses colorimeter/spectrometer to shine light through substance and absorb light
less light detected = more light absorbed
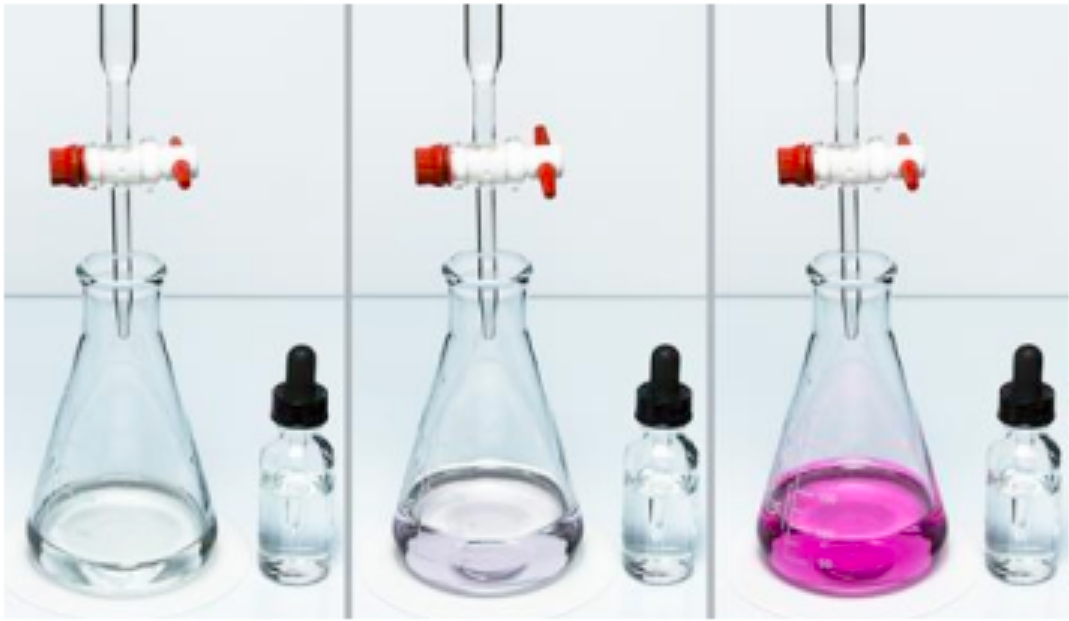
Tell me about Reaction Progress measured through Change in Concentration using Titration
titration - mixing your sample solution with a known standard which results in a chemical reaction making new products
therefore, samples must be drawn intermittently to get concentration
quenching is used to stop reaction at point of withdrawal
quenching is when you freeze the flask in cold water which slows particles
What does Electrical Conductivity depend on?
concentration of ions and their charges
Tell me about Reaction Progress measured through Change in Conductivity
if electrical conductivity changes during a reaction, you can track this change using a calibrated conductivity meter containing inert electrodes into the solution