EPI/BIO: EXAM #1 (ALL)
1/122
Earn XP
Name | Mastery | Learn | Test | Matching | Spaced | Call with Kai |
|---|
No analytics yet
Send a link to your students to track their progress
123 Terms
if a study of acupuncture for osteoarthritis showed that pain decreased in most patients does this mean that the acupuncture worked?
not necessarily; we tend to ignore alternative explanations
-placebo effect
-patients want to be polite
-other changes in tx (ASA, exercise)
-subject with worsening pain may be excluded for variety of reasons
-pain from osteoarthritis varies day to day
definition of significant
unlikely to happen just by chance
probability
desire for statistical calculations to yield definite conclusions
-all statistics can do is report probabilities
-fraction of times you expect to see that event in many trials (ranges 0-1)
quality control
using results from a sample and referring it back to entire group
ex: factory makes a lot of items (population) but randomly selects a few items to test (sample)
results obtained from sample are used to make inferences about entire population; sample is expected to be representative of entire population
political polls
random sample of voters (sample) is polled
-results used to make conclusions about entire population of voters
clinical studies
patients are representative of other similar patients
-though the population may be defined vaguely, still use the data to make conclusions about a larger group
probability vs statistics
-probability starts with the general case (population or model) and then predicts what would happen in many samples
-statistics works in opposite direction; start with one set of data (sample) and make inferences about the overall population or model
independent variable
-experimental or predictor variable
-can be manipulated in an experiment
-changed to have an effect on a dependent variable
in study looking at efficacy of new analgesic at different doses the IV would be the doses of the medications
dependent variable
outcome variable
-based off of whatever the independent variable is
-what is measured during a study
in study looking at efficacy of new analgesics at different doses the DV would be the change in pain scale
Nominal and binomial variables
nominal variable: categorical outcomes with more than two possible outcomes
-no consideration of order or magnitude
-usually not numeric
binomial variable (dichotomous variable): more specific nominal variable; categorical outcomes with only two distinct possible outcomes
if someone is looking at blood typing this is a _____ varible
nominal!
there is no order or magnitude and there are more than two possible outcomes (type AB, type A, type B, etc)
"nom think name" just labeling what you are measuring; if you assign a number it is not meaningful; telling you a category or type
eye color is another example
if someone is looking at how many males vs females are in a class this would be considered a study using a ______ variable
binomial (dichotomous) variable because there are only two possible outcomes and order and magnitude do not matter; you are either male or female
-this is just a specific category of nominal variables
-another example would be yes/no answers
if you are running a study that is looking at restaurant ratings on yelp (1-5 stars) with 1 being unsatisfied and 5 being very satisfied what kind of variable is this?
ordinal variable because you are expressing rank and the order matters
-names and orders what you are measuring
-intervals between these values may not be equal because you can't tell how far a part the data is; it's hard to define the exact difference between "satisfied" vs "very satisfied"
-other examples include pain scales, level of education, ranking football teams
variables that represent data capable of possessing any value in a given range like BP, temperature, weight
continuous variables
-these are broken down further into interval and ratio variables
interval vs ratio variables
both are continuous variables
interval variables
-spaced with equal intervals or distances; distances between each variable has meaning but 0 does NOT have a meaning
-you give a name and order to your data and know how far apart things are from each other
-calculating the ratio of two variables is not helpful
ratio variables
-"think o in ratio as 0" because it has a meaningful 0
-ordered groups with equal intervals and 0 point is meaningful
-money in your bank account: 0 dollars means something
-names something, gives it an order, equal intervals, and absolute 0 on ratio scale
looking at the body temperature of difference species in celsius is what kind of variable?
interval variables
-a difference means the same thing all the way along the scale no matter where you start but 0* celsius doesn't mean anything
-can calculate the difference between these variables (90C-80C) but a ratio is not helpful (100C is not twice as hot as 50C)
when measuring body weight of individuals in a weight loss program this is a ____ variable
ratio!
-0 is meaningful in that you can not have 0 body weight or negative body weight
-equal intervals still
other examples include: temperature in Kelvin, mass, distance, blood sugar
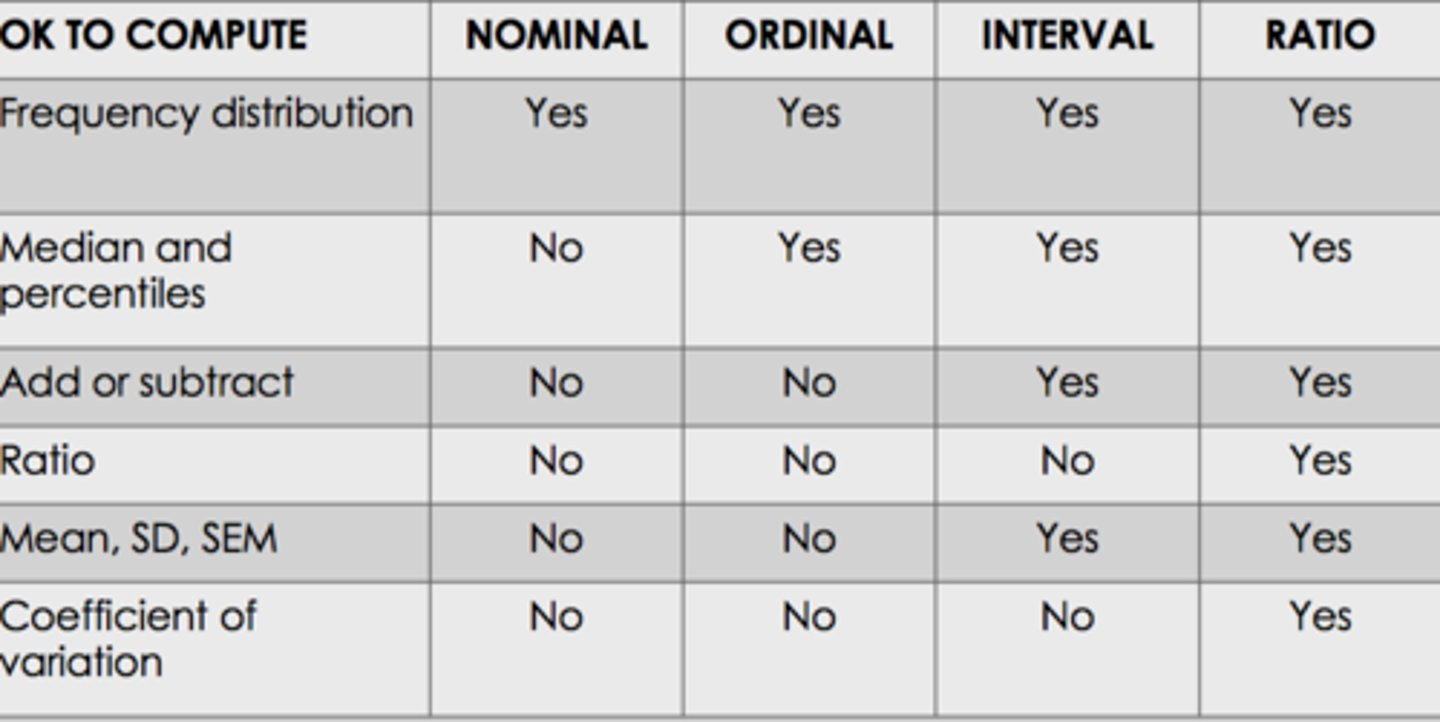
can you compute a coefficient of variation with interval variables?
no you can only compute a coeffcient of variation with ratio variables
-you can get SD, SEM, add, subtract, median/percentiles, and frequency of distribution with interval variables
what is the advantage of using the median over mean in some cases?
means can be sensitive to outliers whereas medians are not influenced by outliers
how can you remove the influence of outliers from the mean?
by using a trimmed mean
-ignores the highest and lowest values
when can using the mode be useful?
only variables that can be expressed as integers or whole numbers
-does not always assess the center of a distribution
error and bias
error: refers to variability
bias: caused by any factor that consistently alters the results not just preconceived notions of the experiementer
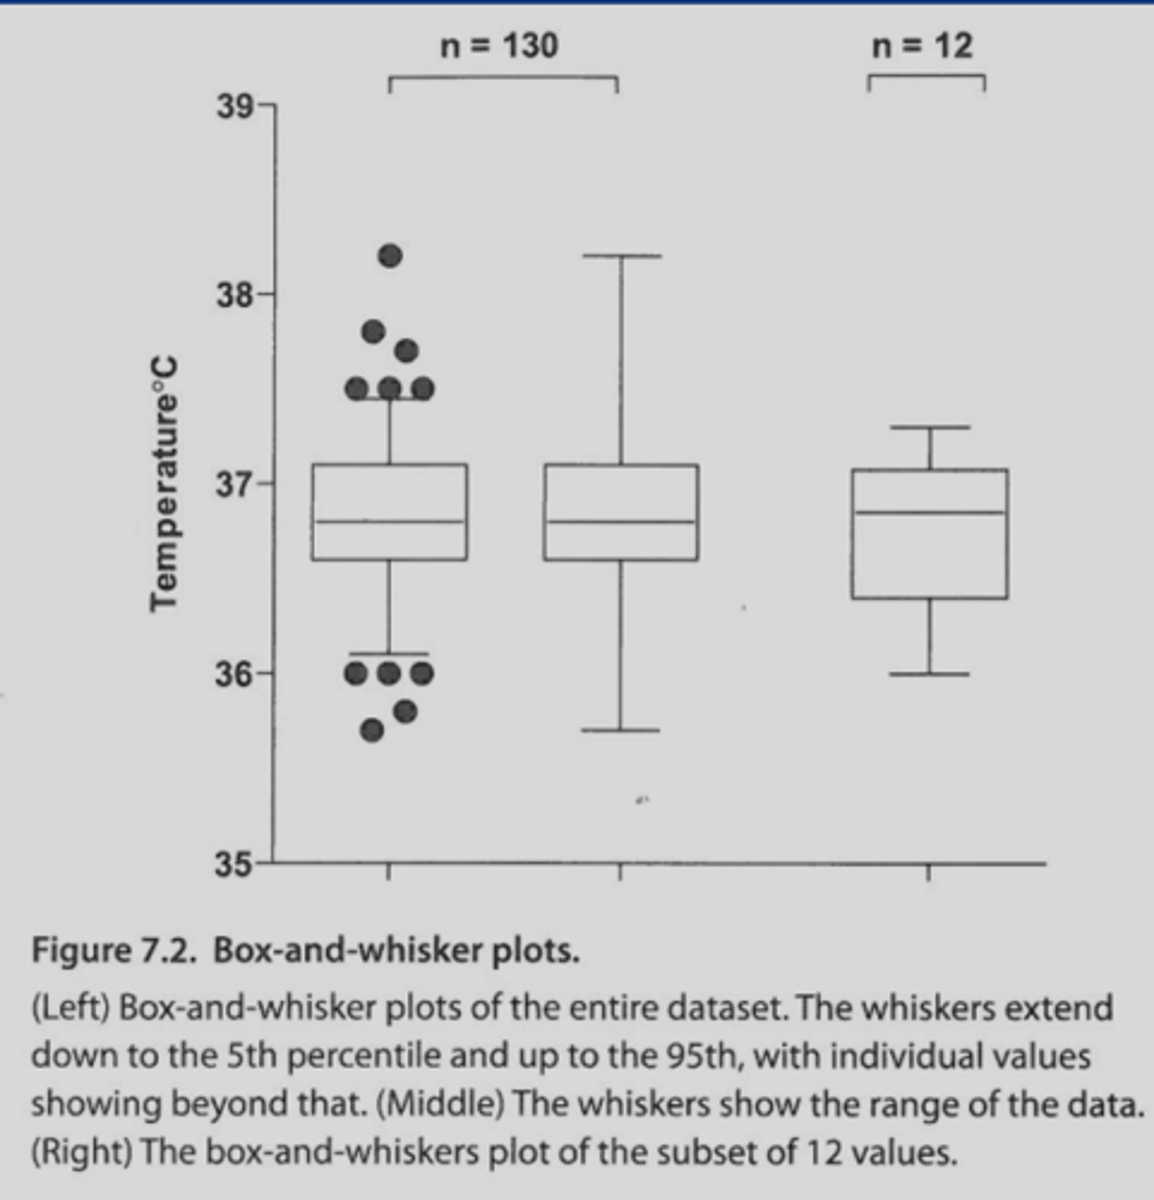
graph that uses horizontal lines to mark the median of each group and represents quartiles
box-and-whisker plot (larger the box, the more variable)
-middle line of box= 50th percentile (median of entire set)
-bottom line of box=1st quartile (median of lower half of the set; 25th percentile)
-top line of the box= 3rd quartile (median of upper half of the set; 75th percentile)
if 25th and 75th percentiles are very close to your mean tells you there's less variation
**can extend lines out to represent 5th and 95th percentiles or plot highest and lowest values
standard deviation
-variation among values expressed in the same units as the data; a measure of the spread or width of distribution
-quantifies scatter; how much the values vary from one another
-used to measure the spread of data about the mean
-larger the SD, the more spread out the distribution of data about the mean
small SD means more people are ____ to the average
closer!
this means there is less variation from the mean
1. 1 SD out from the mean ____ individuals should fall within these values
2. 2 SD out from the mean ____ individuals should fall within these values
3. 3 SD out from the mean ____ individuals should fall within these values
1. 68% of data points should be 1 SD above or below the mean
2. 95% of data points should be 2 SD above or below the mean
3. 99% of the data points should be 3 SD above or below the mean
if you measured the average weight within a certain community and found that the mean weight was 50 kg with a SD of 7kg, 95% of the population should weigh how much?
-36 to 64 kg
(2 SD above and below the mean)
gaussian distribution is called a normal distribution in the statistical sense but does this also refer to normal in the clinical sense?
no! it would not make sense to define clinically normal limits symmetrically around the mean (temperature, lab values, etc)
what is used to identify how close our sample is approximated to the sample at large? (how close you are to the population average)
standard error of the mean (SEM)
-the larger the sample size, the smaller SEM; less error the closer you are to the actual population size
SD vs SEM (know)
-SD is a measure of the spread of data
-SEM is measuring how well you know the true population mean; depends on the sample size (N) and SD
a small SEM suggests that the sample mean is _____ to the population mean
close!
what can be used to construct confidence intervals around the sample mean?
SEM (looking at how close your sample mean is to the mean of the entire population)
by definition the CI is always centered around the ____
sample mean
-this is saying how confident you are that the values you come up with are similar the true population values
the width of the CI is proportional to the sample SD meaning that
if you have a larger SD (more variability) then your CI gets wider
what defines how confident you are that the true population mean falls within a given range of values
confidence interval
to interpret the CI of a mean what assumptions must be accepted?
-that it is a random/representative sample (no convenience sampling)
-independent observations were made (all subjects sampled from the same population and selected independently of the others)
-accurate data
-assessing an event you really care about
-population is distributed in gaussian manner
1. can mean or median be negative or equal 0
2. can SD be negative or equal 0
1. yes
2. SD can not be negative; it can be 0 if all the values are the same
when are the mean and median very similar in value?
when data is normally distributed (gaussian)
does CI of a mean quantify variability?
no
-CI are not the spread of values like SD
-depends on the spread of values AND sample size
-if CI is 95%: this means 95% of the time you expect the population mean to be within the CI
will a 99% or 90% CI have a wider range? (know)
-99% CI will have a wider range; if you are that confident you need to give yourself more wiggle room
-if your CI is 90% you can have a narrower range since you are giving yourself room to be wrong
if you increase your sample size would SD get smaller or larger or stay the same?
SD is not affected by sample size
-it only quantifies scatter of the data
**SEM would get smaller with a larger sample size
1. the larger the sample size, the _____ the CI
2. the larger the SD, the ____ the CI
3. the higher the degree of confidence, the ____ the CI
1. smaller (more narrow)
-can be more certain of the mean since sample would be closer to actual population; if sample size increases by factor of 4, CI is expected to narrow by factor of 2 (inversely proportional to the sq root of the sample size)
2. larger
-with more variation, the mean is less certain
3. larger (wider)
-the CI has to be larger if you want to be 99% certain that the true mean lies within it
when polling 100 voters before an election, you gather that 33 people would vote for your candidate. If the 95% CI extends from 0.24-0.42 what does this mean?
we are 95% sure that if we extrapolated this out to the entire population, we would be getting somewhere between 24% to 42% of the vote
preferred method for creating a survival table and how is it done (know)
kaplan-meier method
-calculate the fraction of patients who survived on a particular day and divide the number alive at the end of the day by the number alive at the beginning of the day; accounts for censored patients
-time zero: day that patient entered the study
if you have 300 subjects in your study and at 1 year out you have 200 subjects, at 2 years you have 180 subjects, at 3 years out you have 150 subjects and at 4 years out you have 130 subjects. What is the median survival?
3 years since this how long it takes until half of the subjects have died
what is usually quantified with a 5-year survival?
cancer
-matter of tradition; somewhat arbitrary
why is it better to use the median survival time rather than the mean/average survival time?
the mean survival time can only be computed when there are no censored observations and the study continues long enough for all subjects to have died/ or for all of the events to have occurred
-takes much longer compared to the median survival rate; where only 50% of the events have to occur
censoring survival data
people are taken out of calculations for certain reasons and not included in the final results (they move, they stop following up, they survive past the study period, etc)
-important to talk about this in your study because if you started with 80 people but only did calculations on 65 this would look suspicious
-if you censor certain subjects it is important to note how long they were actually in the study for
the null hypothesis always states
there is no difference between the things that you are comparing
-observed differences are simply a result of random variation in the data; just due to chance alone
-researchers are often trying to prove the null hypothesis false and say that there is in fact a significant difference
if you get a p value of 0.02 (with your significance level being 0.05) this means
if the null hypothesis were true (there is no difference between groups), the probability of getting your result by just chance alone is about 2%--> it is likely not due to just chance alone so you can reject the null hypothesis in this case
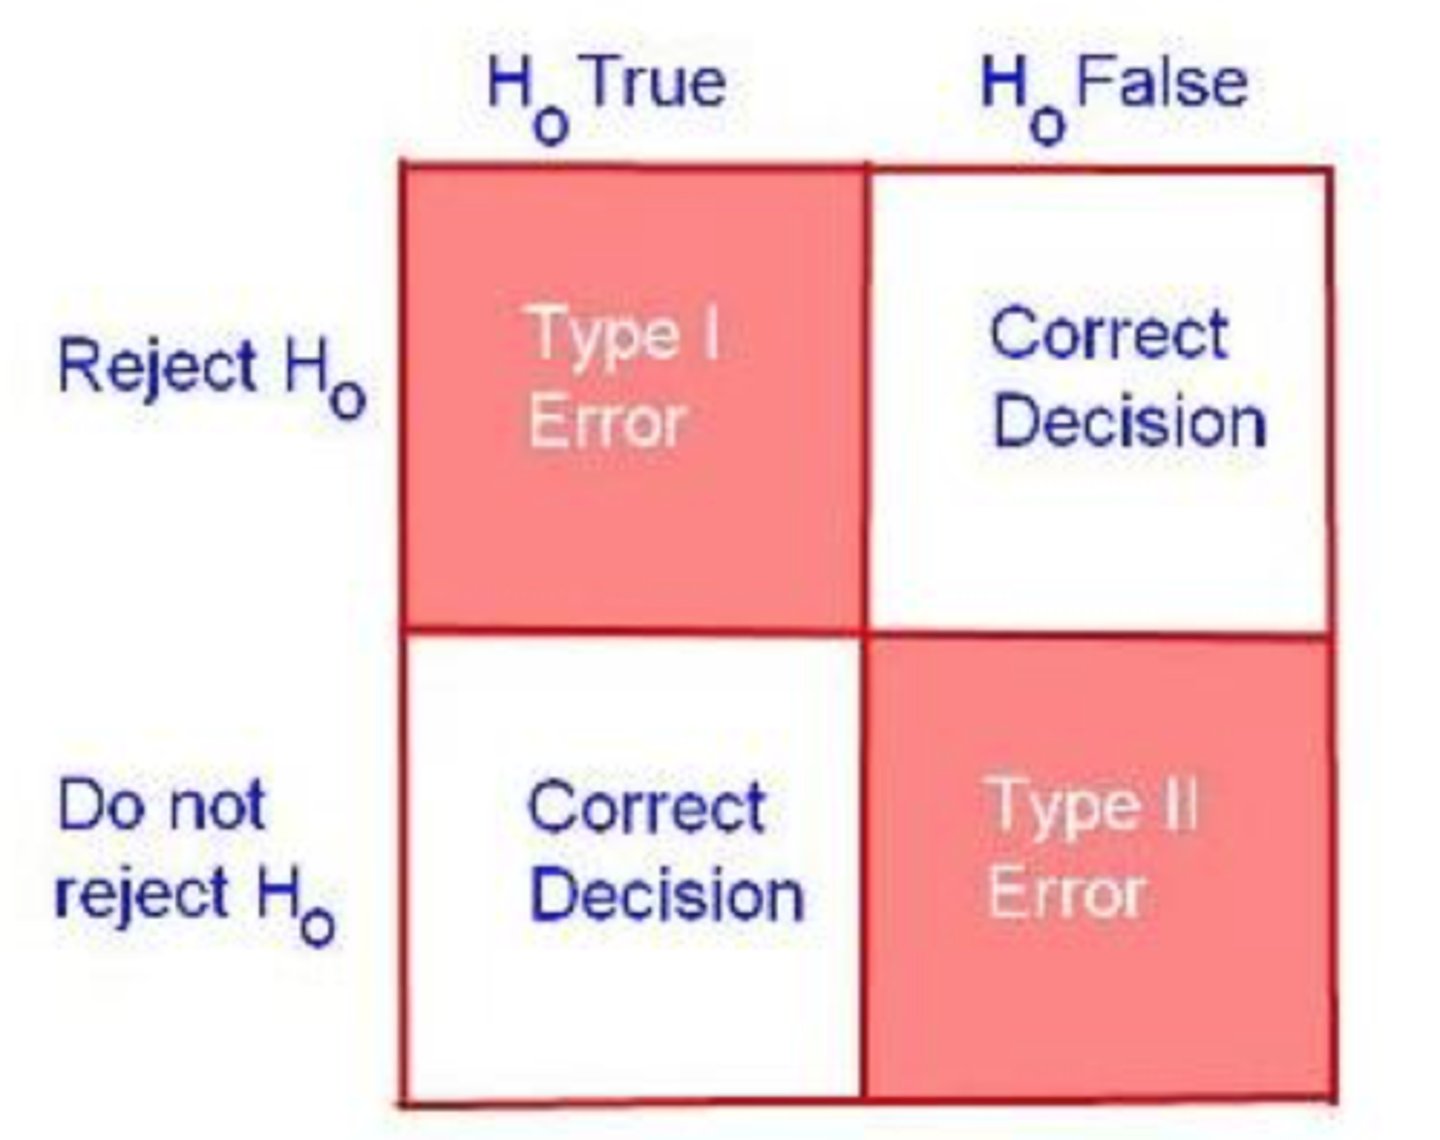
type I error vs type II error
type I error: incorrect rejection of the null hypothesis (saying there is a difference between the groups when there actually is not)--> false positive
type II error: incorrectly retaining a false null hypothesis (saying there is no difference between the groups when there actually is a difference there)--> false negative
pitfalls of the p value
-does not convey information regarding the size of the effect (small effect in study w/ large sample size can have the same p value as a large effect in a small study)
-the more variable or endpoints in a study, the more likely one of them will come up statistically significant by chance alone (mult comparisons error)
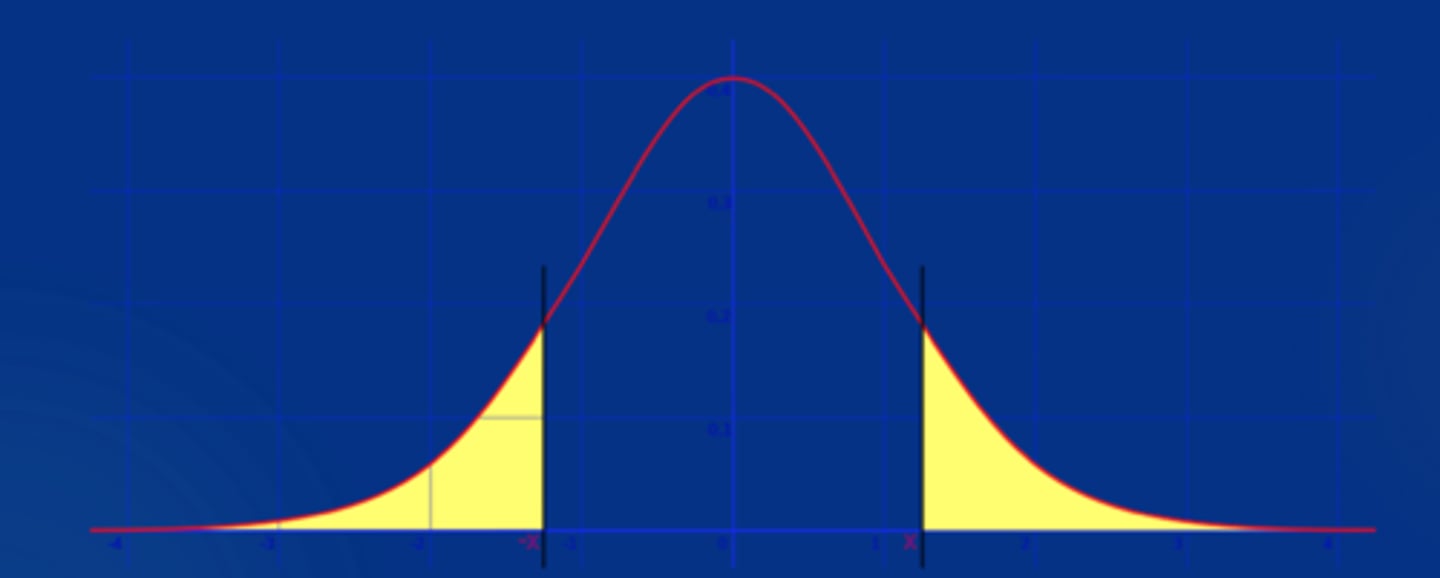
two tailed vs one tailed test
-two tailed test includes both sides of the gaussian curve; better to use this if you are not sure which way the values are going to go (either group can have the larger mean)
-one tailed test only includes one side of the gaussian curve; when using a one tailed test you usually have an idea of which values will be higher and which values will be lower; you must predict which group with have the larger mean before collecting any data
you perform a hypertension study on two groups and randomly give one group the antihypertensive medication and the other a placebo. Can you use a one-tail p value for this?
yes
-you have an idea which values will be higher and lower meaning you can assume that the group getting the antihypertensive medication will have a lower mean blood pressure compared to the placebo group
1. with what test are you more likely to make a type 1 error?
2. with what test are you more likely to make a type 2 error?
1. one-tailed p value test (you would end up rejecting the null hypothesis when there is actually no difference between groups)
2. two-tailed p value test (you would end up retaining a false null hypothesis and saying there is no difference when there actually is)
it is usually better to make a type II error than it is a type I
when is it appropriate to use a one-sided p value?
when previous data, physical limitations, or common sense tells you that the difference, if any, can only go in one direction
only choose this test if
-you predicted which group will have the larger mean before collecting any data
-if the other group ends up having a larger mean you would have attributed that difference to chance and called the difference "not statistically significant"
What happens if you set the p value (alpha) lower than 0.05?
-you will be less likely to make a type I error and say that there is a difference when there actually is not
HOWEVER
-you will be more likely to make more type II errors and say that there is no difference when there actually is
if you want to set a very low p value you need to have great effect value meaning the difference between the groups is so large that it will be easy to find
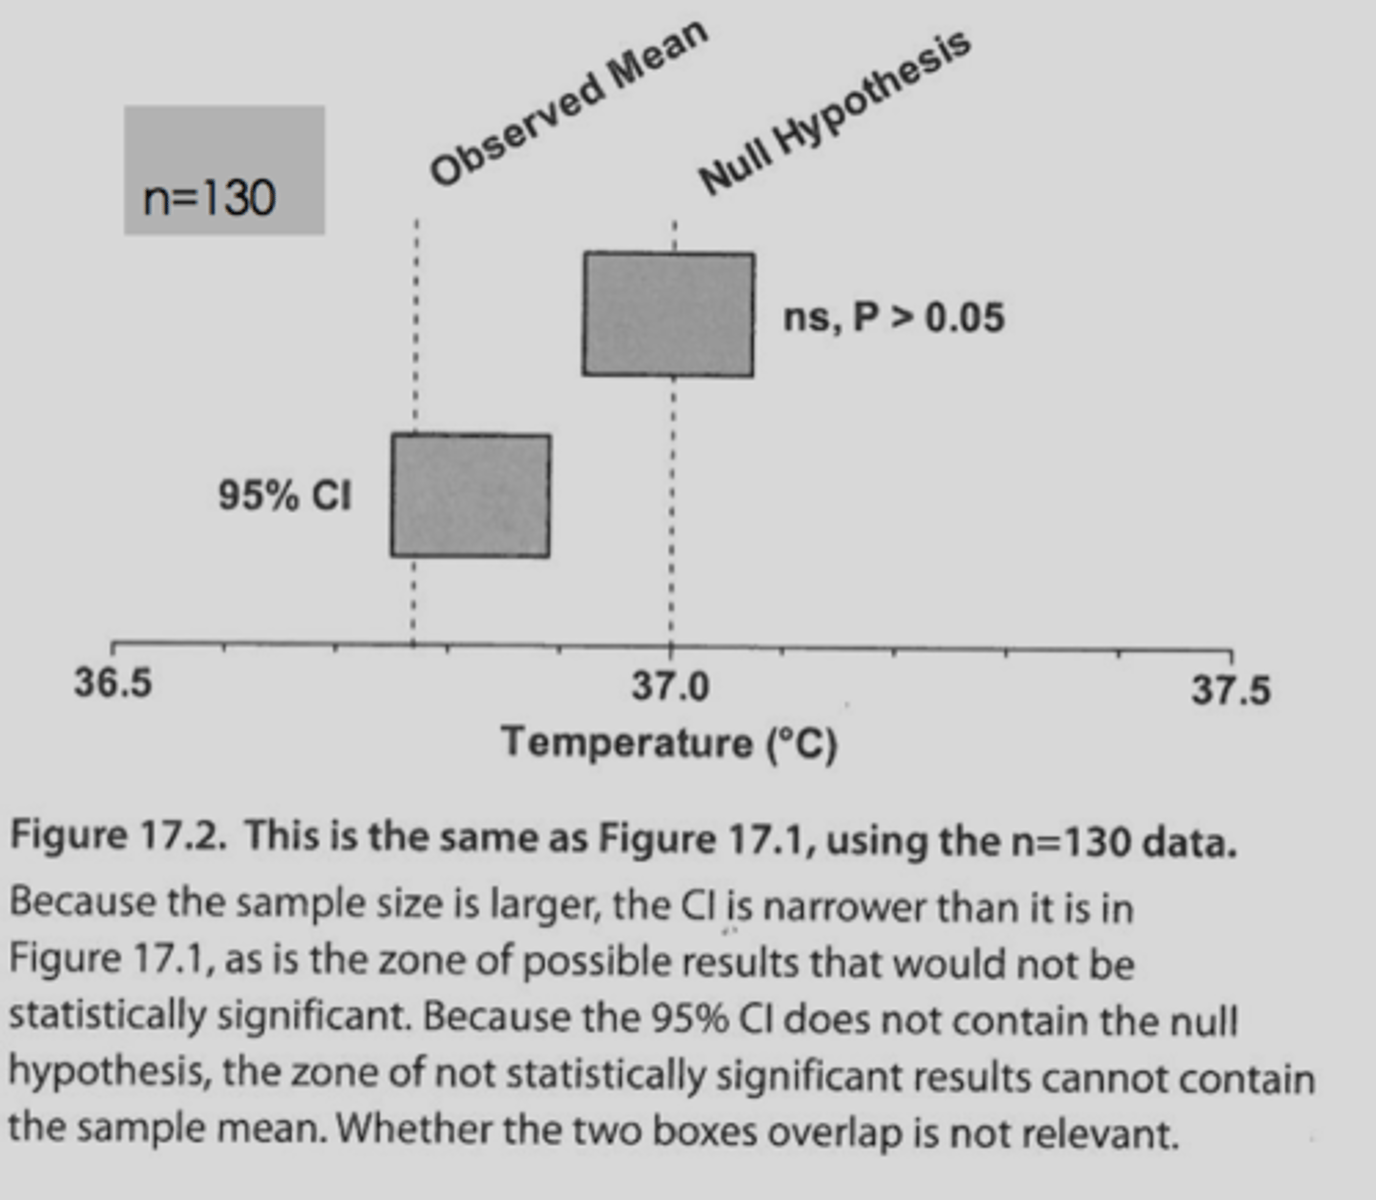
are results that fall within the CI range statistically significant?
no
-95% CI says that you are 95% confident that the population value will fit within the given range; if the null hypothesis were true then your CI range would include the experimental result-->no significant difference between the groups then
(avg body temp example when CI did not include 37*C, there was a significant difference)
any result outside of the CI range is considered significant
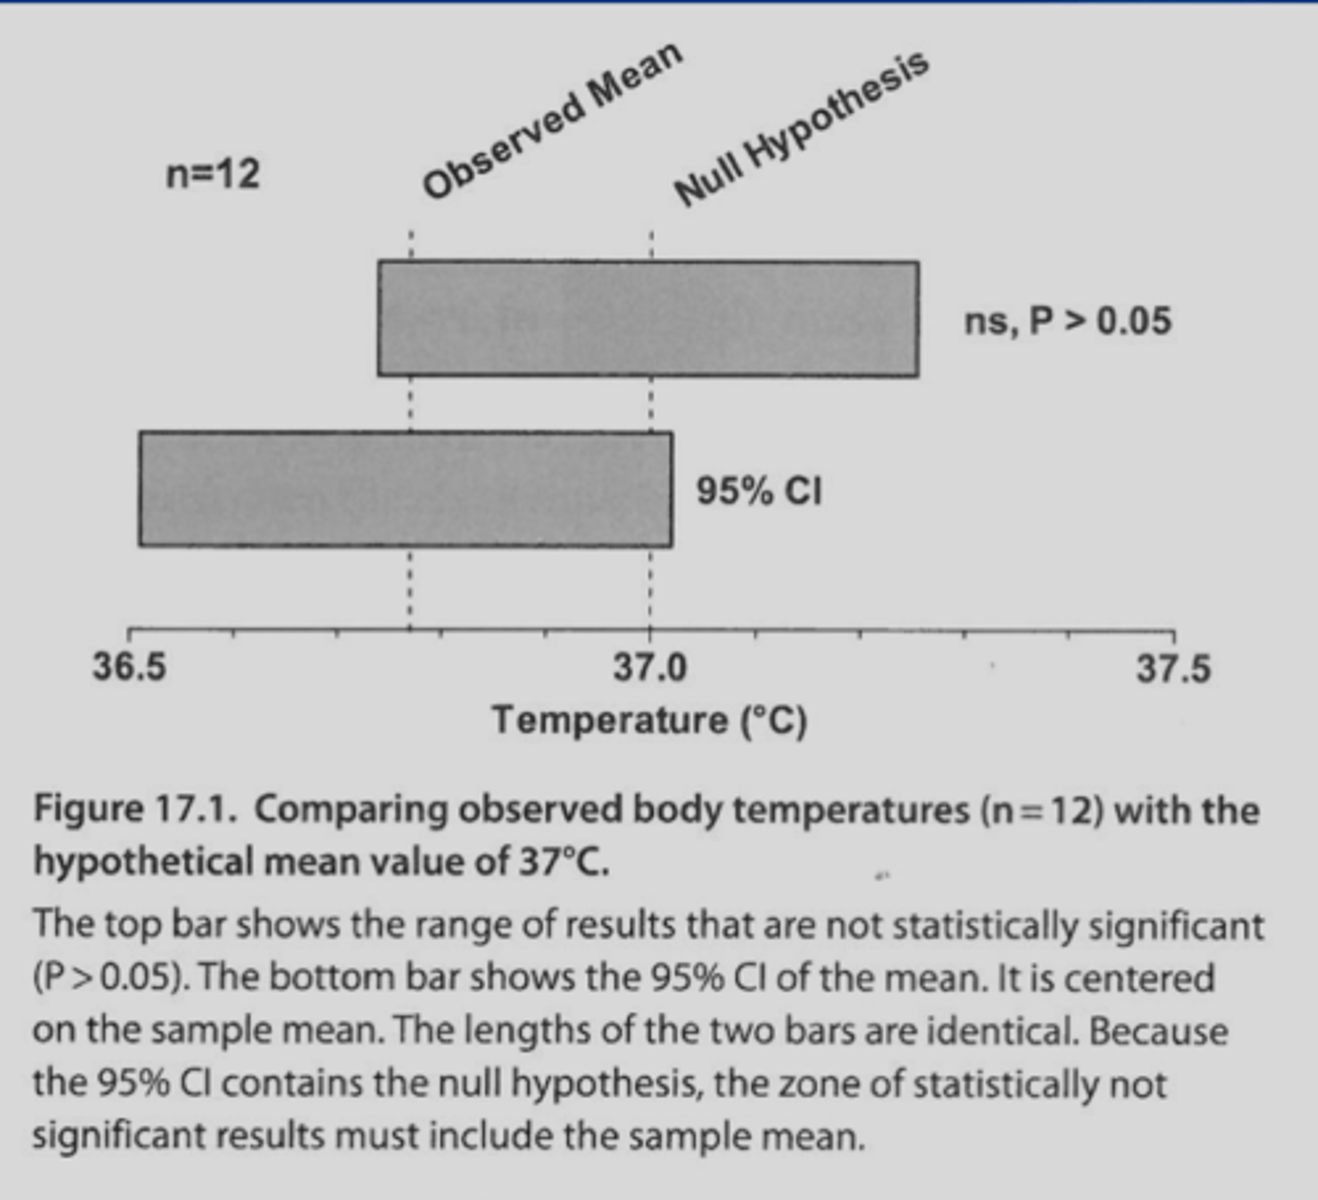
1. if a 95% CI does not contain the value of the null hypothesis, then the results will ___a.___ with a p value __b.____
2. if a 95% CI does contain the value of the null hypothesis, then the results will ___c.___ with a p value __d.___
1.
a. be statistically significant
b. <0.05
2.
c. not be statistically significant (null would be true meaning no difference between groups)
d. >0.05
1. if looking at the difference between two means what within the CI will tell you if there is significance or not?
2. if looking at two proportions between groups what within the CI will tell you if there is significance or not?
1. zero within the CI tells you there is no significance (if the CI includes zero, this means that the two groups were the exact same so subtracting them gives you zero)
2. one within the CI tells you there is no significance (if the CI includes one this means that the groups are the same because dividing them gives you one)
wouldn't even need to look at p values in this case
power of a statistical test
the probability that the test will reject the null hypothesis when the null hypothesis is false; probability of not making a type II error (false negative)
-the ability to detect a difference if one should be there
as power increases, chance of making a type II error _____
decrease!
probability of type II error occurring is called the false negative rate (Beta)
power=1-B
what tells researchers how many people they need to include in their study to find the difference they are looking for?
power!
-a way to calculate minimum sample size required to detect an effect of a given size
-if a study says they were "under powered" this means they didn't have enough people to find a difference if one should have been there
what type of error are you likely to make if you do multiple comparisons?
type I error (saying there is a difference and rejecting null when there actually is no difference)
-if you continue making comparisons you will eventually find some statistically significant results just by chance
how can you correct for multiple comparisons
familywise error rate
-the usual 5% chance applies to the entire family of comparisons--->less likely to make a type I error doing this but more likely to make type II now
ex: if you run 5 comparisons, divide the level of significance out; 0.05/5= 0.01; each group would have significance level of 0.01
if an experiment wants to make 20 comparisons, what should be done in order to avoid a multiple comparisons error?
apply the family wise error rate by performing the bonferroni correction
0.05/20=0.0025 so a result is only declared significant if it has a p value less than 0.0025
-this decreases risk of type I error but increases risk of type II since it will be more difficult to find a difference if one exists
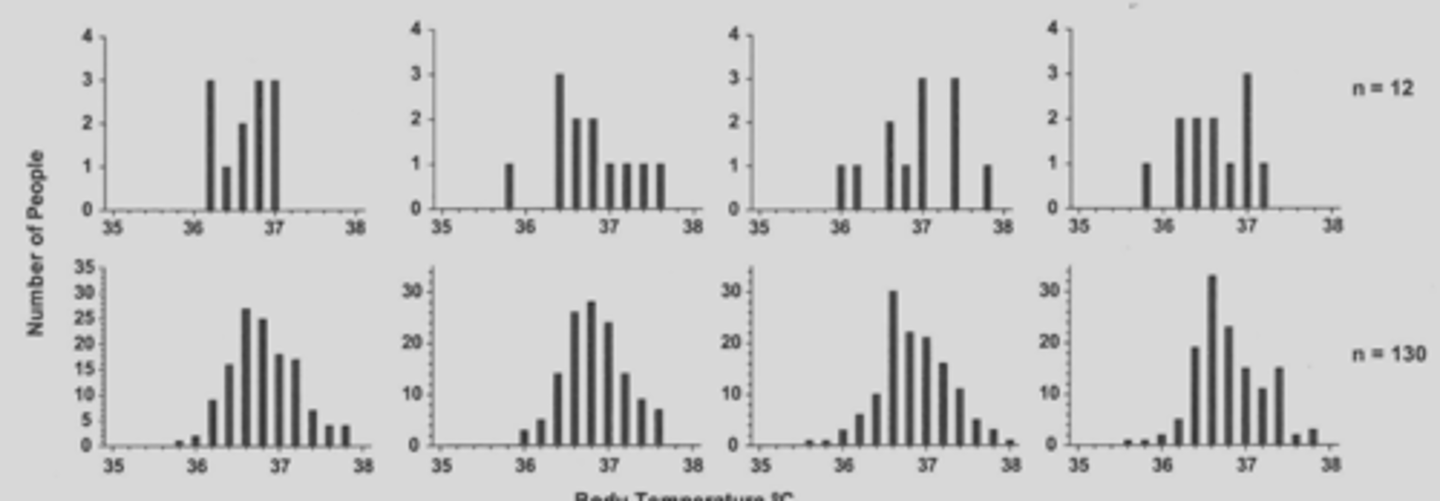
if a graph does not have a "bell shape" distribution does this mean it is not gaussian?
not necessarily
-ideal gaussian distribution includes very low negative numbers and super high positive values (outliers)
-in science you often don't have these extremes
-in the picture all the data is normally distributed but you rarely see bell shaped curves unless the sample size is enormous
when would you use a non-parametric test/non-gaussian test?
if you fail a normality test (if your normality test gives you a low p value your sample set differs a lot from normally distributed data; these differences from gaussian data are not just due to chance alone)
when performing a normality test your null hypothesis says that the data are sampled from a Gaussian population
power of a normality test increases with sample size
tests used to describe one sample; NOT running any sort of hypotheses here; just describing what you find(assuming normally distributed data)
-frequency distribution (just count how many times you get same value over and over)
-sample mean
-minimum and maximum value and range
-25th and 75th percentile
- SD
1. one sample t test
2. unpaired t test
3. paired t test
-use a one paired t test if making an inference about one population; comparing your sample back to one population
-use an unpaired t test when comparing the mean of two unmatched groups
-use a paired t test when comparing two matched groups
all of these are used only with normally distributed data
what is the best test to do for normally distributed data that is looking at a new medication vs a placebo
unpaired t test
-you are comparing two unmatched groups
another example of using this test would be taking oral temperatures in patients who take acetaminophen vs patients who take ibuprofen
if you are running a study that's trying to rate the most accurate way to monitor temperature (oral vs rectal) or the best way to measure BP (auscultation or invasive) what would be the best test
(assuming this is normally distributed data)
paired t test
-comparing matched groups meaning the values are measured in the same patient
when using normally distributed data:
what test is best to use when comparing three or more groups
anova!
-one-way anova if comparing three or more unmatched/unpaired groups
-repeated-measure anova followed by multiple comparisons tests if comparing three or more matched/paired groups
with normally distributed data:
1. what test is best to use when explaining or predicting one variable from another
2. what test is best to use when explaining or predicting one variable from several others
1. simple linear regression or simple nonlinear regression
2. multiple linear regression or multiple nonlinear regression
what does it mean if you get a high p value from your normality test
the data are not inconsistent with Gaussian distribution
-cannot reject the null; assume that your data is following gaussian distribution
-this does NOT prove that data were sampled from Gaussian distribution it just demonstrates that deviation from Gaussian is not more than you would expect to see with just chance alone
what does it mean if you get a low p value from your normality test
the null hypothesis is saying that the data are sampled from a Gaussian distribution
-a small p value allows you to reject the null hypothesis and accept that the data are not sampled from Gaussian population -->switch to non-parametric test now
are parametric or non-parametric tests more robust?
non-parametric tests are for non-normal distributed data and are more robust
-these tests are more conservative--> less likely to make a type I error but also more likely to make a type II error
1. low p value from an outlier test means
2. high p value from an outlier test means
1. a small p value allows you to conclude that the outlier is not from the same distribution as the other values-->reject the null hypotheses that data is sampled from Gaussian and switch to non-parametric
2. a high p value means that there is no evidence that the extreme value came from a different distribution than the rest-->cannot reject the null-->use parametric tests
why is the median robust and the mean is not?
the median is more robust because it's less sensitive to outliers so you are less likely to make a type I error
-non-parametric tests use the median rather than the mean; they can use the median because it's just looking at rank
test that compares the observed and expected values of subjects in each category to see if there is a difference between them
chi-square goodness-of-fit test
-a small p value in this test would say that there is another factor besides chance is accounting for the discrepancies between observed and expected
-deaths of firefighters during different tasks example (null said that the deaths occur randomly not during a particular event)
incidence vs prevalence
incidence: rate of new cases of disease
prevalence: fraction of group that has the disease; snapshot of the population that has the disease in question
two groups of subjects are selected; one with exposure to second hand smoke and one without exposure to second hand smoke. You watch these groups over time to see what incidence occurs whether they were exposed to the risk factor or not. This is what kind of study?
prospective study (longitudinal study)
-these studies observe over time to determine the incidence of rates in the two groups
-usually more labor intensive
experimental study vs prospective study
experimental:
-single sample selected and randomly divided into two groups
-each group gets a different treatment (or no treatment)
-researchers control who is exposed and not exposed
prospective:
-groups are selected based off if they have already been exposed or not; just lumping people together based off of exposure
a study that includes a group of subjects that already have the disease/condition you want to study and the other group does not but both groups have very similar characteristics. Investigators look back in time to determine if possible risk factors were present or not. This is describing what kind of study
case-control study (retrospective study)
ex: looking back at people who have lung cancer; was there a common risk factor that could have contributed to them getting this disease?
a study looked at the effectiveness of zodovudine (AZT) in treating asymptomatic people with HIV. They randomized the groups and had one receive the medication and one receive a placebo. They wanted to know if treatment with AZT reduces progression of the disease. disease progressed in 16% of the patients receiving AZT and the disease progressed in 28% of the patients receiving the placebo. What is the attributable risk/absolute risk reduction?
the attributable risk/absolute risk reduction is 28%-16%=12%
with a 95% CI of 6.7-17.3% and p <0.001 we can say that if we extrapolate this out to the population of HIV patients, they are 95% confident thtat it will reduce the progression of the disease between 6.7% and 17.3%
-since this is a difference would not want 0 in the CI-->would mean that the groups are the exact same-->no significance
number needed to treat (NNT)
the reciprocal of absolute risk reduction
-in the HIV example the absolute risk reduction was 12% so the NNT is 1/0.12= 8.33
-meaning for every 8 patients receiving treatment you would expect disease progression to be prevented in 1 patient
is it better to have higher or lower NNT?
lower! the less people you have to see in order to see a benefit, the more effective the medication/treatment
relative risk
using the HIV study example
-relative risk is the ratio between two proportions; progression in the treatment group/progression in the placebo group
-16%/28%=0.57 so subjects treated with AZT were 57% as likely as placebo to have disease progression
-relative risk between 0 and 1.0 means the risk decreases with treatment
-if relative is 0 then there is no risk of disease progression at all; if it is 1 then this means the groups are the exact same-->no significance (don't want 1 in the CI)
relative risk vs absolute risk reduction (attributable risk)
-relative risk is a ratio between two proportions (progression in tx group/progression in placebo group
-absolute risk reduction is a difference between the % of progression in both groups (placebo group-treatment group)
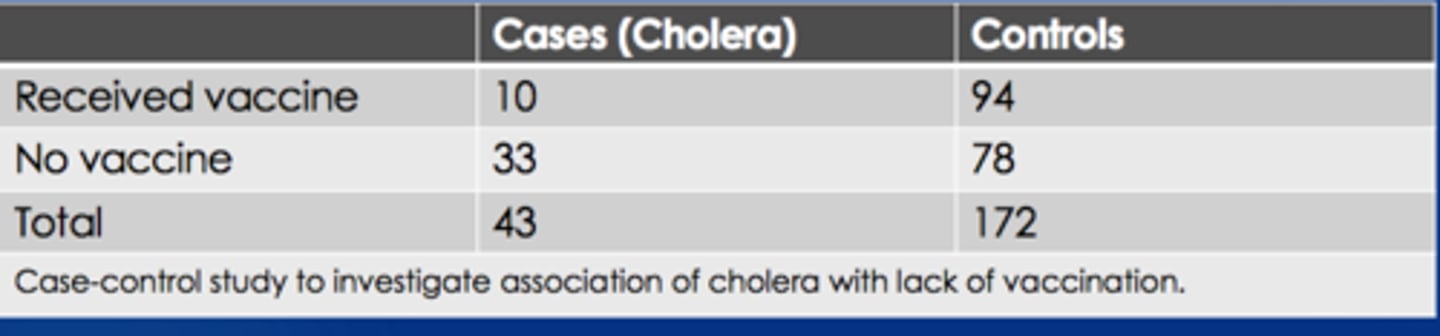
a study looking at whether people with cholera are less likely to have been vaccinated than those who did not get cholera is what kind of study?
case control (retrospective)
-disease is cholera and looking back in time to see if people with cholera did not have the vaccine
-null=there is no difference in vaccination rates between people who did and did not have cholera
which type of study usually has more controls compared to cases?
case control studies
-this is in order to make sure you have a good comparisons; accounting for outliers
how do you calculate the relative risk for a case-control study?
you can't calculate relative risk from a case-control study because you can't calculate incidence from this data; don't have data on the entire population
-use odds ratio instead
what is the odds ratio and what type of study should it be used in?
odds ratio= the probability that the event will occur divided by the probability that the event with not occur
-divide probability by 1-probability
used in case control studies
horse runs 100 races and wins 25 times. what is the probability vs odds ratio
1. probability is the fraction of times you expect to see that event in many trials
-probability is 25/100=.25
2. odds ratio is the probability of the event happening/by the probability of the event not happening
-odds ratio= 0.25/1-0.25=0.25/0.75= 0.333 so 1 win to 3 loses
which studies use odds ratio and which studies use relative risk? (know)
-case control or retrospective use odds ratio
-prospective studies use relative risk
after running a retrospective study on people with cholera and whether they were vaccinated or not you get an odds ratio of 0.25. 95% CI is 0.12 to 0.54. what does this mean and is it significant?
-this means that people who are vaccinated are 25% as likely to get cholera as unvaccinated people; this means people with the vaccine are protected; their odds of getting cholera are much less
-this is significant because the CI does not include 1
-in vaccination studies can subtract 1-0.25=0.75 and say that vaccine is 75% effective in preventing cholera
(assuming normally distributed data) what kind of test would be appropriate if you were doing a pre and post test in the same person or a test on siblings, subjects recruited as pairs, or a mom and child?
paired t test
-best when wanting to show that there is some type of relationship between the two groups being tested
association between two continuous variables can quantified as
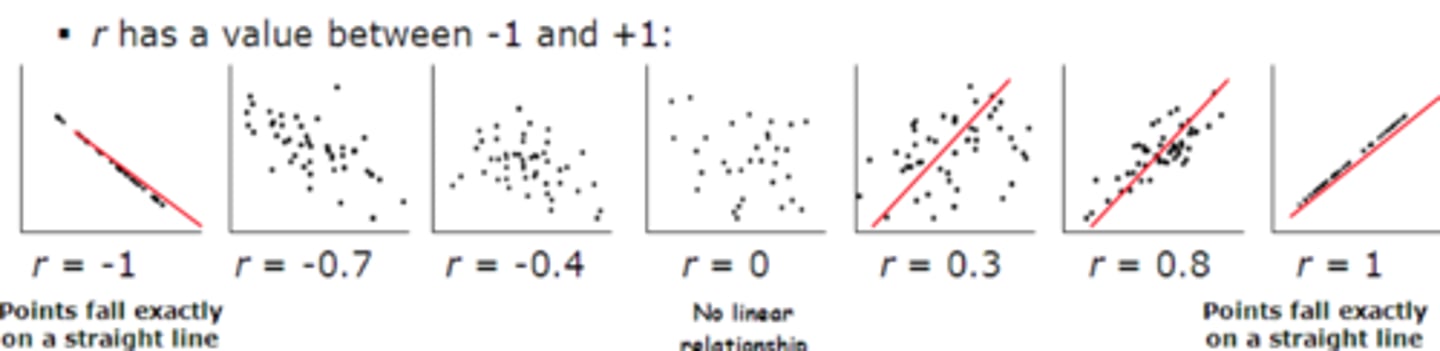
correlation coefficient (r)
-as you change one variable how does it affect the other?
-if as one variable increases, the other increases as well you will see a positive correlation
-correlation does not necessarily imply simple causality (ex: increased life span in people with more telephones); both increasing together but no direct causation
1. what correlation coefficient will you see if two variables do not vary together at all?
2. what correlation coefficient will you see if two varibales tend to increase or decrease together?
3. what correlation coefficient will you see if two variables are inversely related (one goes up and the other goes down)
1. 0 (will see a horizontal line); as values get closer to 0 will see more scatter
2. + (will see a line going up to the right
3. - (will see a line going down to the down to the right)
goals of linear regression
to "fit the best line" through the graph of data points
-wants to determine the most likely values of the parameters that define that model
-finds the line that best predicts Y from X