Representing Data: Statistics for Uninvaritable data - A&A
1/29
Name | Mastery | Learn | Test | Matching | Spaced | Call with Kai | Chat |
|---|
No analytics yet
Send a link to your students to track their progress
30 Terms
Discrete Data
Specific to something, think as many details as possible
Continuous Data
Something that is not specific - think: Can change, and the data will fluctuate
Population
Population is a whole- Think: City, class
Sample
A section of the said population → Think: Funny people in a class or red buildings in a city
Convenience
Most accessible members of a population
Simple Random
Any member of a population has an equal chance of being chosen (the random element)
Systematic
Set intervals from points on a list (think: every 10th person)
Stratified
Deciding a population into small groups based on characteristics (strata) - random sample from each strata
Quota
Very similar to stratified→ BUT set sample size take from each strata
Bar chart
Used for discrete data
Histogram
Used for continuous data
Left skewed
Small → large
Normal Distributed
Small → Big → small
Right skewed
Big → Small
Mean
Sum of all data → all data added/by the amount of data points there are
Mode
Most commonly appearing value
Median
Middle of the data - if their is no middle find the mean of the middle
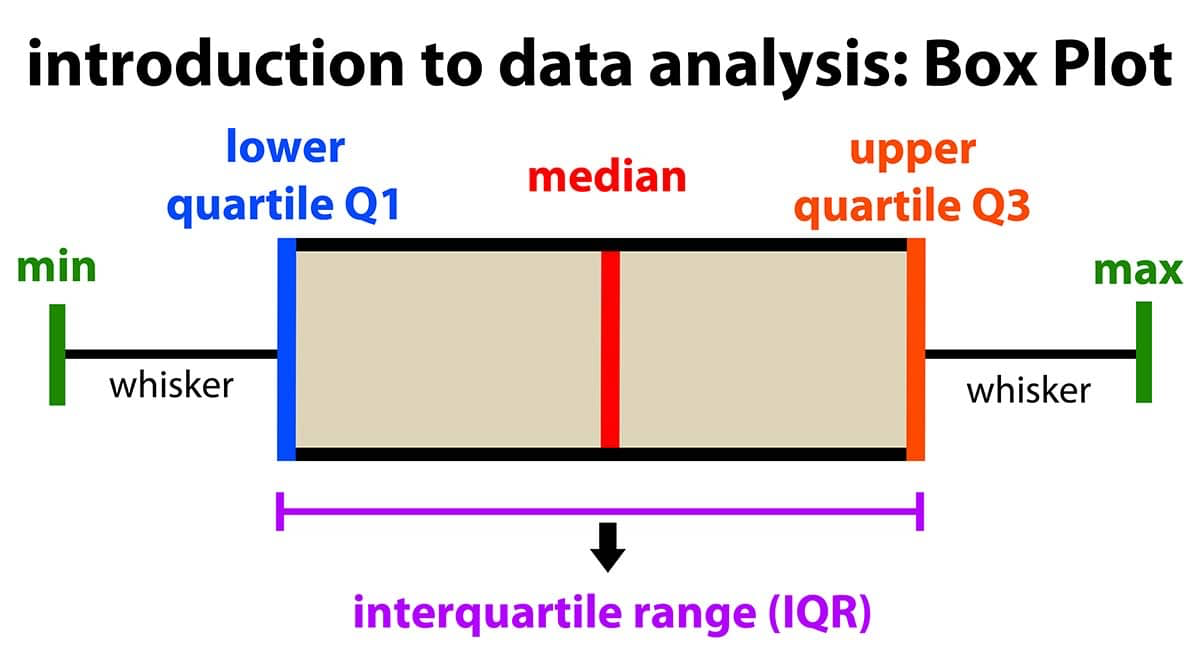
Quartile range
Breaking down the data into 4 equal parts
Q1
25% of the data → Lower quartile
Q2
Or the ½ way point 50% of the data (Median).
Q3
Upper Quartile 75% of the data
Range
The distance between the smallest and largest values in a data set
Inter Quartile Range (IQR)
Q3-Q1
Box plots
Outlier
A very large or small number that will potentially disrupt the data - 1.5 x IQR (above Q3 or bellow Q1)
Cumulative frequency
A running total of how many values are up to a certain point.
Percentiles
A number that tells you what percent of data is below it.
Variance
The average of the squared differences from the mean. It measures how spread out the data is.
Standard Deviation
The square root of the variance. It shows the average distance each value is from the mean.
Effects of Adding or Multiplying to All Values in a Data Set
Adding a number (+a):
• Mean, Median, Mode: +a
• Standard Deviation & Variance: No change
Multiplying by a number (×a):
• Mean, Median, Mode: ×a
• Standard Deviation: ×a
• Variance: ×a²