Demand, Supply, and Market Equilibrium
1/38
Earn XP
Description and Tags
Name | Mastery | Learn | Test | Matching | Spaced | Call with Kai |
|---|
No analytics yet
Send a link to your students to track their progress
39 Terms
Demand
the buying intentions of consumers
demand operates on consumer sovereignty. this means that the consumers, through demand, determine what will be produced and how much of it will be produced. This also means consumers set the price in the economy, not producers.
The law of demand
as the price of a good rises, people will buy less of it, ceteris parabis
there is an inverse relationship between the prices and quantity demanded
there are no exceptions to the law of demand, because it will always be negative as long as the ceteris parabis holds
A consumer will always prefer to pay a lower price for the same good than a higher price
income effect
if the price of a good rises, consumers will buy less of it because their real income has decreased. If the price of a good decreases, they will buy more.
real income: the quantity of foods you can buy with a fixed amount of money
when real income falls, people are poorer and therefore will purchase less and vice versa.
substitution effect
if the price of one good rises, consumers will see if they can swap it for a cheaper good
an increase of price will cause consumers to switch to relatively cheaper substitutions
changes in demand: price
an increase in price will cause a decrease in quantity demanded
a decrease in price will cause an increase in quantity demanded
a change in price results in a change in quantity demanded directly. A change in price cannot shift the curve.
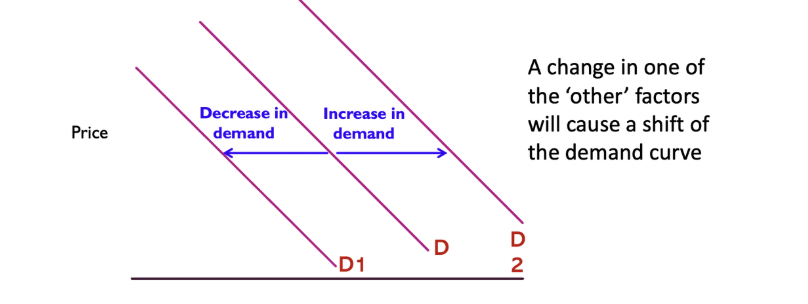
changes in demand: non price factors
when a non price factor changes, it results in a new demand curve
a shift of the curve to the right is called an increase in demand
a shift of the curve to the left is called a decrease in demand
non price factors: levels of disposable income
your level of income determines your budget - what you can and cannot afford
consumers will normally purchase more of a good when their income increases.
normal good: a good where demand increases as income increases. Most goods and services are normal goods
inferior good: when demand decreases as income rises. e.g. home brand products
non price factors: price of related goods
on most occasions, consumers can choose between a number of goods and services which satisfy the same want
substitutes: goods that satisfy the same wants; consumers can choose between them
complements: goods that are consumed alongside other goods
non price factors: tastes and preferences
the tastes and preferences of consumers are an important determinant of consumer demand
the advertising industry plays an important role in affecting consumers’ preferences and spending habits
non price factors: expectations of consumers / expected future prices
if people expect conditions to change in the future, they may make decisions now rather than postpone them.
for example, if the price of petrol is expected to rise in the future, then consumers will have an incentive to increase their purchases now to beat the price rise. This is rational behaviour and will result in an increase of demand temporarily
non price factors: demographic factors
the size and age composition of the population can have an important bearing on the pattern of demand
a growing population increases the market size for all goods and services whereas a change in age profile will affect specific goods and services
for example, as the Australian population ages, the demand for child care facilities will decrease relative to the demand for retirement facilities.
Supply
the amount of a good or service that producers are willing and able to cell at a particular point in time
law of supply
as the price of a good rices, the quantity supplied
will also rise
the law of supply is opposite to the law of demand meaning it has a positive relationship between supply and price
rational, self-interested producers would rather sell their goods at a high price than at a low price. This is because the higher the ell price the larger the profit margin.
supply schedule
quantity supplied increases as price increases
firms will supply more goods if they can get a higher price
it is a market supply schedule which means it is the sum of all individual producers in the market.
Changes in supply:
price:
a change in price will lead to an expansion or contraction of supply
a rise in supply leads to an expansion of supply, meaning the quantity supplied increases and the point will move to the right
contraction of supply, means that the quantity supplied decreases and the point will move to the left.
non price:
a change in a non-price factor will lead to a shift of the supply curve
an increase in supply means it will shift the right
a decrease in supply means it will shift to the left.
change in supply: price
as the price of a good increases, the quantity supplied increase
if given a choice between two identical goods, firms will choose to sell them for $30 each rather than $15 each.
a change in price will result in a shift along the curve
changes in supply: cost of production
if the cost of production increases, supply will decrease and vice versa.
the prices of resources such as labour, capital or raw materials determine the firms cost of production
an increase in production will mean that for a given price, the firm will decrease its production
when production cost rises, market prices will rise
factors of production: as the price of resources increase, supply will decrease and vice versa.
changes in supply: technology
technology is the knowledge about the techniques of production
if technology improves, then more output can be produced from the same quantity of resources. This means the firms production cost will fall
other things being equal, an improvement in technology will result in an increase in supply.
the cost of many products such as computers, household appliances and electrical devices has continuously fallen over time as a result of improvement technology
changes in supply: number of sellers
if new sellers enter the market, then market supply will increase and the market supply curve will shift to the right
sellers may be entices to enter a market if profit opportunities are strong.
more sellers increases competition in the market and usually results in a fall in market price
when firms exit a market, then the market supply curve will shift to the left - a decrease in supply.
changes in supply: expectations of producers
suppliers expectations of future prices and conditions will affect supply
if higher prices are expected in the future, then firms will decrease their current supply in order to take advantage of the future prices
firms will make decisions about investing in plant and machinery on expected future prices
e.g. if expected prices for iron ore are high, this will encourage increased exploration.
changes in supply: prices of other goods
the production process involves combing productive resources to produce a final good. In many cases, the same resources could be used to produce other goods
the producer will closely monitor movements in the price of goods they are capable of supply so that they can take advantage of profit opportunities.
e.g. a farmer may shift resources from wheat production to wool if the price of wool rises relative to wheat.
e.g. a car manufacturer will decrease supply of petrol if electric cars become more popular.
Market equilibrium
the price that clears the market and balances the buying intentions of consumers with the selling intensions of producers
the equilibrium quantity will be where quantity demanded equals quantity supplied
the equilibrium price is the amount in which buyers are willing to buy that is exactly the same as the amount that sellers are willing to sell.
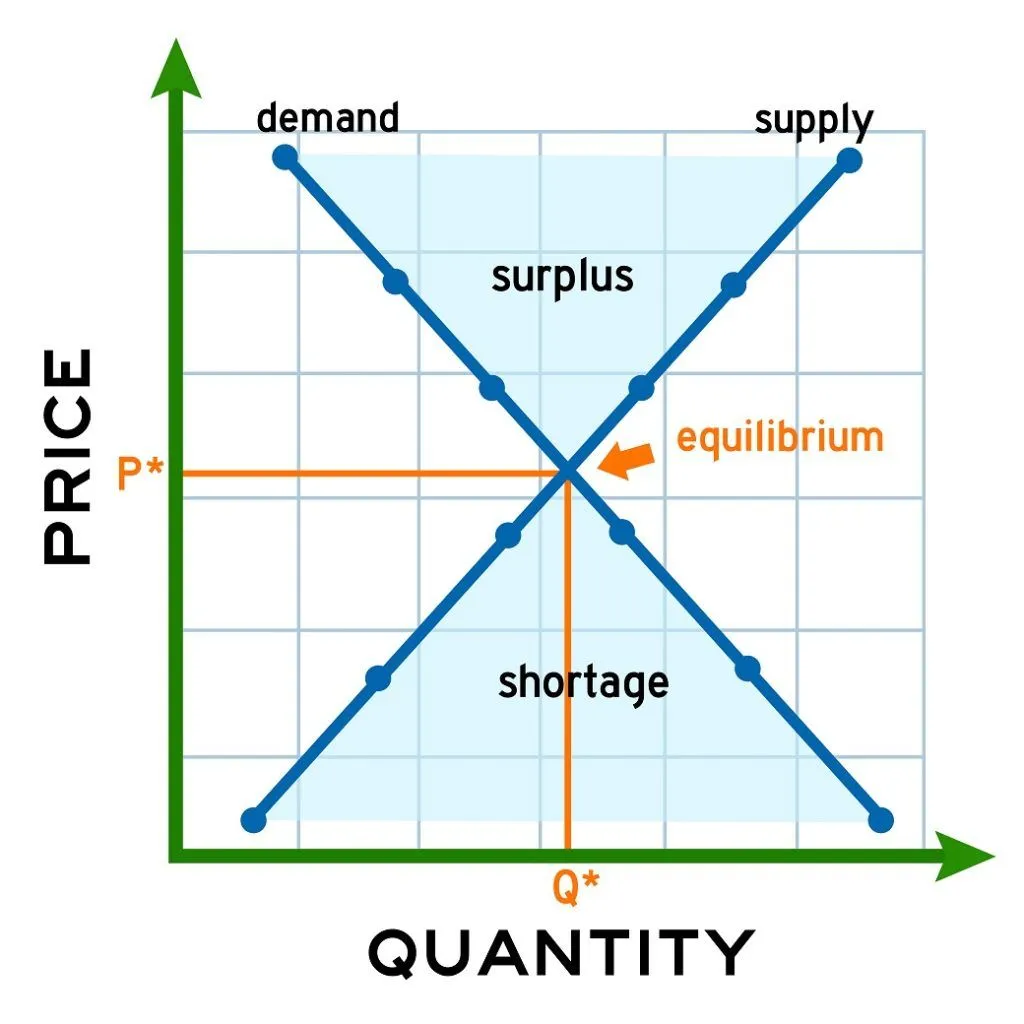
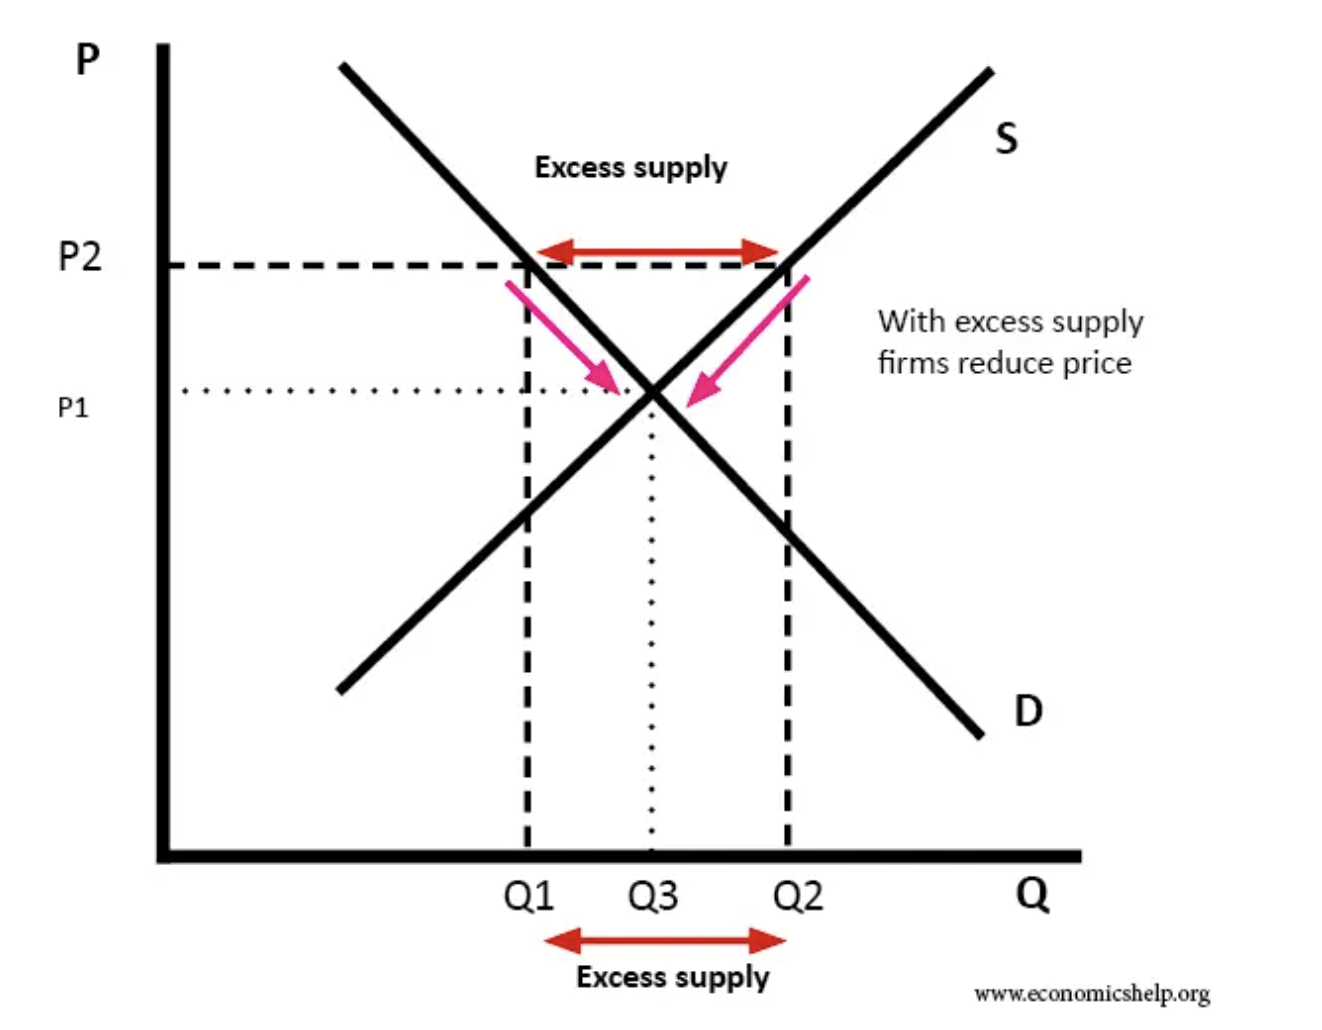
surplus
when the market price point is above the equilibrium point, the prices are too high to clear the market
sellers want to eliminate the surplus by lowering prices.
as prices fall, more consumers will want to purchase so that the excess supply will be eliminated
as prices fall, consumers move down along the demand curve while sellers move down along the supply curve.
as long as there is a surplus, sellers will have an incentive to lower prices. The price will keep falling until equilibrium is met.
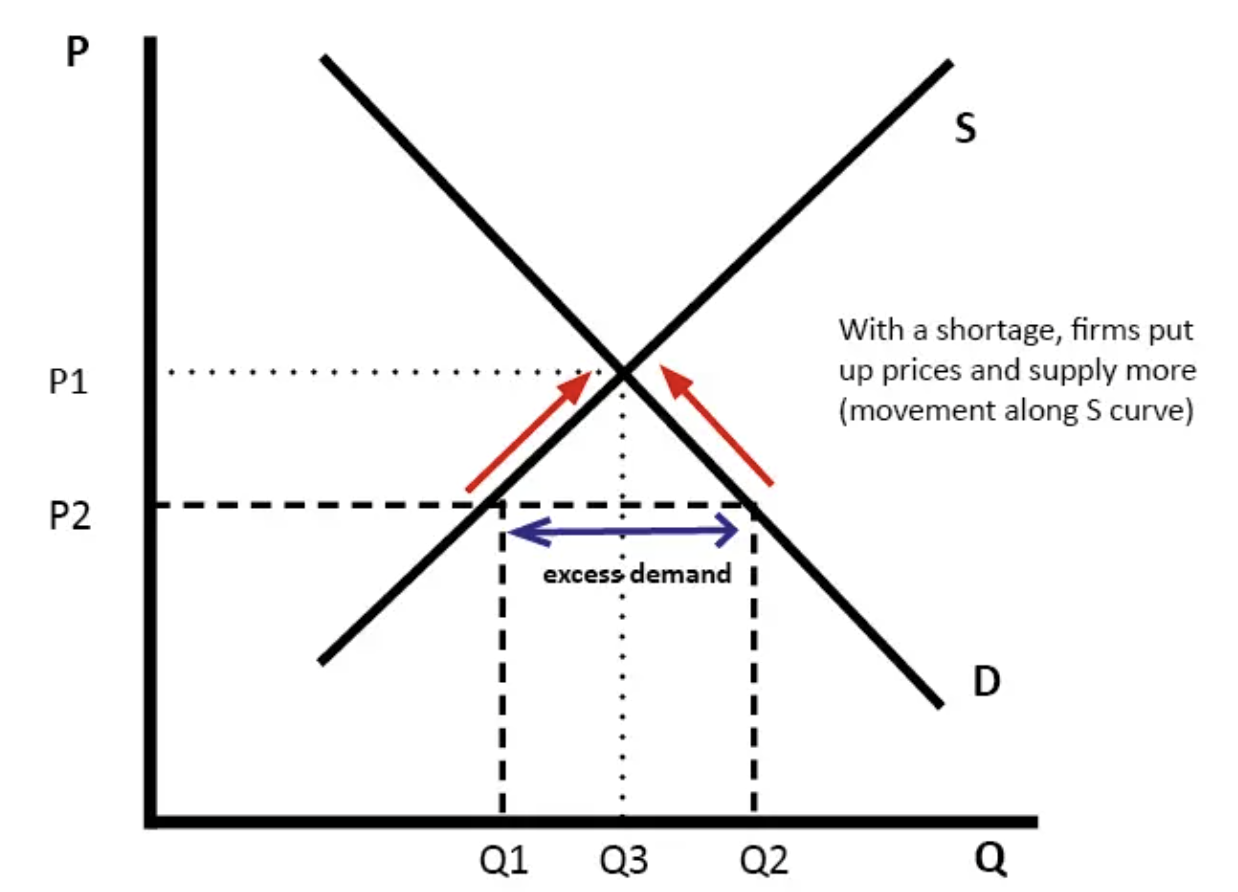
shortages
when the market price point in below the equilibrium point, the prices are too low to clear the market.
buyers will react to this shortage by bidding up the price, as there is now not enough for everyone.
as price rises, more sellers will want to supply the good or service and the excess demand will be eliminated
as price falls, consumers move up along the demand curve and sellers move up along the supply curve.
As long as there is a shortage, sellers will have an incentive to increase prices. The price will keep rising until equilibrium is met.
price mechanism (equilibrium)
the ‘invisible hand’ of the market which cause excess supply to force prices down while excess demand to force prices to rise
changes to th market will create either temporary shortages or surpluses which will then cause price to change to re establish a new equilibrium. The length of time required to eliminate shortages and surpluses though will vary from market to market.
As long as a market is able to operate freely, prices will always adjust to balance demand and supply.
price mechanism examples
in the share market, prices change very quickly to find a balance between buyers and sellers.
The price of the Australian dollar changes by the minute to balance supply and demand factors.
In fruit and vegetable markets, prices adjust daily in response to supply and demand conditions. These are all good examples of competitive markets.
changes in equilibrium
prices in markets fluctuate because of changes in either demand or supply conditions which cause shifts in the curves
if the demand or supply curve shift, a new equilibrium will be established
there are four types of changes to market equilibrium: an increase in demand, a decrease in demand, and increase in supply, and a decrease in supply
Increase in demand
an increase in demand will cause the demand curve to shift to the right. Because of this, the original equilibrium point is now a point of shortage in the market
the excess demand will cause the price to rise to a higher equilibrium (more to the right) where the new demand curve now intersects with the old supply curve
an increase in demand will therefore cause and increase in both the equilibrium price and the equilibrium quantity. Whenever there is a rise in prices, demand for that good or service is increasing.
decrease in demand
a decrease in demand will cause the demand curve to shift to the left. Because of this the original equilibrium point is now a point of surplus in the market
the excess supply will cause price to fall to a lower equilibrium price. At the lower price, quantitiy supplied will fall to the new equilibrium quantity.
a decrease in demand will cause a decrease in both equilibrium price and quantity. Whenever prices and sales are falling in the market, demand for that product is decreasing.
increase in supply
an increase in supply will cause the supply curve to shift to the right. Because of this, the original equilibrium point is now a point of surplus in the market
the excess supply will drive prices down to the new equilibrium. Whenever prices fall and quantity rises, supply for the product in increases
an increase in supply will cause a decrease in equillibrium price and an increase in equilibrium quantity
decrease in supply
a decrease in supply will cause the supply curve to shift left. Because of this, the original equilibrium point is now a point of shortage in the market.
the excess demand will drive price up to the new equilibrium. Whenever prices rise and quantity falls in a market, supply for the product is decreasing
a decrease in supply will result in an increase in equilibrium price and a decrease in equilibrium quantity
increase in demand, no change in supply
price increase
quantity increase
decrease in demand, no change in supply
price decrease
quantity decrease
increase in supply, no change in demand
price decrease
quantity increase
decrease in supply, no change in demand
price increase
quantity decrease
increase in demand, increase in supple
price change indeterminate
quantity increase
increase in demand, decrease in supply
price increase
quantity change indeterminate
decrease in demand, increase in supply
price decrease
quantity change indeterminate
decrease in demand, decrease in supply
price change indeterminate
quantity decrease