L1(3.4.5d Evolution over tim)Clarifying evolutionary relationships
1/4
There's no tags or description
Looks like no tags are added yet.
Name | Mastery | Learn | Test | Matching | Spaced | Call with Kai |
|---|
No analytics yet
Send a link to your students to track their progress
5 Terms
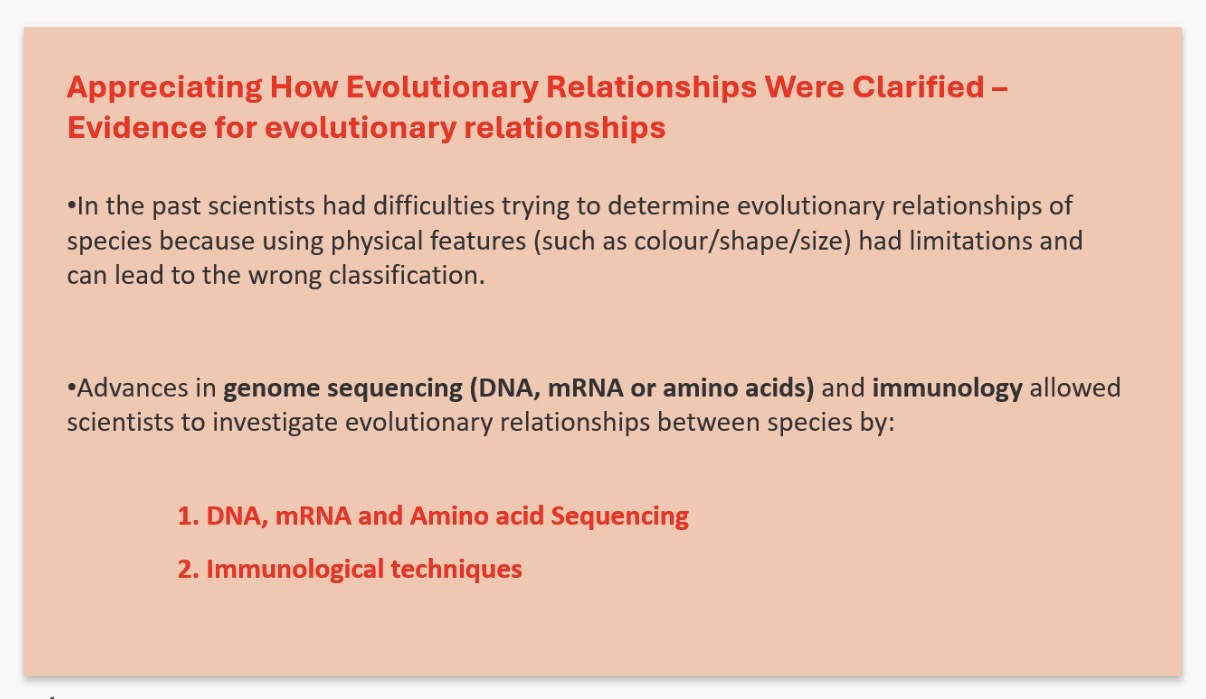
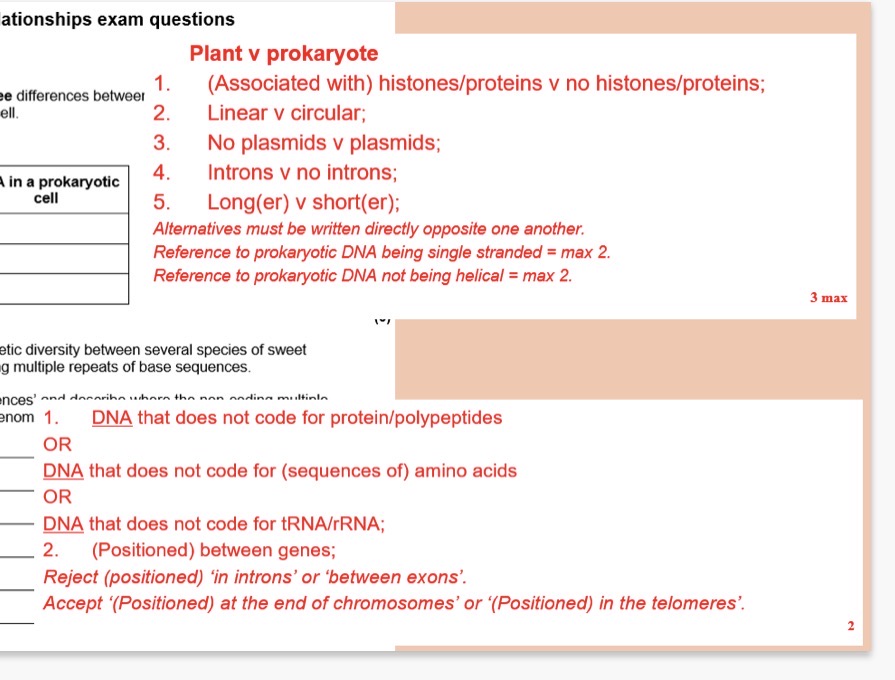
1. DNA, mRNA and Amino acid Sequencing (see 3.4.7 investigating diversity)
•Three types of sequencing used to investigate evolutionary relationships: DNA, mRNA, …1? (of a protein).
•Sequencing determines the order of DNA …2?, mRNA …2? and amino acids within an organism's genome.(A genome is the complete set of genetic instructions in a cell or organism)
•useful for comparing DNA of …3? species to existing species
or
•when distinguishing between species that are very …4? similar
•Looking at multiple proteins or multiple regions of the genome allows for a more accurate estimate of evolutionary relatedness
•The gene or protein sequenced needs to be present in …5? the organisms being studied e.g. Cytochrome c is found in all eukaryotic organisms (protein used in respiration (in the ETC)
•Sequence analysis and comparison can be used to create …6? trees that show the …7? relationships between species
•FOR ALL TYPES OF SEQUENCE DATA IT CAN BE SAID THAT THE MORE SIMILAR THE SEQUENCES, THE MORE …8? RELATED THE SPECIES ARE
•TWO GROUPS OF ORGANISMS WITH VERY SIMILAR SEQUENCES WILL HAVE SEPARATED INTO SEPARATE SPECIES MORE …9? THAN TWO GROUPS WITH LESS SIMILARITY IN THEIR SEQUENCES
•SPECIES THAT HAVE BEEN SEPARATED FOR LONGER HAVE HAD A GREATER AMOUNT OF …10? TO ACCUMULATE MUTATIONS AND CHANGES TO THEIR …11?, MRNA AND AMINO ACID SEQUENCES
Amino acids. 2.bases. 3.extinct
physically. 5.all. 6. Family
evolutionary. 8.closely
recently 10.time. 11.DNA
2.Immunological Techniques
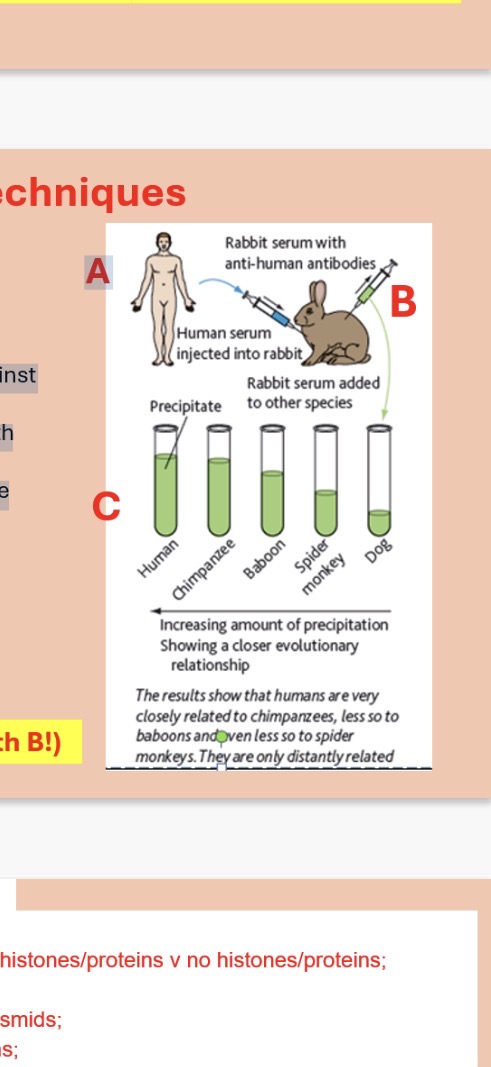
Using specific antibodies to compare species
1) Serum taken from species A (human) and …1? into species B (rabbit)
2) Species B (rabbit) then produces specific …2? against human antigens(A stands for human)
3) This mix of serum and antibodies from B is then …3? with species C (human, chimp, baboon..)
4)The specific antibodies will bind to specific …4? in the serum of species C.
5) Antibody binding specifically with antigens will form a …5?
6. The greater the number of similar antigens the antibody binds to in C the more …6? is formed showing how closely related a species can be.
Note: We are comparing species A and C (NOT B!) (B is only there to produce antibodies) (serum C contains 1000s of proteins but we only care about the ones that look like human proteins(antigens))
Injected
Antibodies
Mixed
Antigens
Precipitate
Precipitate
Answer image
Answer image
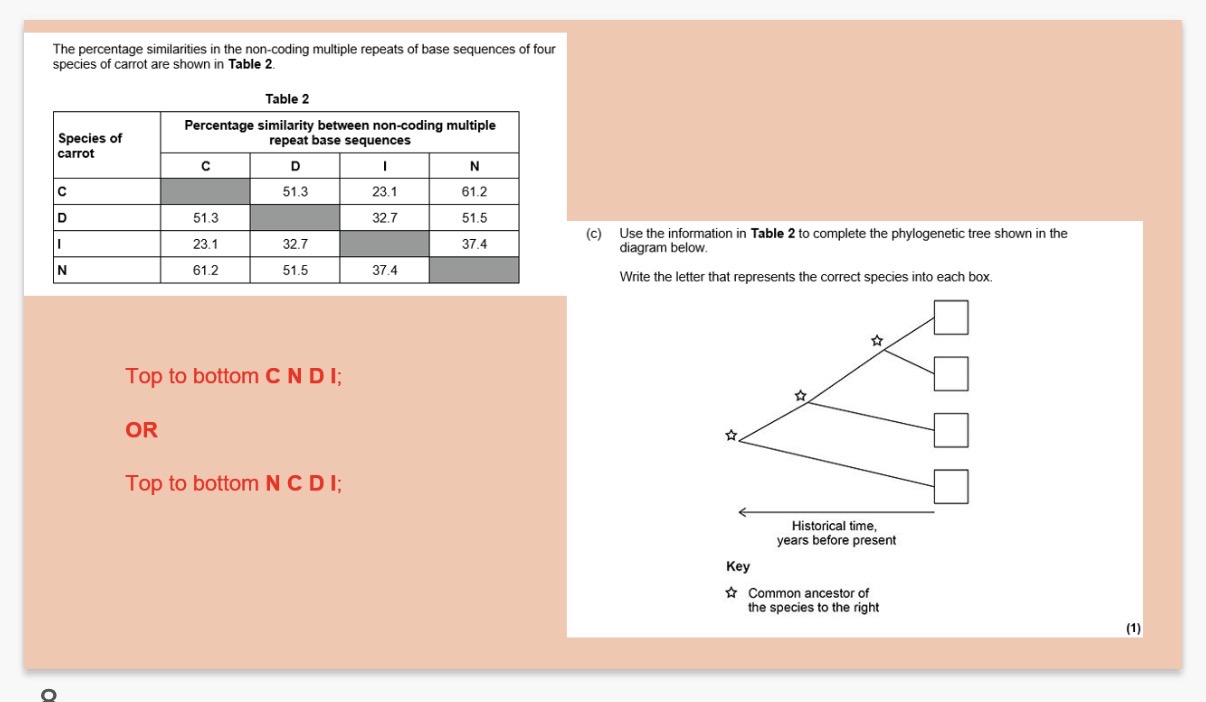
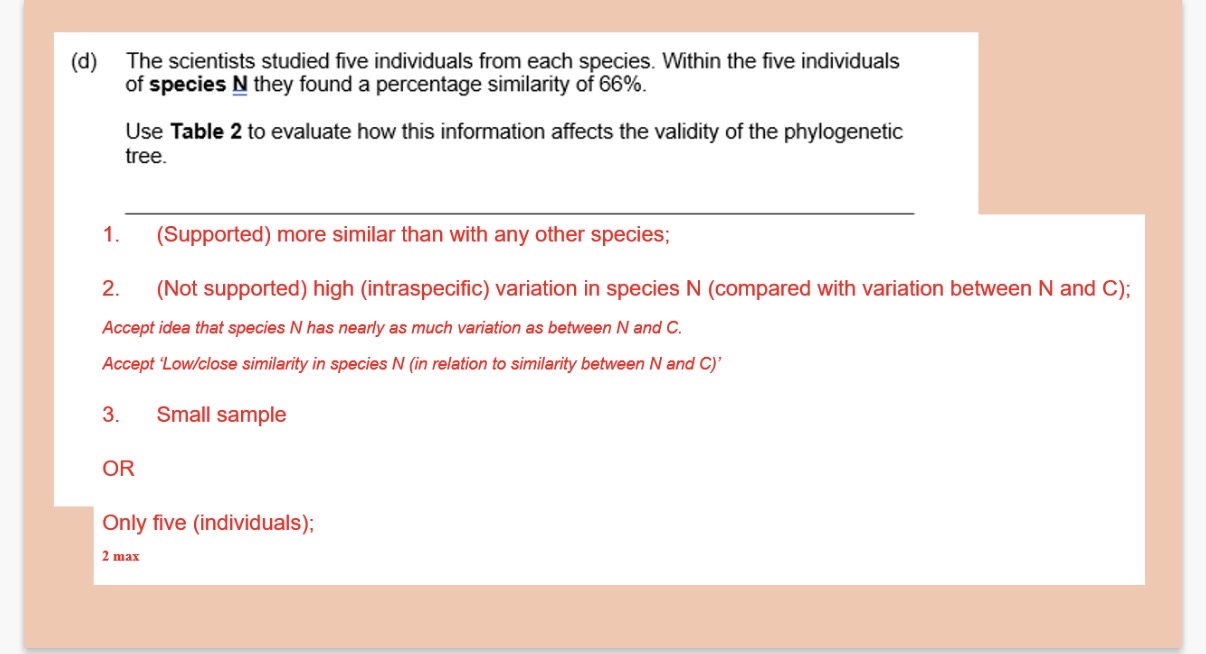
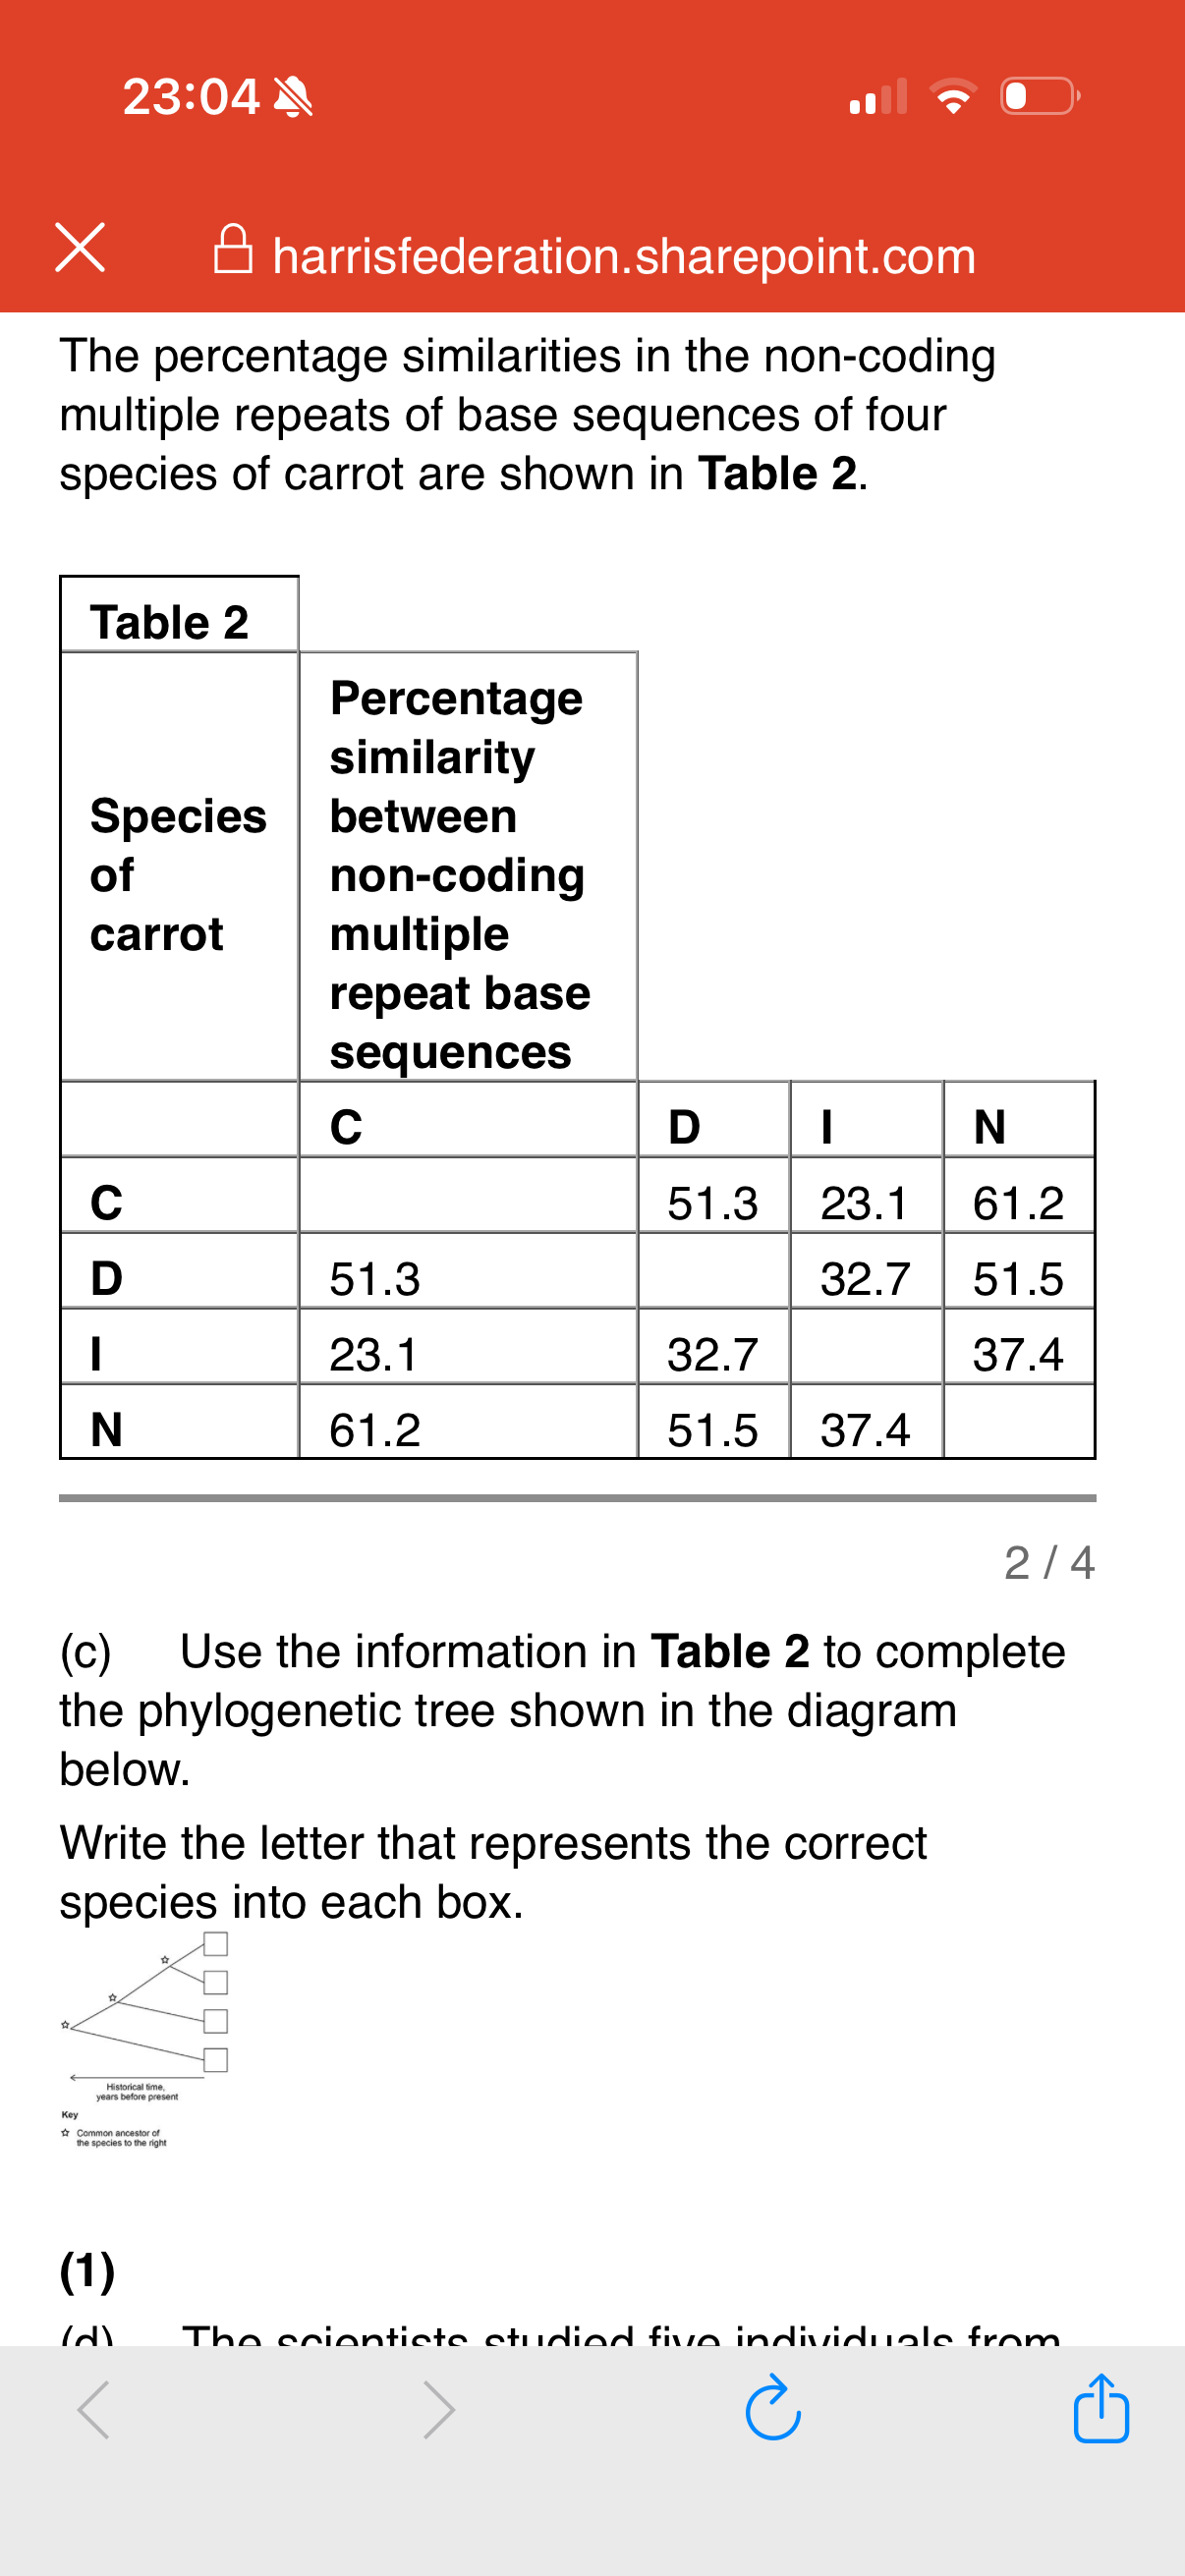
Answer question D
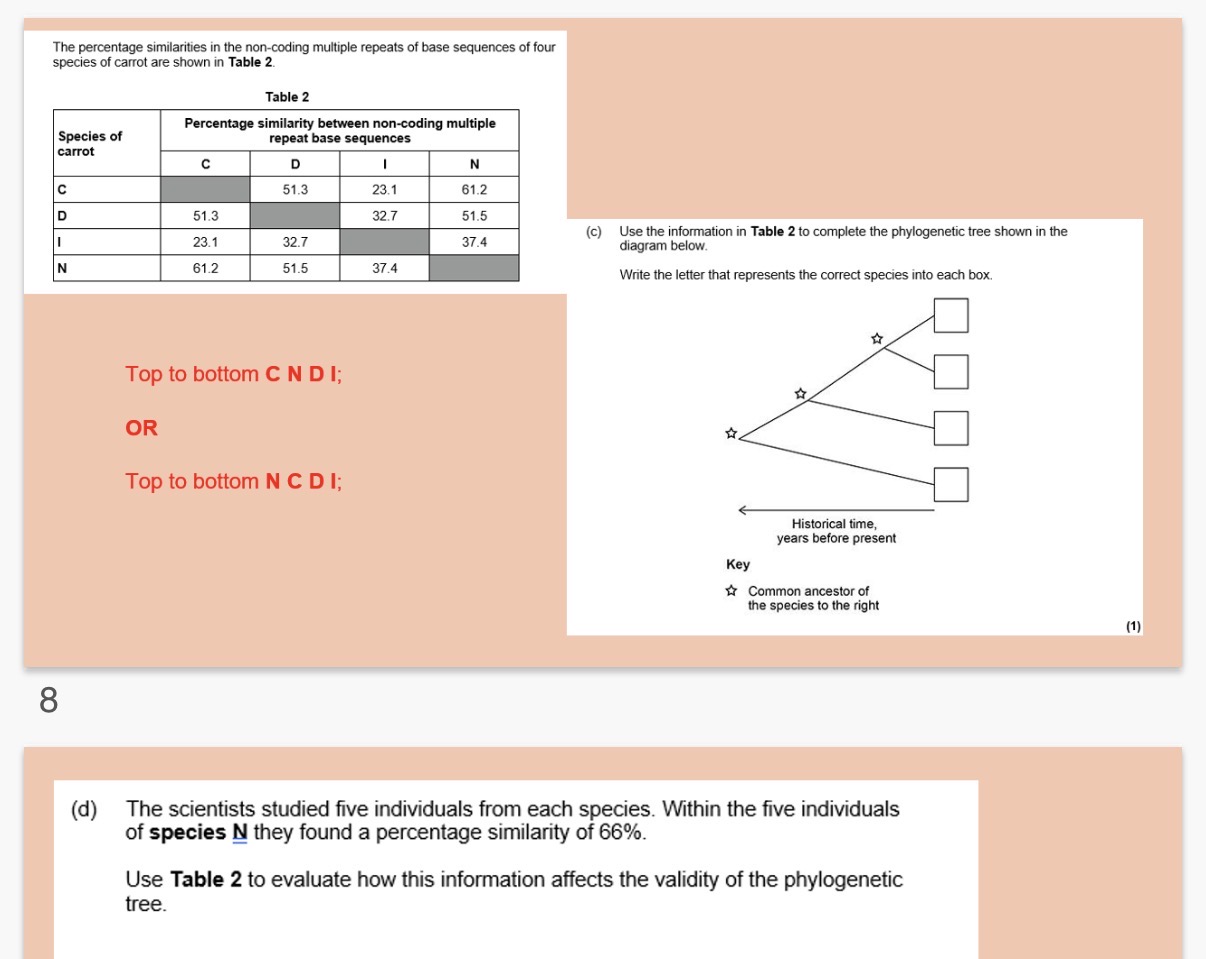
Model answer:The tree is somewhat valid because the 66% similarity within species N is higher than the 61.2% similarity between N and C. However, this validity is questioned because the intraspecific variation is high (66% is very close to 61.2%), and the sample size of only five individuals is too small to be representative.
mark scheme explained:
1. Support for the Tree (The 66% vs. 61.2%)
The mark scheme says it's "supported" because the similarity within the species (66%) is still higher than the similarity between species N and its closest relative, species C (61.2%).
• Logic: As long as members of the same species are more like each other than they are like another species, the tree’s branches stay separate and "valid."
2. Challenge to the Tree (High Intraspecific Variation)
This is where the validity takes a hit. The mark scheme points out that 66% is actually quite a low similarity for members of the same species.
• The Problem: The difference between being the "same" species (66%) and being "different" species (61.2%) is only 4.8%.
• Logic: If there is that much variation inside species N, the boundary between N and C is very fuzzy. It suggests that species N and C might not be distinct species at all, or that the genetic data isn't reliable enough to separate them clearly.
3. The Scientific "Safety Net" (Small Sample Size)
The mark scheme mentions the "small sample" of only five individuals.
• Logic: In biology, five individuals is a tiny group. This sample might not represent the whole species. If you tested 1,000 carrots, that 66% figure might change completely, making any conclusion drawn from this specific study less "valid" or reliable.