BOM125 Risk
1/85
There's no tags or description
Looks like no tags are added yet.
Name | Mastery | Learn | Test | Matching | Spaced | Call with Kai |
|---|
No analytics yet
Send a link to your students to track their progress
86 Terms
Define risk
Describe and shortly discuss the concept of risk
Combination of the frequency, or probability, of occurrence and the consequence of a specified hazardous event
A vast number of definitions can be found. They differ depending on if they are based on an engineering or socio-scientific perspective and if the considered risk is related to human health problems, environment problems or purely technical problems.
Sometimes risk is used as a synonym for the probability of an undesired event occurring. However, a common description of risk is that it is a combination of the probability and the consequence of an undesired event.
The question “What is risk?” can be described as comprising the following three questions: (1) What can happen? (Describe scenarios where something goes wrong); (2) How likely is it? (probability/frequency); and (3) What are the consequences? (damages)
Consumer surplus and producer surplus
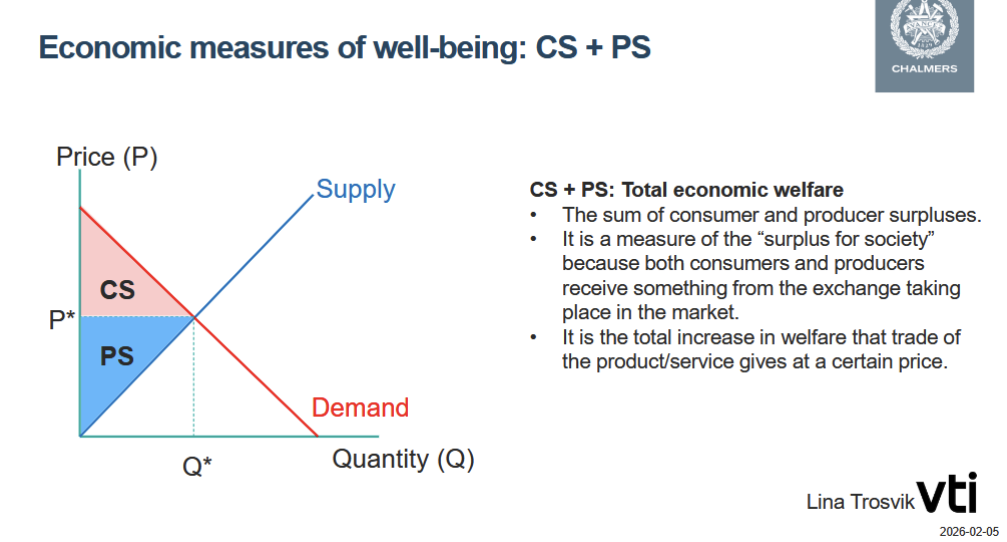
What is wellfare economic and how does a CBA rely on it?
…welfare economics to express costs (negative effects) and benefits (positive
effects) of a project/measure in monetary units.
Welfare economics…
…helps to allocate scarce resources in a way that provides the greatest welfare
to society,
…upscales microeconomic techniques to the aggregate society-wide level of
well-being (welfare),
…studies how markets work and how different actors (consumers and
producers) act and interact.
Utilitarianism
Give two different measures of the central tendency of a sample
Mean, median
What are the three factors the social discount rate depends on?
These are: time preferences, the marginal benefit of consumption and the per capita growth in consumption.
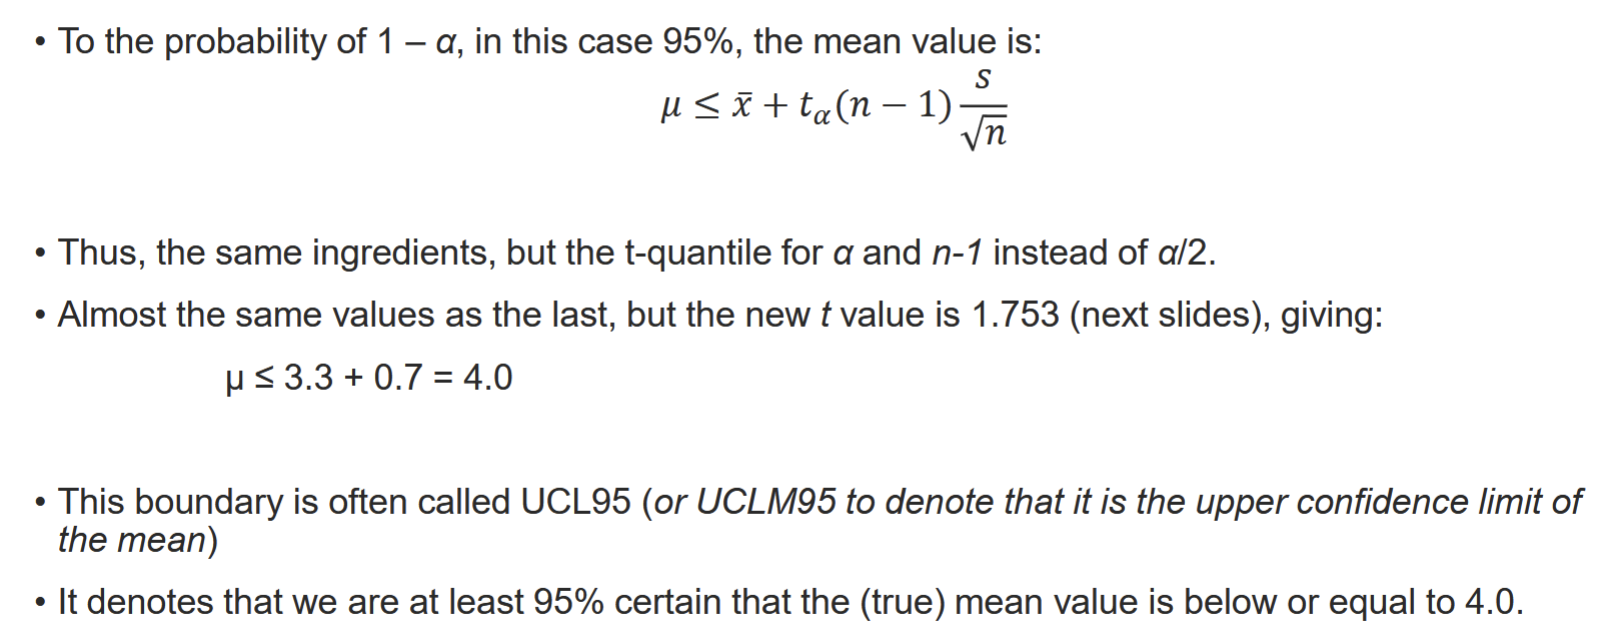
Explain UCL95. What does it mean?
There is a 5% probability that the mean value for a measured variable is above this limit if we repeat the sampling over and over again.
Explain type 1 and type 2 errors in the context of hypothesis testing. If easier, you can use an example.
When we perform a hypothesis test, we put up a null hypothesis, for example that the mean value is higher or equal to a critical value. The type 1 error is then defined as the error we make when we reject a true null hypothesis and the type 2 error is the error we make if we do not reject a false null hypothesis.
In order to be safe rather than sorry, the null hypothesis is typically formulated such that we can control the error we are most afraid of doing!
Explain what the 95th percentile indicates
Only 5% of the observations fall above this value (for a sample).
Theoretical model: only 5% of all values of a variable fall above this value.
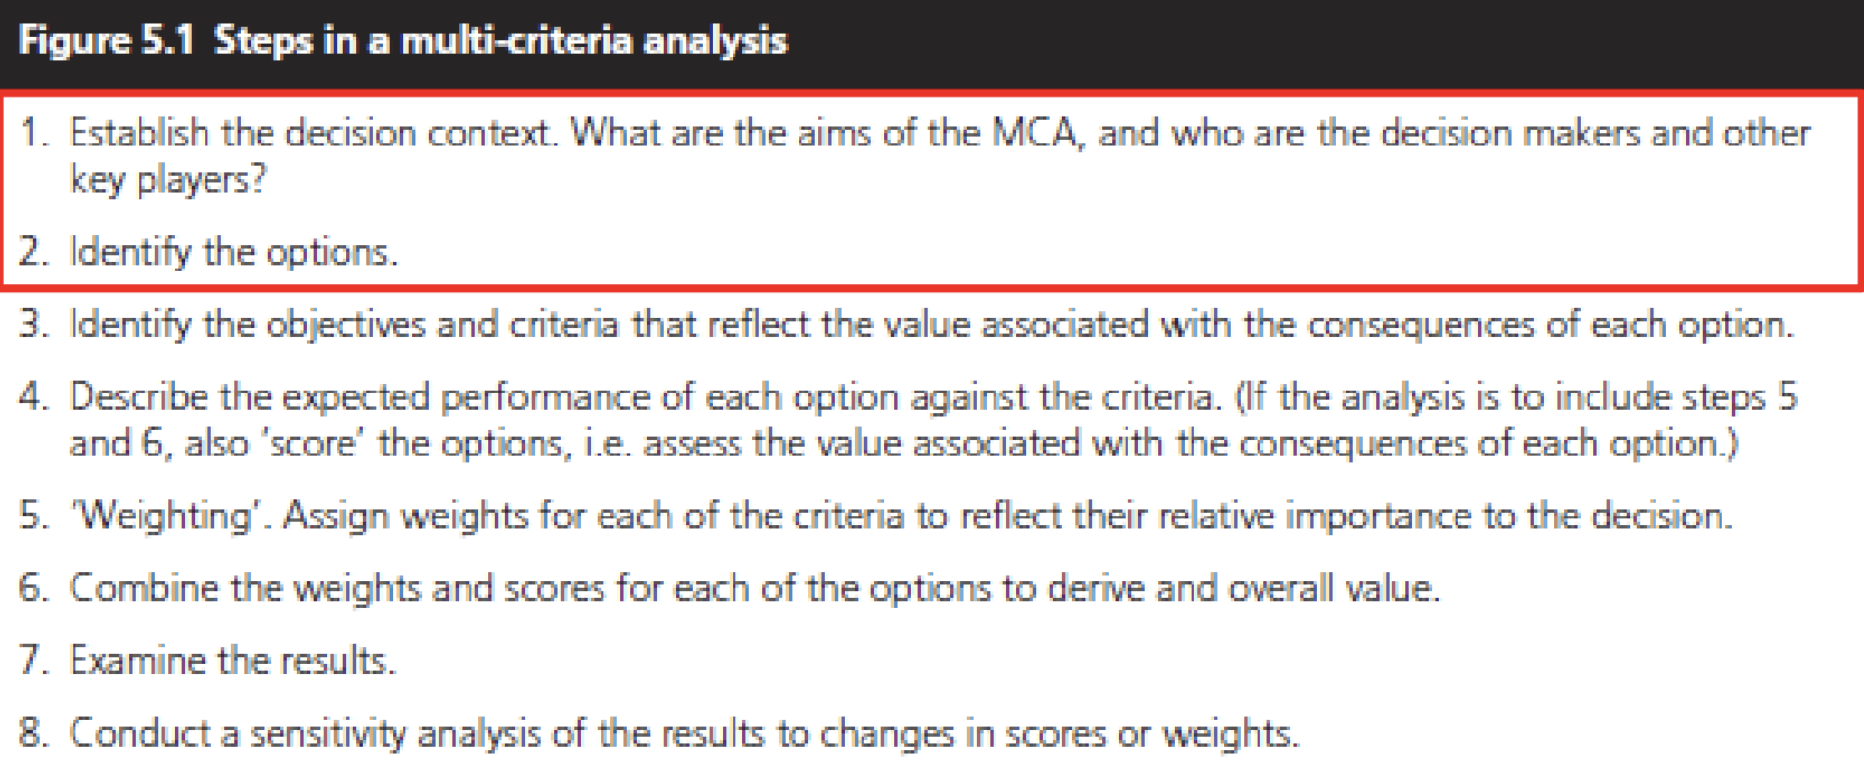
Describe how you can perform sensitivity analyses of a multi-criteria analysis in at least two different ways.
For parameter sensitivity it is possible to assign uncertainties on the scores and perform Monte Carlo analysis to find out how the different input parameters affect the result. This is in theory also possible for weights, but for investigating the impacts of different weighting, it is also possible to use scenario analysis, or what if analysis (i.e. how does the ranking change when the weighting change?).
The model uncertainty can also be investigated by scenario analysis (e.g. test different model structures).
What are different types of instrumental values for nature in a CBA?
Types of instrumental values of nature are use values, non-use values and option values.
Use: Direct use - Timer, Indirect use - Bees, ekosystemtjänster
Non-use: Existence - Polar bear, Altruism - For children
What does a positive externality mean?
A positive externality in a CBA is a benefit accrued to the third parties in result of the undertaken project/measure.
Risk ranking using risk matrices is a common method used in many risk assessment applications.
Give three examples of key aspects that are important in order to reach a correct and useful result (explain why these aspects are important).
- Clearly describe the identified hazards/risks to be assessed (typically as scenarios). If this is not done it will be hard to assess, for example, probabilities and consequences. This also provides transparency so that other people can understand what has been assessed.
- Describe and adapt the probability and consequence (or other parameters) categories to the specific application. Hence, the scale should be applicable to the specific problem, and it should be clear what the difference is between the different categories. The latter makes it possible for different people to makes the same assessment, and if the same input information is used the result may be the same.
- Consider how to categorise the final risk levels (i.e. the different combinations of probability and consequence) in e.g. unacceptable and acceptable or low, medium and high, etc. Categorisation should reflect the actual risk they pose.
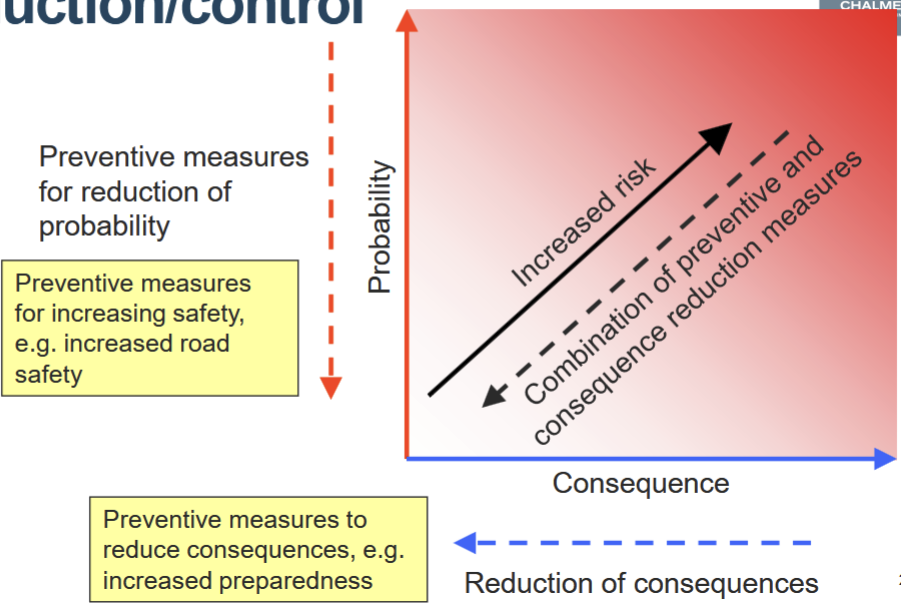
Risk is commonly described as a combination of the probability and consequences of undesired events. How can different risk reduction measures be described and categorized based on this definition (give one examples per category)?
Risk reduction measures can be described as reducing the (1) probability (preventive, e.g. increased road safety reducing the probability of an accident happening), (2) consequence (e.g. an alternative water source to be used in case the regular one is contaminated), or (3) both (e.g. increased road safety in combination with collection system to make sure a possible discharged does not spread)
What is compensatory / non-compenstatory methods when it comes to MCDA?
Compensation: high performance in one category can compensate poor performance in another category
• Compensation can be seen as a manifestation of a ‘weak sustainability’ perspective in which the decision-maker is willing to compensate e.g. a poor performance in the ecological domain with e.g. a high economic gain.
• It is important to choose a method that reflects the decision-maker’s values and to clarify the trade-offs
• The linear additive model, which you will use in the exercise, is fully compensatory
How can stakeholders be involved in a MCDA
Some applications attempt to represent the value judgement of one single decision-maker
– stakeholder values are then considered as an attribute in the model
But…
• MCDA can also be used as a framework that permits stakeholders
to structure their views about the pros and cons of different
options.
– As a learning process
– Consensus building
– Better understanding of stakeholders’ views
• Done typically by means of workshops (or individual
interviews/surveys)
MDCA: Step 3: identifying objectives and criteria
• Identifying criteria
• Grouping criteria – building a hierarchy
• Assessment of criteria
– Completeness – are all relevant criteria included?
– Redundancy – are there criteria which are unnecessary?
– Operationality – can the criteria be assessed for each option?
– Mutual independence of preferences – can you assign preference
scores for the options on one criterion without knowing what the
options’ preference scores are on any other criterion?
– Double counting – do we assess the same effects in more than
one criterion?
– Size – the structure should not be larger than what is useful!
– Impacts occurring over time – how are such handled?
MCDA: 5. Weighting
• Swing weighting
– Swing weighting not only relates to how important a specific
criterion is but also how much the relative difference
between the best and the worst option matters. Can be
better for clarifying trade offs. Important to take into
consideration if you use a local scale!
• Importance weighting:
– Importance weighting relates only to the
relative importance criteria and can be
used in combination with a global scale.
Easy way of assigning weights!
MCDA: Step 4. Scoring
To establish a scale: define 2 reference points (sometimes minimum, or least preferred, and maximum, or most preferred – if local scale)
• Decide whether to have a local scale or a global scale
– Local scale relates only to the options included
– Global scale relates to all possible options
• Establish scores for each option,
possible by using different methods:
– Value function
– Direct rating
– Pairwise assessment (AHP)
Steps in an MCDA
What is CBA?
• Performed on the societal level
• Purpose: to estimate changes in public welfare in terms of money
• Basic criterion: Is the sum of all benefits for all companies and individuals larger than the sum of all
costs for all companies and individuals?
• Analysis of distributional effects necessary
• Why CBA?
• In the interest of society to perform efficient measures
• Limited resources, i.e. we need to prioritize
• A common language is a key for efficient solution when several interested parties involved into decision-making
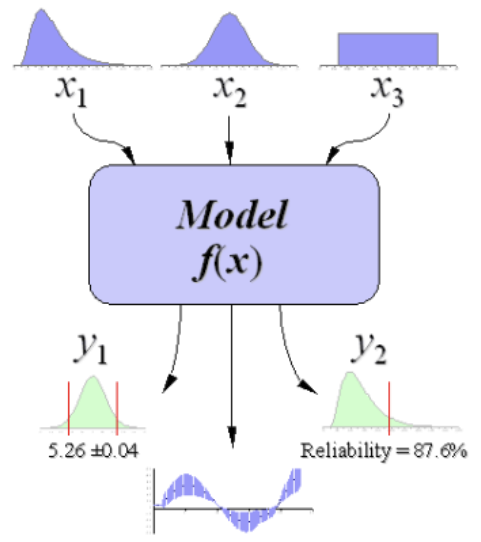
Explain the basic principles of Monte Carlo simulation, including how the results can be used.
Monte Carlo simulations are a numerical method based on random sampling from uncertainty distributions (probability density functions) defined for input variables
Calculations are performed a large number of times (iterations) to provide, for example, histograms illustrating uncertainties in results.
Uncertainty analysis is possible since results are presented including uncertainties, such as percentile values, standard deviation etc.
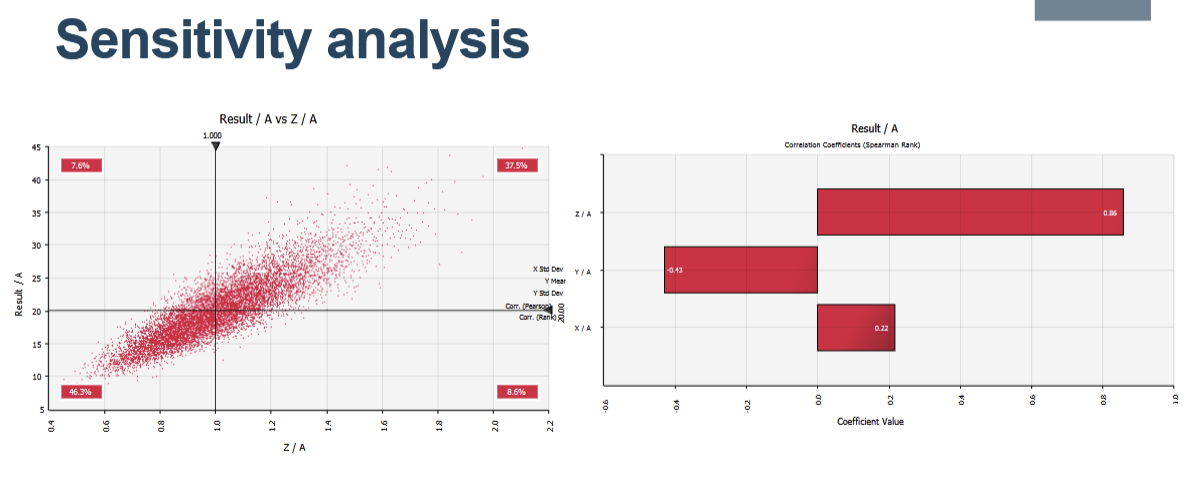
To perform a sensitivity analysis, i.e. determine how the different input variables affect the uncertainties in the result, rank correlation coefficients and scatter plots can be produced based on the Monte Carlo simulation results and used.
What does model uncertainty versus parameter uncertainty refer to, and how can this type of uncertainty influence the outcomes of risk assessments and decision analyses?
Model uncertainty relates to how well models created represent the real world. For example, does the model used in your project to calculate the probability of an accident with hazardous goods consider the relevant variables/aspects? An incorrect model may provide inaccurate results, which in the end may provide misleading decision support.
Parameter uncertainty is due to incomplete knowledge of parameters or inputs of a model. For example, what is the true consequence cost, probability of an alarm working properly, the retention time being shorter than 30 days, etc. For parts of the input data to your risk models you used uncertainty distributions but point values were used for some. The point values can also be associate with uncertainties, even if you did not consider this in the Monte Carlo simulations.
Why is a uncertainty and sensitivity analysis needed?
• Uncertainties in the model inputs propagate through the model and result in uncertainty in the model output
• The uncertainty of a model input or a model output is characterized by a probability distribution
• Uncertainty analysis refers to the determination of the uncertainty in the model result
• Sensitivity analysis refers to the determination of the contributions of the individual inputs to the uncertainty of the model result
- Testing the robustness of the results of a model or system in the presence of uncertainty.
Sensitivity:
- Increased understanding of the relationships between input and output variables in a system or model.
- Uncertainty reduction: identifying model inputs that cause significant uncertainty in the output and should therefore be the focus of attention if the robustness is to be increased.
- Search for errors in the model (by encountering unexpected relationships between inputs and outputs).
- Model simplification – fixing model inputs that have no effect on the output or identifying and removing redundant parts of the model structure.
- Enhancing communication from modelers to decision makers (e.g. by making recommendations more credible, understandable, compelling or persuasive).
- Finding regions in the space of input factors for which the model output is either maximum or minimum or meets some optimum criterion.
Why is a sensitivity analysis needed?
• Testing the robustness of the results of a model or system in the presence of uncertainty.
• Increased understanding of the relationships between input and output variables in a system or model.
• Uncertainty reduction: identifying model inputs that cause significant uncertainty in the output and should therefore be the focus of attention if the robustness is to be increased.
• Searching for errors in the model (by encountering unexpected relationships between inputs and outputs)
• Model simplification – fixing model inputs that have no effect on the output or identifying and removing redundant parts of the model structure.
• Enhancing communication from modelers to decision makers (eg. by making recommendations more credible, understandable, compelling or persuasive).
• Finding regions in the space of input factors for which the model output is either maximum or minimum or meets some optimum criterion.
Main components of a decision model
• Decision options (alternative actions)
• Relevant consequences (outcomes)
• Probabilities (if the analysis is probabilistic)
• Decision criteria (the aims of the decision-maker)
Spearman Rank Correlation Coefficient
• (r s) is a non-parametric measure of correlation (-1 to 1)
• This procedure makes use of the two sets of ranks that may be assigned to the sample values of X and Y
• A Spearman correlation of 1 results when two variables being compared are monotonically related, even if their relationship is not linear.
What is the difference between uncertainty and sensitivity analysis?
Uncertainty analysis
• Uncertainties in the results
• Percentiles (P05, P95, etc.)
• Probability of e.g. exceeding (or not exceeding) specific targets
Sensitivity analysis
Tests how related parameters are to the outcome
Define Hazard
Source of potential harm or a situation with a potential of harm
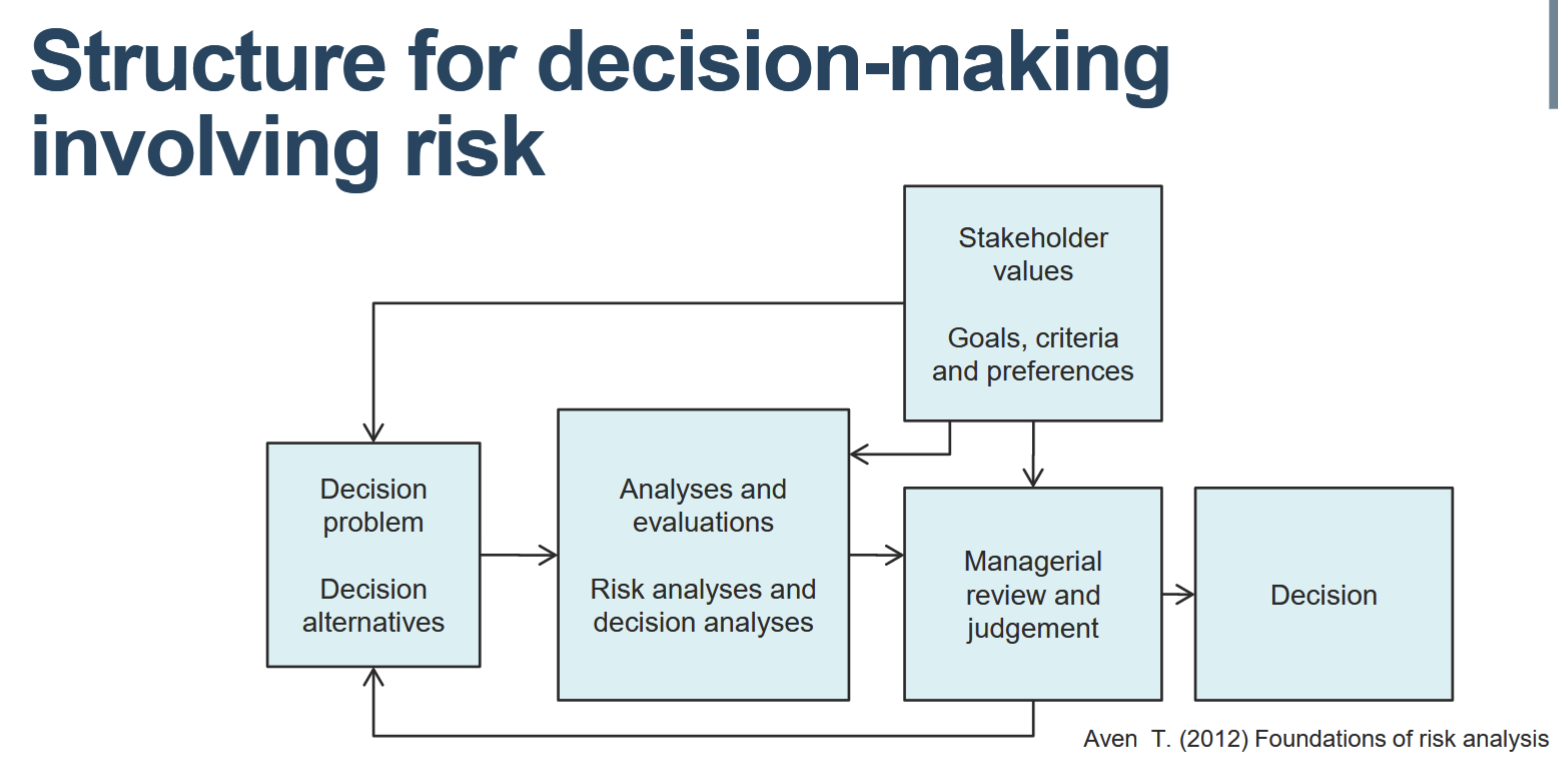
Structure for decision-making involving risk
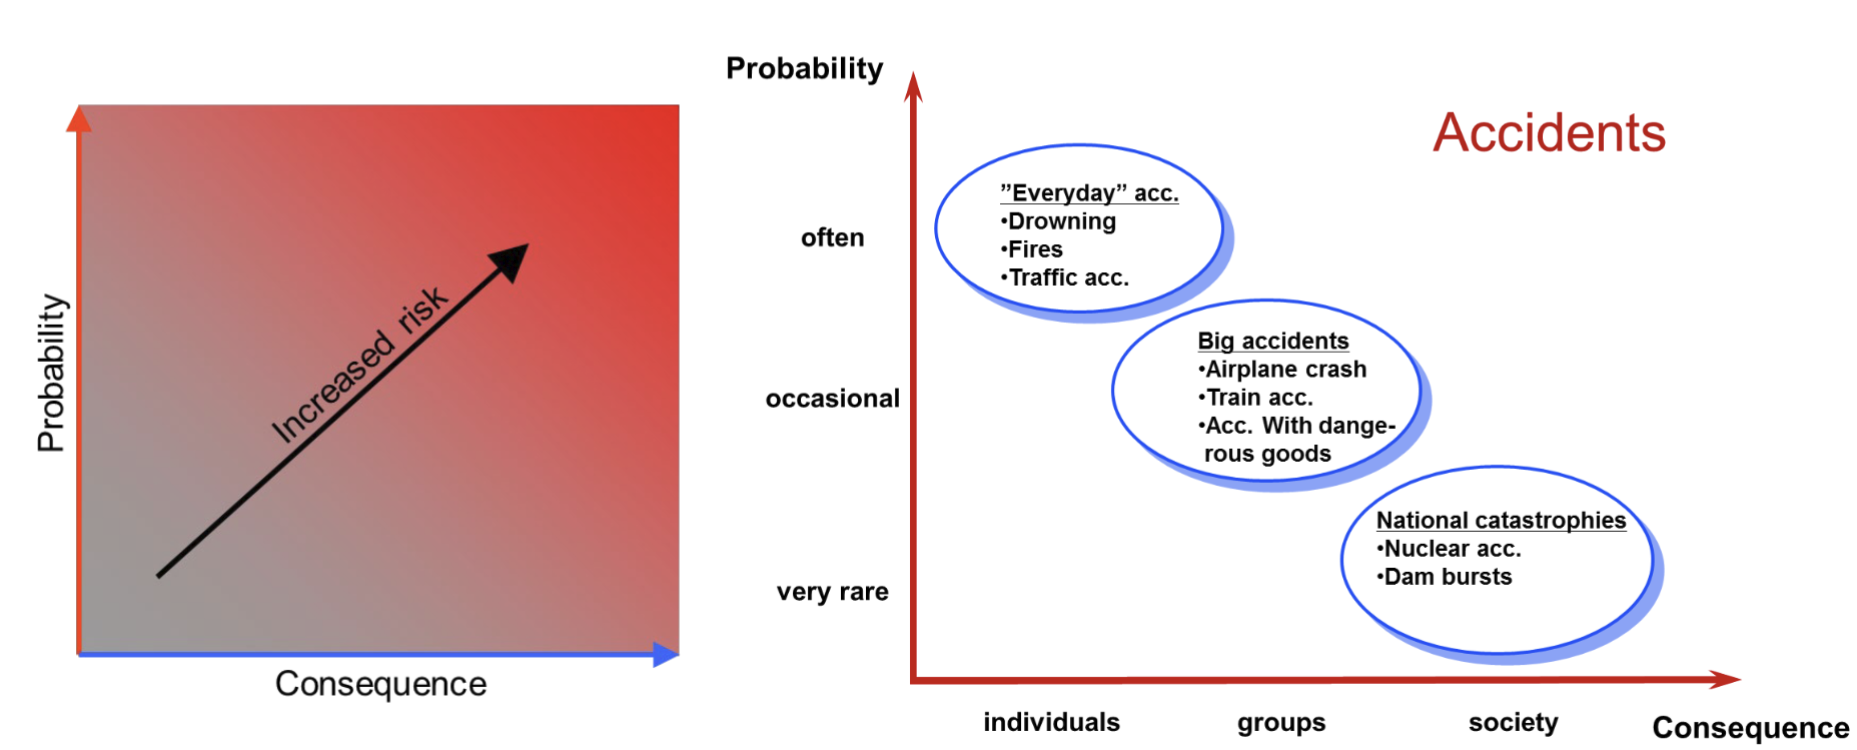
Risk “square”
Probability
Understanding statements about probability is complicated!
• Probability has two dimensions:
Statistical frequency
• Known long-term probability (within some confidence limits)
• E.g. throw of a dice, data reporting on reliability of components
Degree of belief (Bayesian)
• Probability is unknown (or not possible to know)
• For example, ”I believe it will rain tomorrow”, ”I believe the train to Stockholm will arrive on time”
• Follows the rules of probability
• Updating as new information becomes available
Definitions in probability: Chance, Belief, Tendency, Confidence
Probability word
• Chance: the frequency of a given outcome, among all possible outcomes of a random process, or within a given time frame.
• Belief: the degree to which a proposition is judged to be true, often reported on an interval (0,1) or %-scale creating an analogy with ’chance’.
• Tendency: the physical properties of a system that result in stable long-run frequencies with repeated trials.
• Confidence: the degree to which we are sure that an estimate lies with in some distance of the true value.
Give examples of consequences in practice (3 types)
Human:
• Disease and disability, e.g. disability adjusted life years (DALY)
• Mortality
• Service, e.g. costumer minutes lost (CML)
Ecological
• Number of affected individuals, e.g. lethal threshold concentration (LCxx)
• Genetic variability within and between populations
• Functionality of organisms
Economic
• Damage to properties
• Delays
• Loss of production
• Liability costs – fines
Factors influencing risk perception
Factors affecting risk perception:
• Catastrophic potential
• Familiarity
• Uncertainty
• Individual or societal
• Controllability
• Voluntariness
• Risk averse – when people prefer to have smaller
reward with greater certainty than a larger reward with
less certainty (Burgman, 2005)
• Risk seeker
• Risk neutral
What is individual risk and societal risk?
Individual risk
• The risk of a randomly selected individual to be adversely affected (e.g. dying or being severely injured).
• The goal is to assure that individuals are not exposed to intolerable risk levels.
• Examples: drinking water quality standards, exposure on contaminated sites
Societal risk
• The individual risk does not provide information about the total risk to society
• Societal risk is commonly expressed as the expected number of fatalities resulting from e.g.accidents or epidemiological outbreaks
Examples of building project risks
Unexpected delays
• Liability
• Worker accidents
• Accidents to third party
• Political risks
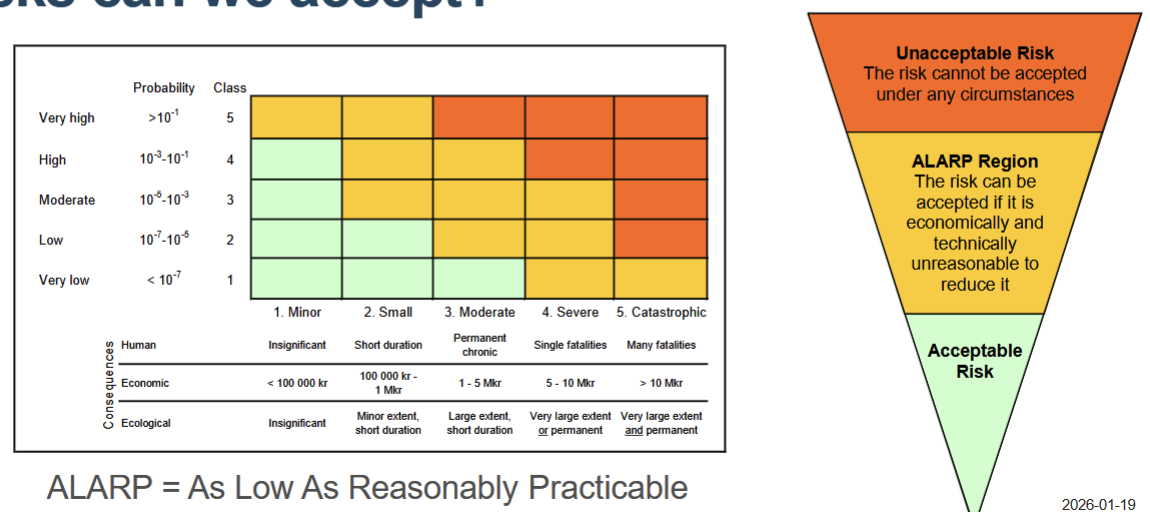
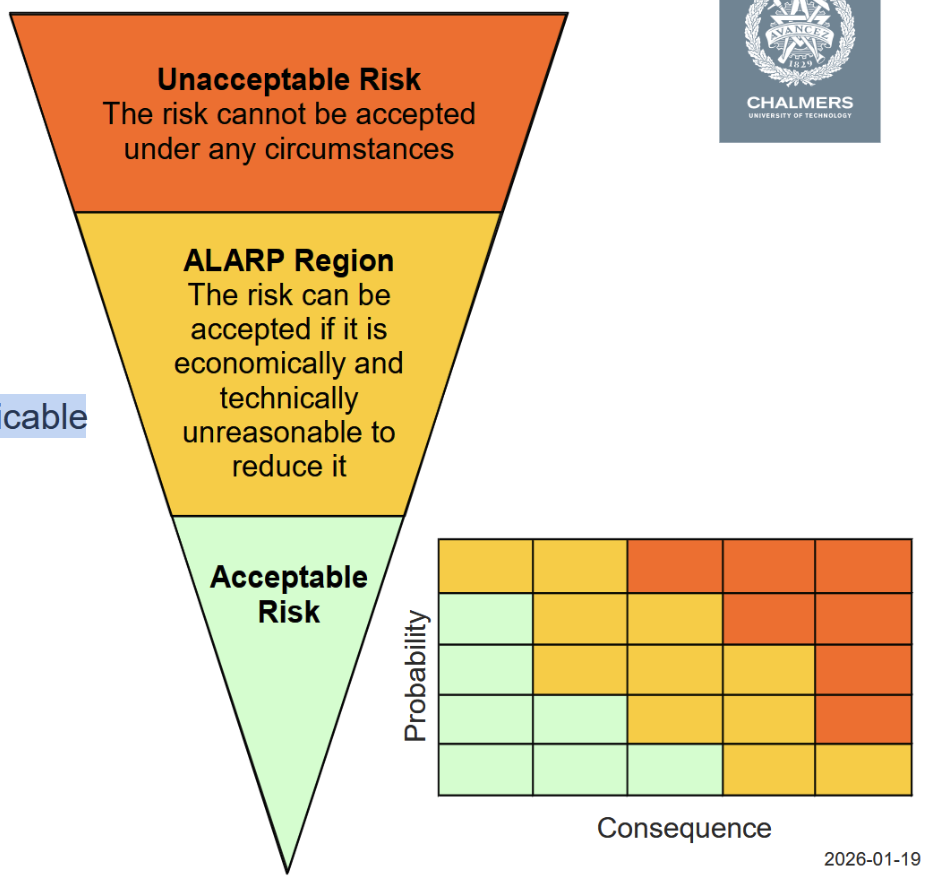
ALARP - What is it? How is it used?
According to ALARP, risks that are clearly unacceptable must be reduced or eliminated under any circumstances.
Risks that are clearly acceptable can be left without further actions (or only monitored).
In between the acceptable and unacceptable risks, there are risks that may be accepted if it is economically and/or technically unreasonable to reduce them.
Risk reduction/control
What do we mean by risk management?
The process of identifying the problem, analysing and in the end taking suitable actions
• Iterative process, continuous update of models and estimates (e.g. based on monitoring data)
• No strict boundaries between the steps in risk management
• Terminology may differ
• Different methods and tools can be applied
Why is risk management needed?
Control, prevent or reduce loss of life, illness, injury, damage to property and consequential loss, and environmental impact
• Preventive rather than reactive
• Facilitate rational decision-making
• Distinguish greater risk from lesser ones
• Provide transparency
• Protect us and create opportunities
• Increase awareness and knowledge regarding risk issues
• Support risk communication
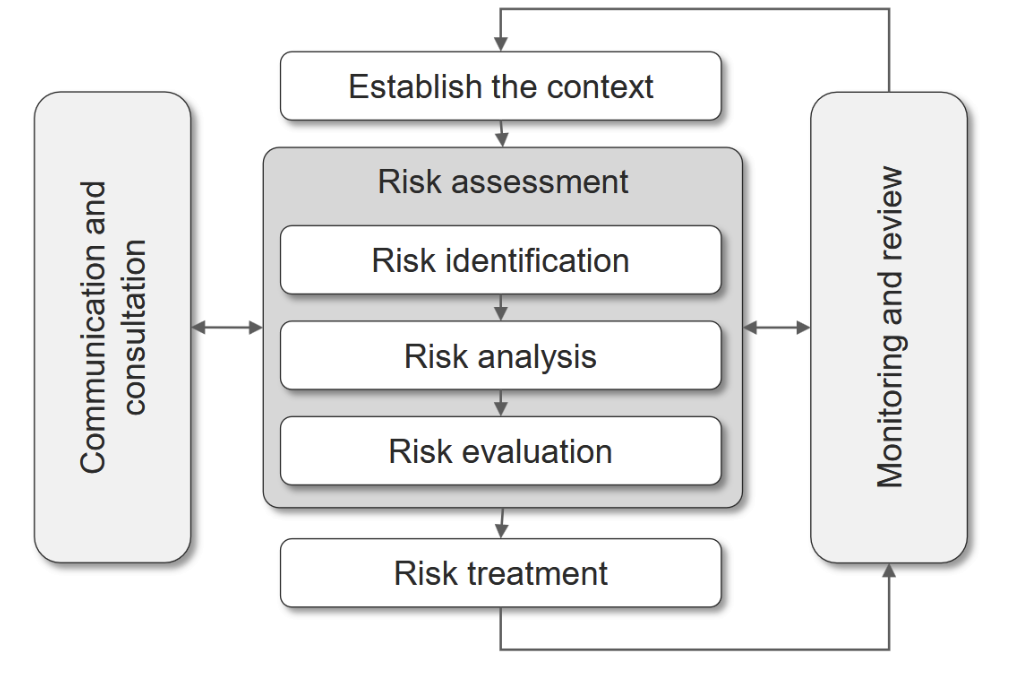
The risk management process and short description of each step
1. Risk assessment – Joint term for steps 2-4 below
2. Risk identification (or hazard identification) – Identify hazards (i.e.) sources of risk relevant to the analysed system
3. Risk analysis – Determine the risk level(s) based on e.g. probabilities and consequences
4. Risk evaluation – Determine if the risk is acceptable (or tolerable) or not and analyse possible measures
5. Risk treatment – Select and implement risk-reducing measure(s)
The risk management process: Problem definition (Context, scope definition)
• Define the purpose of risk asessment – Why?
Questions to answer
• What do we need to know?
Stakeholders - Who are thay?
Involve stakeholders
• Responsible stakeholder(s)
• How and what is affected by decisions?
• Type of risk assessment
• Limitations (social, scientific, time, money)
• Problem boundaries
The risk management process: Risk identification
Risk identification:
Hazard/risk identification involves the identification of risk sources, events (i.e., occurrence or change of a particular set of circumstances), their causes and their potential consequences.
• …attempts to form as complete a list as possible on potential hazards.
• …is based on a sound conceptual model.
Methods:
• Checklists and brainstorming
• Structured brainstorming
• Hazard matrix
Purpose:
The aim is to be able to use the results from hazard/risk identification to estimate the risk level as part of the risk analysis step.
The risk management process: Risk analysis
• Qualitative, e.g. checklists and classification of risk → relative ranking of risks
• Quantitative, e.g. causal and consequence models → quantitative comparison with established risk tolerability levels.
Purpose:
To describe the risk (qualitatively or quantitatively), typically by estimating probability and consequences of relevant scenarios/events identified in the previous step. The result is supposed to enable an evaluation of the risk level
The risk management process: Risk evaluation
Is the risk tolerable or not?
• Tolerability criteria
• ALARP – As Low As Reasonably Practicable
• Analyse risk-reduction options
• Decision criteria:
Cost-effectiveness
Cost-benefit
Sustainability
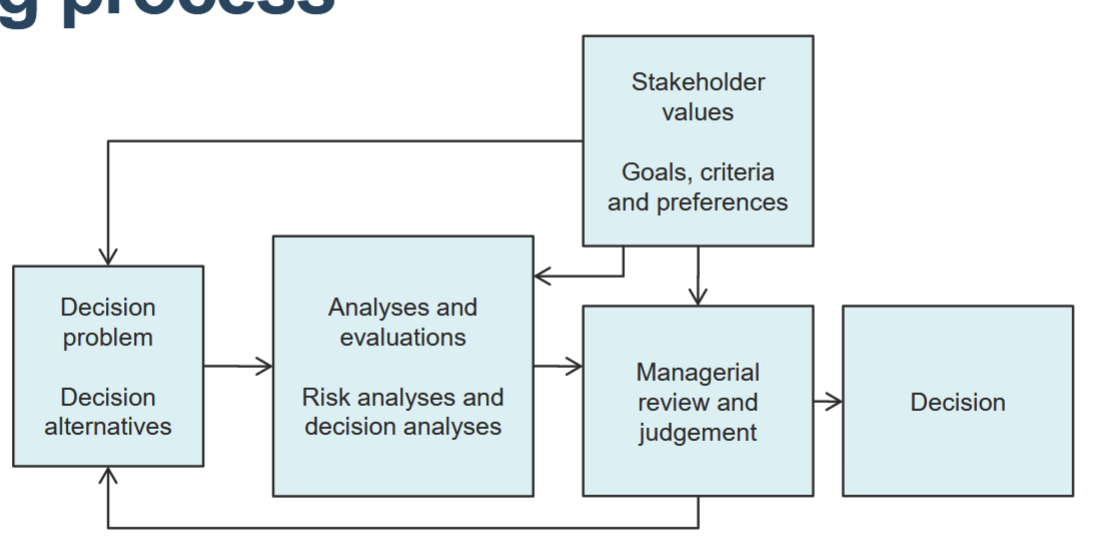
Basic structure of the decision-
making process
Why is the risk management process described as an iterative process?
Risk assessment should be updated when, for example, new information becomes available (from investigations and similar), preconditions change, and risk-reducing measures have been implemented
Describe MCDA
(mention advantages & limitations)
Structured method to compare and rank different decision alternatives with regard to an overall objective, where a number of criteria are used to determine how well this objective is met.
Criteria can sometimes be conflicting but should represent all aspects of the decision problem that is relevant for the decision-maker. Criteria can be measured in quantitative units (physical units or scores) or qualitative units (like plus signs or smileys).
The decision-maker can be a single person or can represent several different stakeholders. Each alternative is assessed with regard to its performance on the criteria. Weights can be used to assign some criteria as more important.
There are different methods for ranking alternatives. Two main categories are compensatory methods (bad performance on one criteria may be compensated for a good performance on another criteria in ranking) and non-compensatory. Examples of ranking methods are linear additive model, AHP, thresholds.
Advantage of MCDA is the possibility to include criteria which are measured in different units. Can be used as a way of investigating different options with regard to their weaknesses and potential improvement.
Limitation is that it can sometimes be very complex and work intensive to make a good analysis.
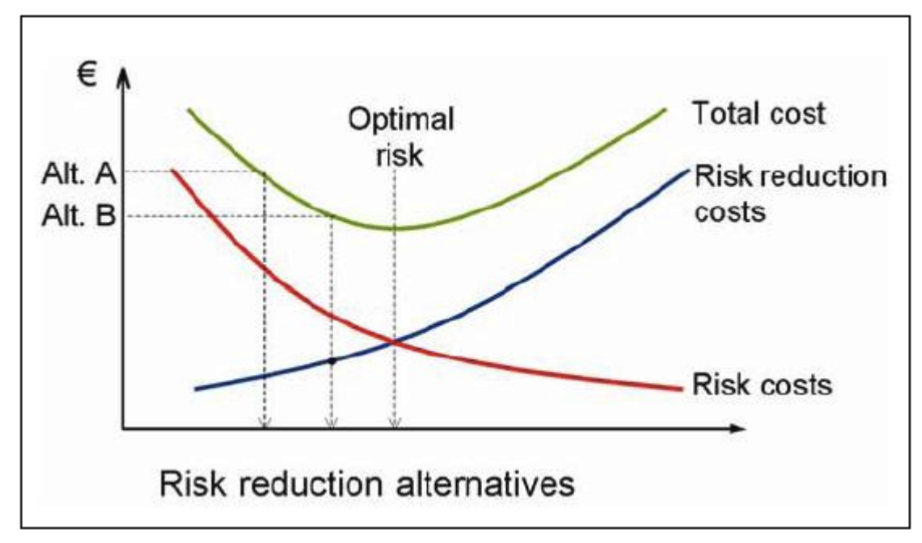
Conceptual economic model of risk
How can stakeholders be involved in an MCDA-process and how can their views be taken into consideration?
Be involved in identifying criteria, the weighting of criteria, and possibly also in the scoring of alternatives against criteria.
Views can be taken into consideration in the model itself by including the criteria found relevant by stakeholders, or by using their views as input for weighting of criteria.
Views can be collected by different means, e.g. interviews or questionnaires, workshops or discussion meetings.
Sometimes stakeholders’ opinions can be modelled as a criteria itself, e.g. “public acceptance”
You suggest using a CBA for evaluating profitability of alternative risk-reducing measures. One risk-reducing measure leads to the increased provision of ecosystem services at the industrial area upstream of the water supply. Explain the following:
Would you categorize the increased provision of ecosystem services at the industrial area upstream of the water supply as an internal or external effect of implementing this risk-reducing measure? Why?
The increased provision of ecosystem services is a positive external effect of implementing the risk-reducing measure to the third party, i.e. the positive externality.
It is important to include externalities in a CBA to estimate the profitability of the risk-reducing measure on the aggregate societal level.
Explain the basic principles and main steps in performing a fault tree analysis and what inputs are needed (not necessary to present and explain equations).
Give key steps.
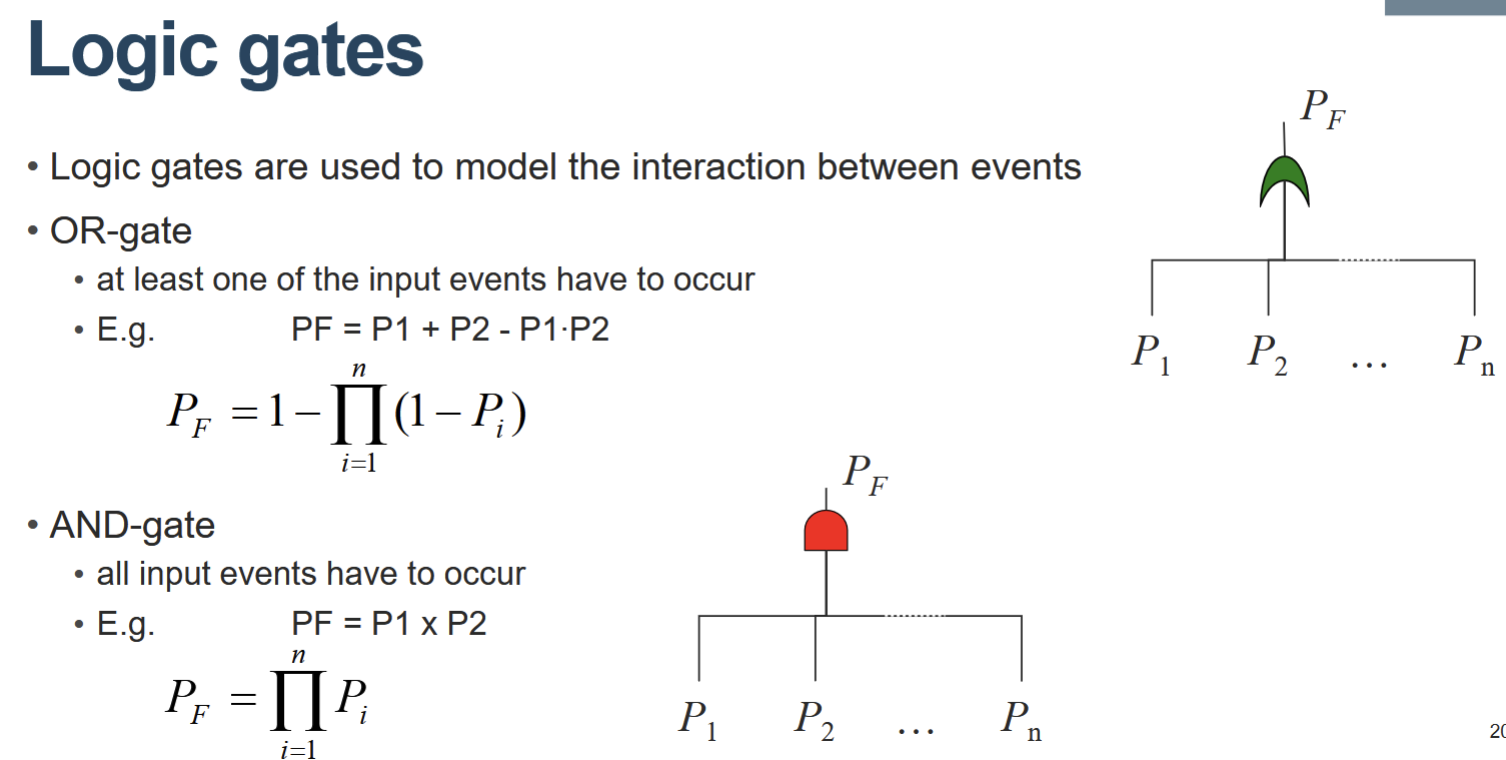
A fault tree is constructed to describe and model system failure based on the occurrence or non-occurrence of other events. Interaction between events is modelled using logic gates. Fault tree analysis aims to identify causes of and calculate the probability of system failure.
Key steps:
• Definition of the problem and the boundary conditions
• Construction of the fault tree (conceptual model, system description, hazard identification, interrelationships between a events)
• Input data in terms of probabilities for the basic event (hard data and/or expert judgements)
• Qualitative analysis of the fault tree
• Quantitative analysis of the fault tree
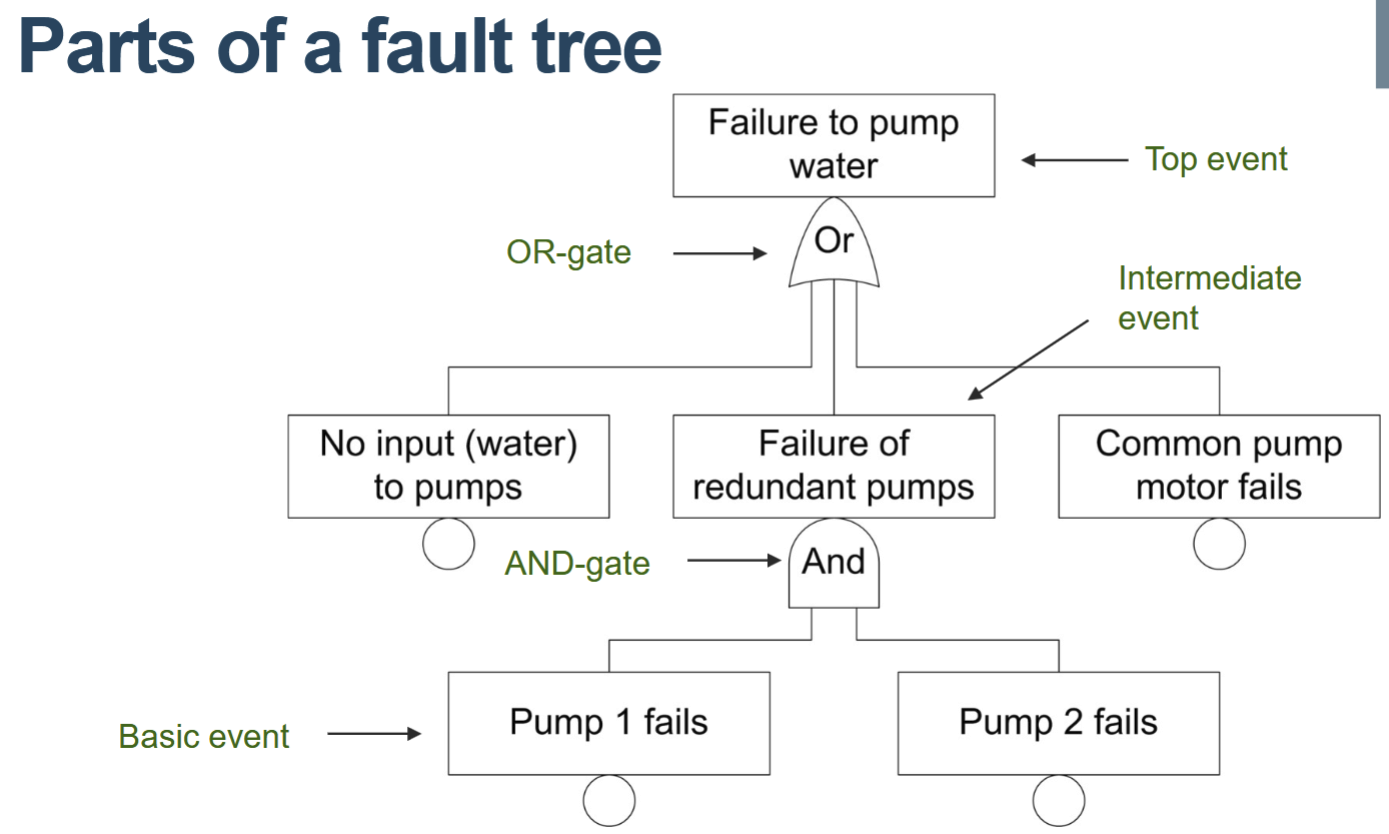
Explain the OR- and AND-gates and equations for calculating the output probabilities.
OR-gate:
− At least one of the input events has to occur
− Can be described as a series system
AND-gate:
− All input events have to occur
− Can be described as a parallel system
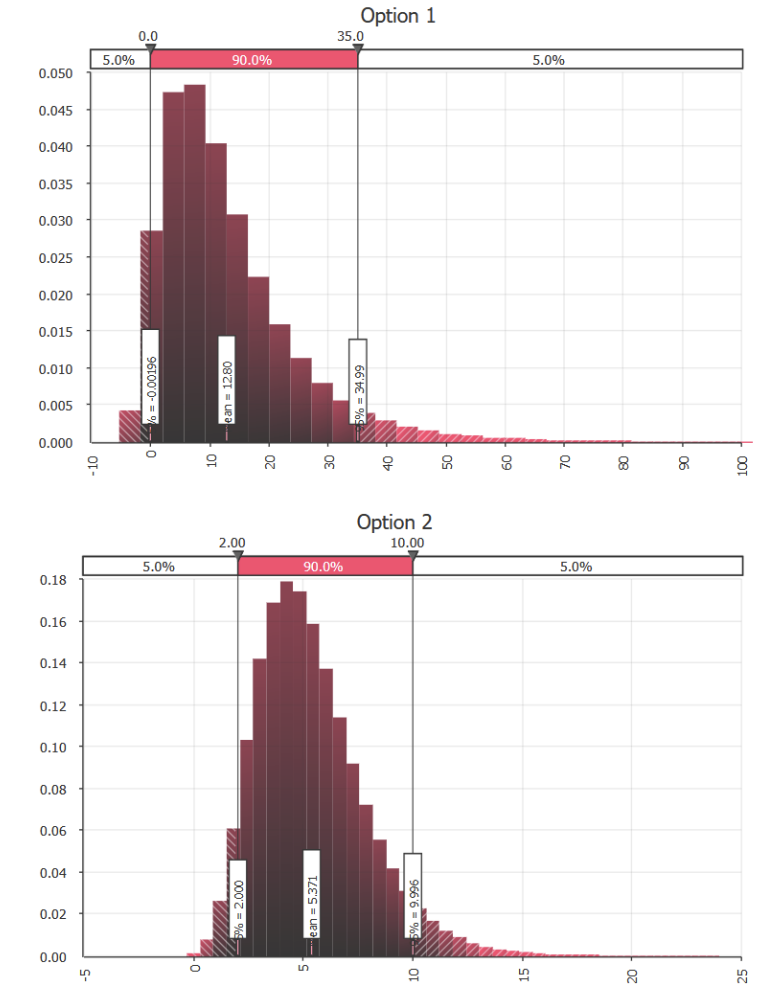
The results from an assessment of two possible risk reduction options are presented. The assessment has been made with respect to the economic consequences, and the result is presented as the expected economic benefit (MSEK) of each option.
Discuss the difference between the two options based on the histograms presented below (i.e., advantages and disadvantages of the two options with respect to uncertainties etc.)
Option 1 has a 5 % probability of being below 0, i.e. have a negative benefit. Option 1
is also related to greater uncertainties compared to alt. 2. However, option 1 may
result in a much greater benefit (Mean=12.8, P95=35 MSEK) compared to option 2
(Mean=5.7, P95=7 MSEK). Option 2 is likely to provide a lower benefit, but is not as
uncertain as option 2 and it is extremely unlikely the benefit will be <0
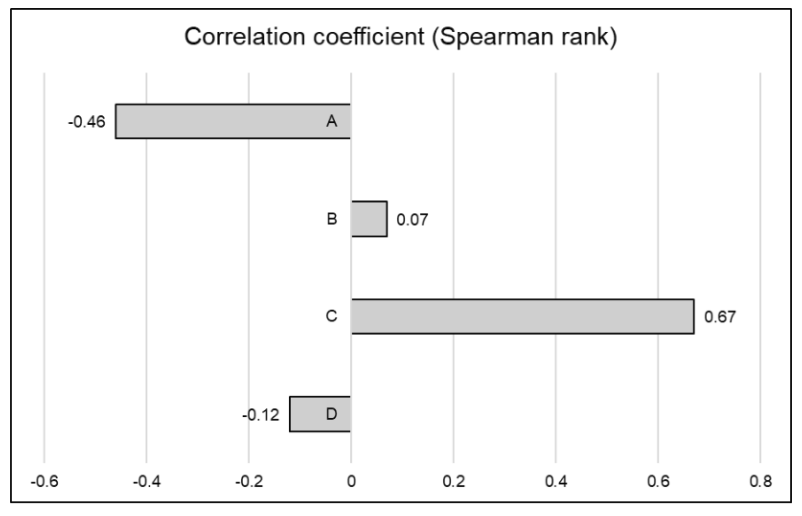
Explain what the presented correlation coefficient is a measure of and how the results should be interpreted and can be used.
The spearman rank coefficient measure of dependence between the rankings of two variables (value between -1 and 1).
The sign (+/-) shows the nature of the correlation. The value indicates strength.
An efficient way to prioritise additional studies is to focus on variables strongly correlated with the output result.
If additional data can be collected and uncertainties in input data reduced, this is an efficient manner to reduce uncertainties in the output results.
In this case most efficient to further analyze (1) variable C and (2) variable A.
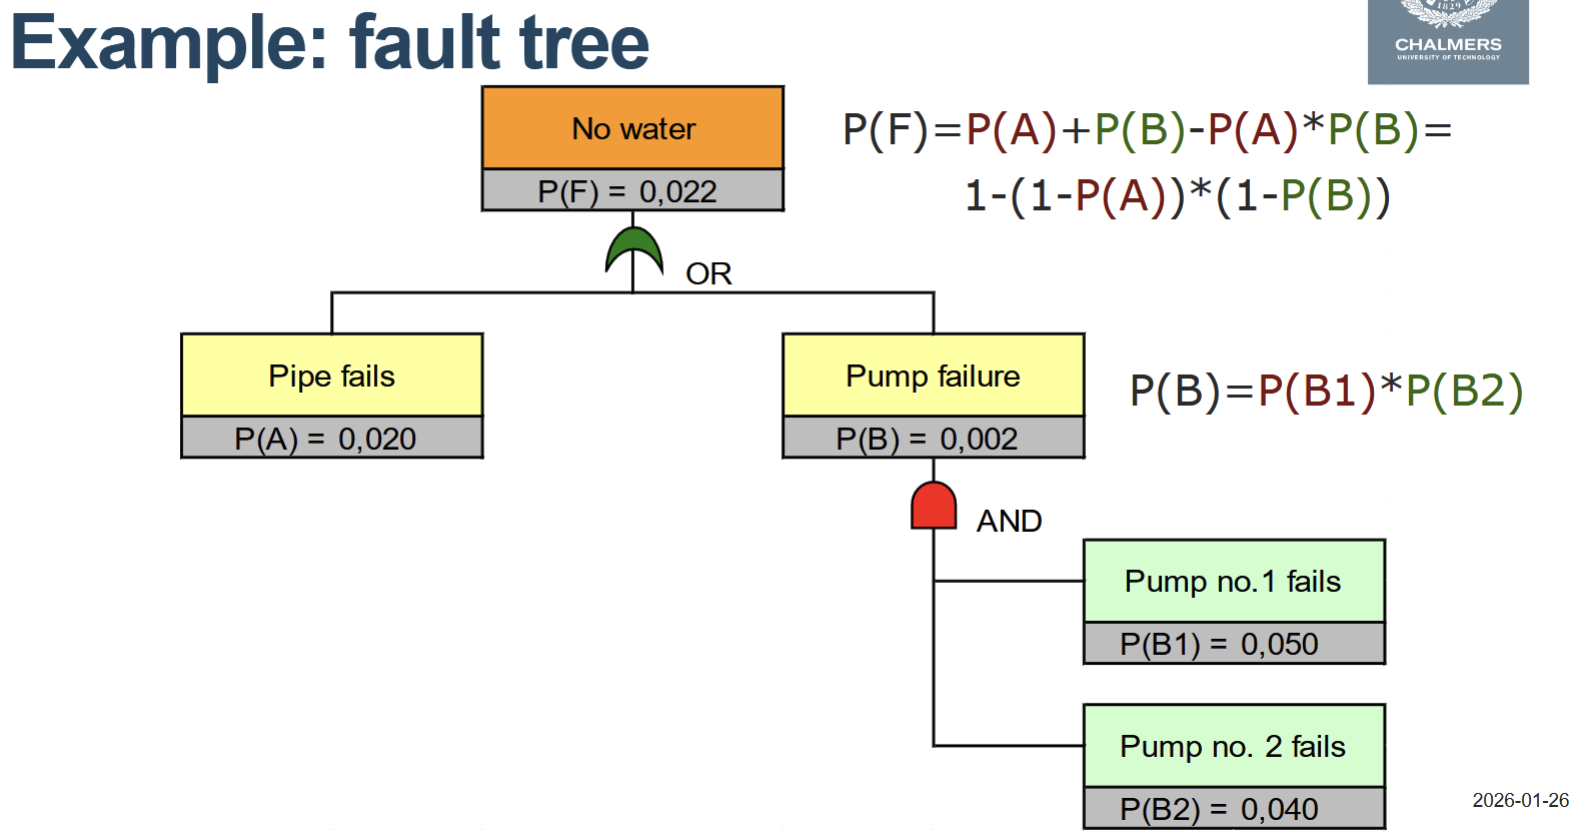
Equations for logic gates
Fault tree
For OR-gate with 3 values: P = 1 - ((1-P1)(1-P2)(1-P3))
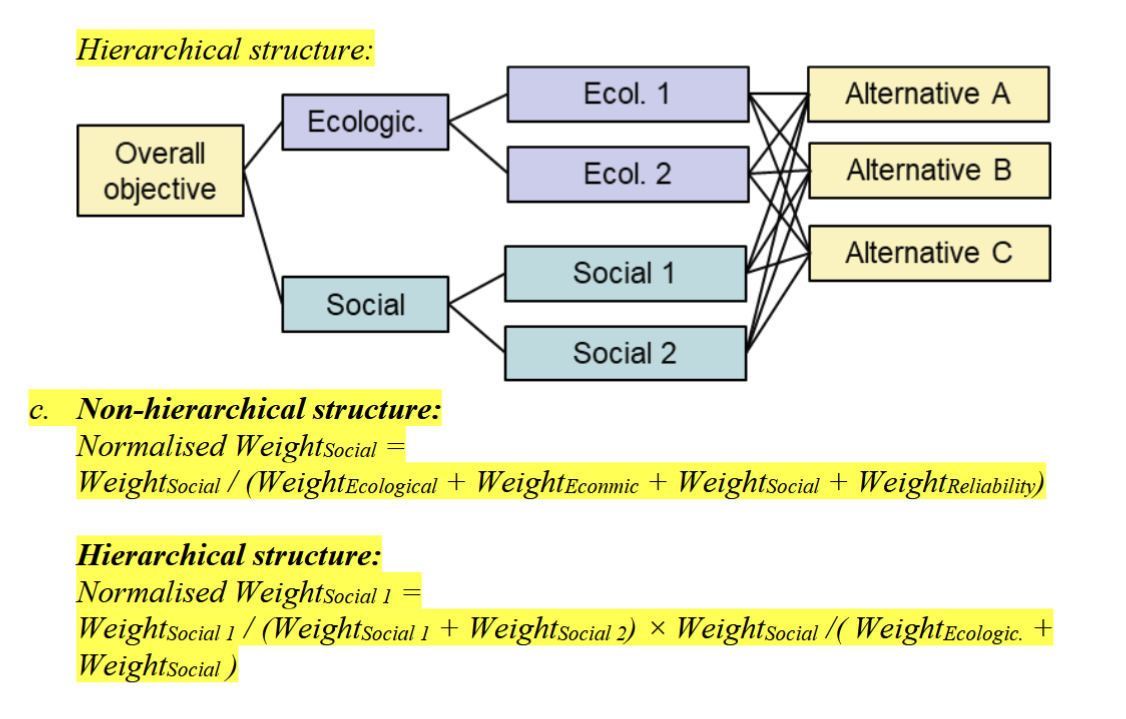
MCDA: Equations for final normalized weight for one of the criteria against which the decision alternatives are assessed.
Event tree analysis
• Event trees are used when analysing “what can this initial event lead to?” – it analyse possible outcomes following an initiating event
• Horizontal structure which proceed in time from left to right
• An event tree consists of
• Chance nodes – uncertain events
• Terminal nodes – outcomes
• Branches spread out from a chance node and represent possible events, each associated with a probability
Steps in performing a ETA
1. Identification of relevant initiating event
2. Identification of the safety functions that are designed to deal with initiating event.
3. Construction of event tree
4. Description of the resulting accident event sequences
5. Calculation of probabilities/frequencies for the identified consequences
6. Compilation and presentation of the results from the analysis
Variance and standard deviation
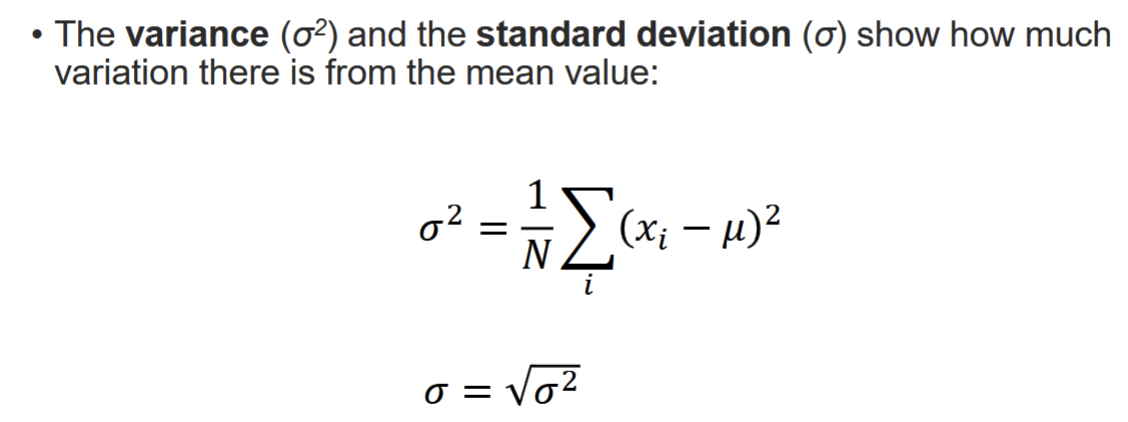
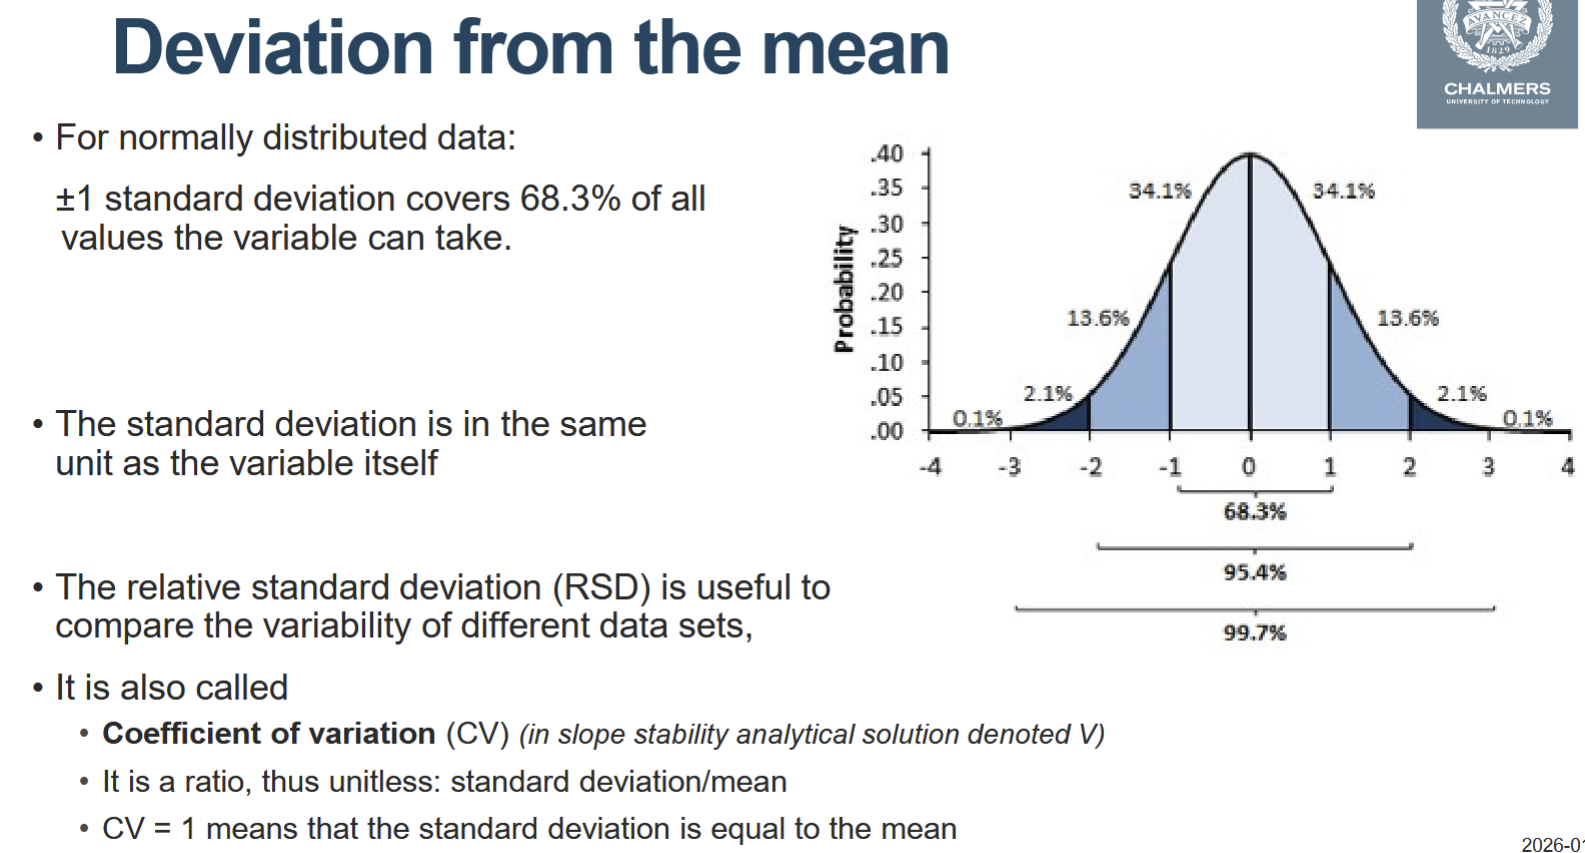
Coefficient of variation
• It is a ratio, thus unitless: standard deviation/mean
• CV = 1 means that the standard deviation is equal to the mean
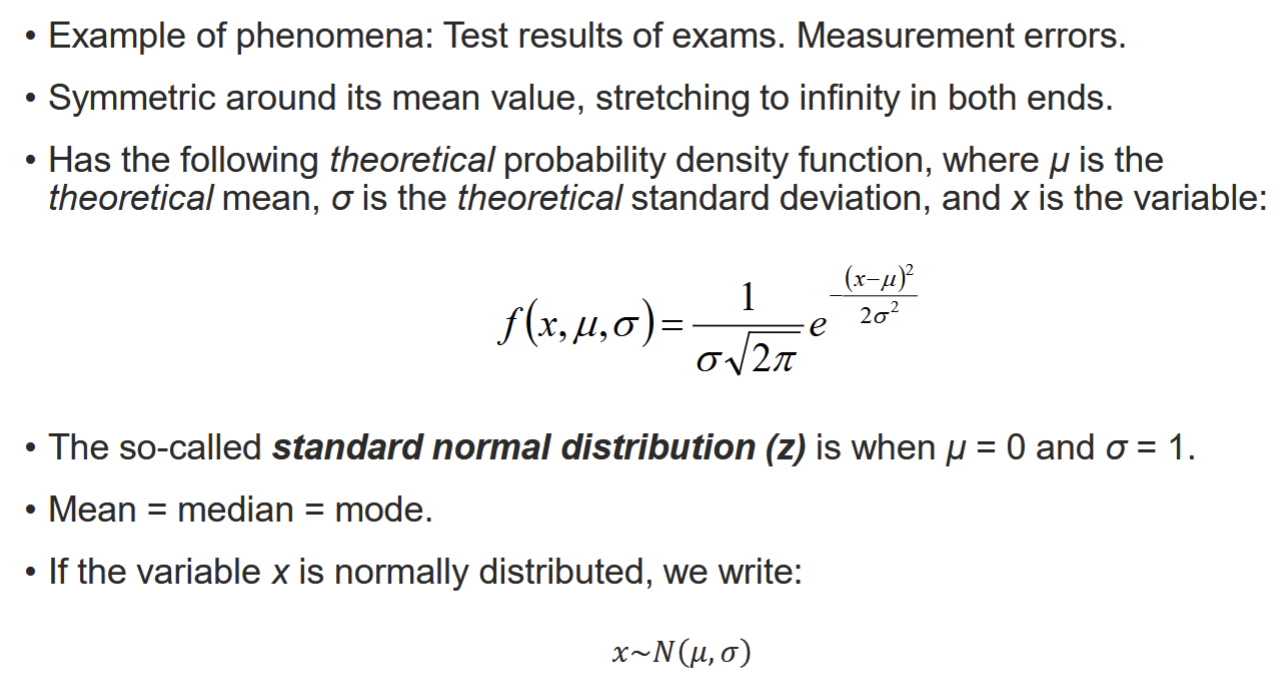
Normal distribution equation
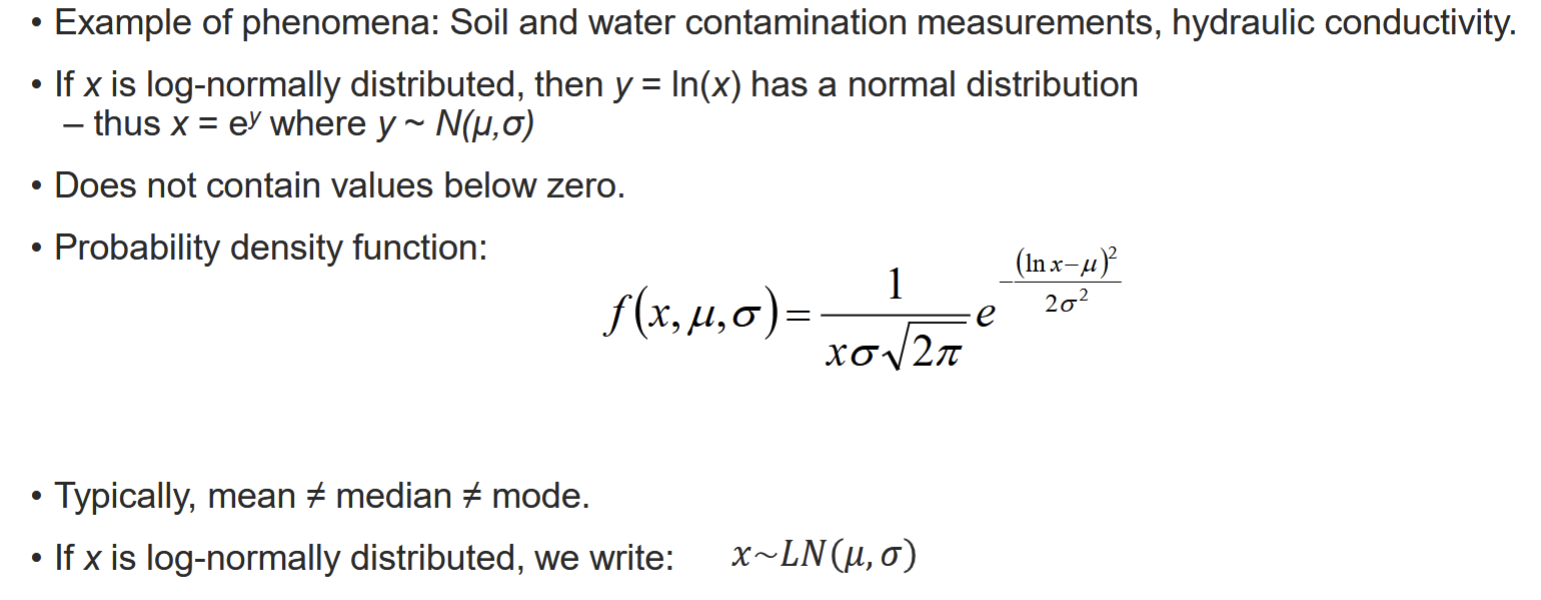
Log normal equation
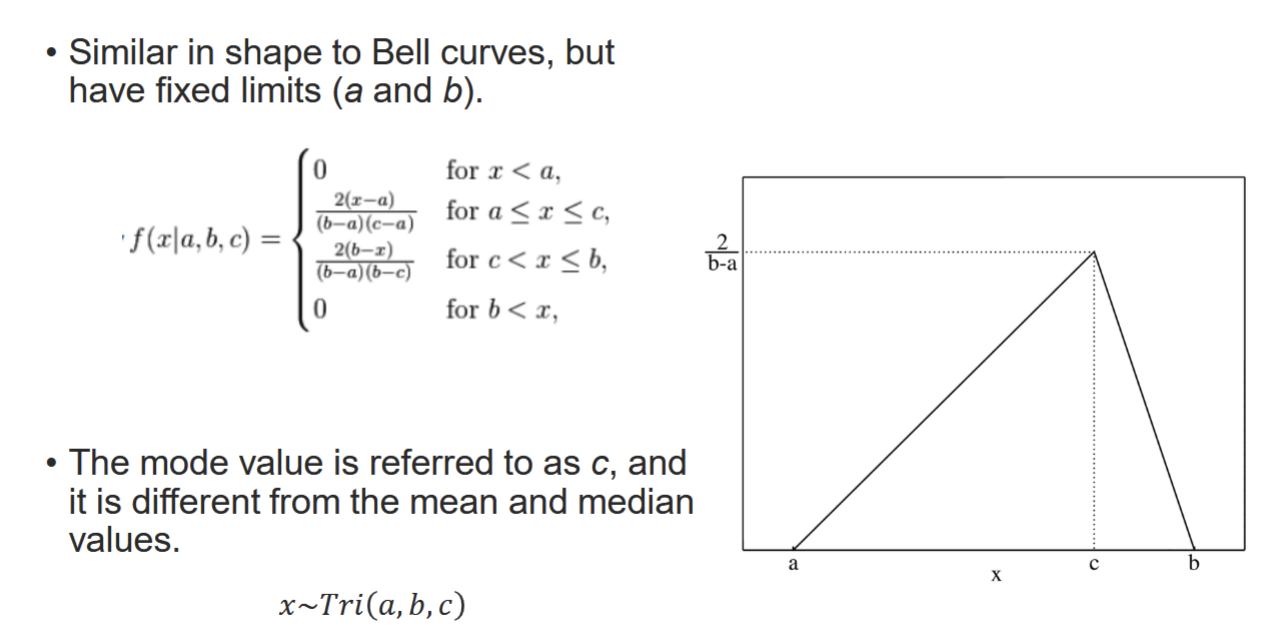
Triangular distribution
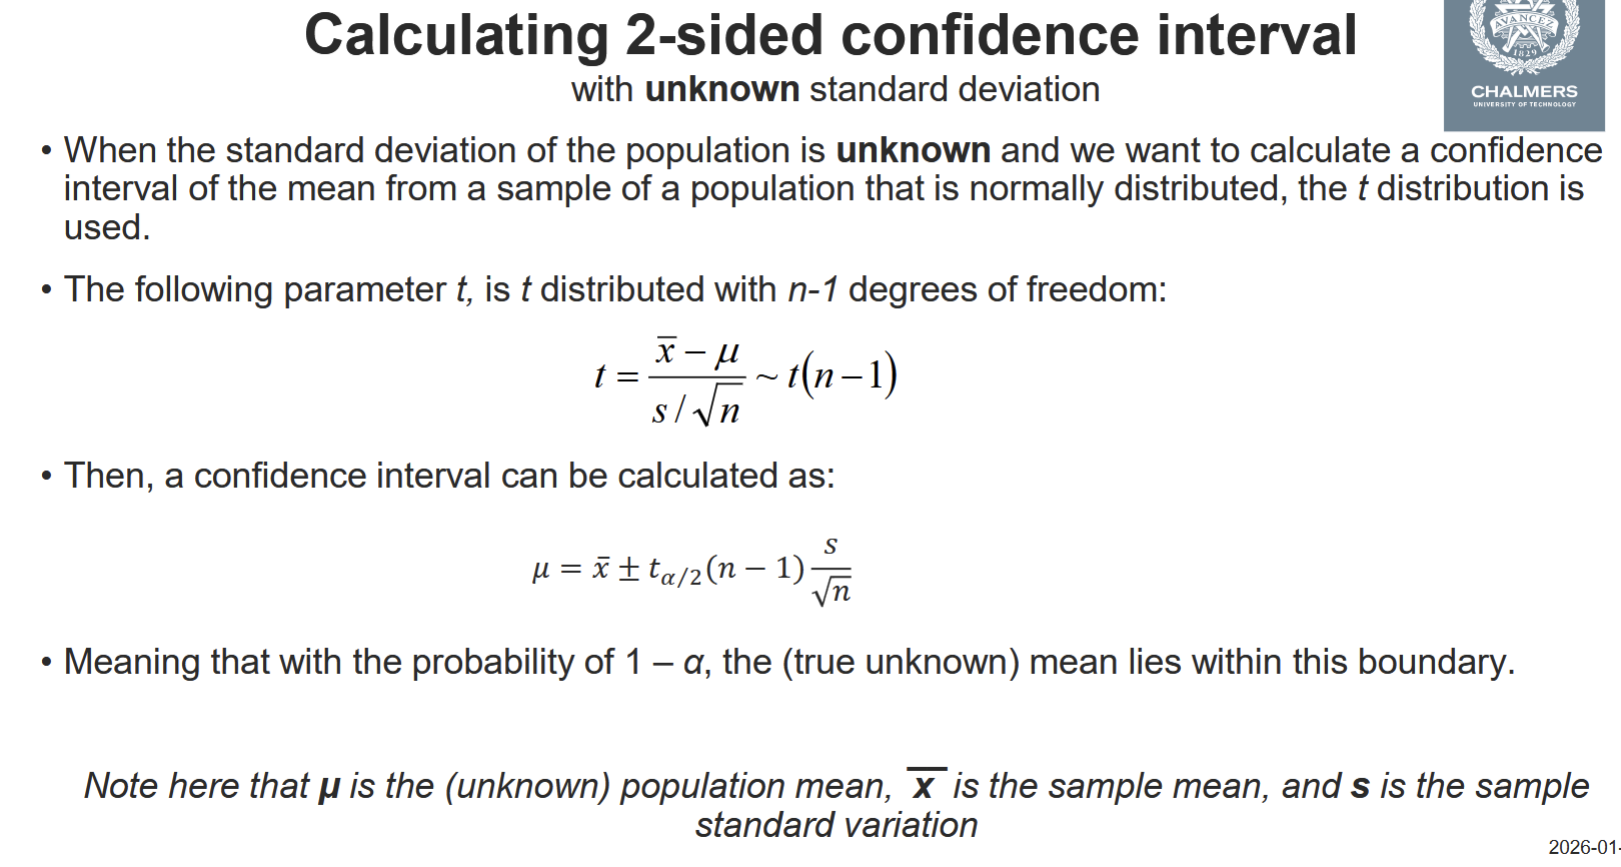
Calculating 2-sided confidence interval
Calculating UCL95 (certainty)
How can you ensure a transparent decision process if you apply MCDA to support the decision? Shortly discuss transparency vs objectivity.
A transparent decision process means it is possible to follow the different steps taken in the process, the MCDA model and is fully documented as well as the different assumptions made, the motivations for all scores and weights, which stakeholders had a say (and which did not) and at which point in time, etc.
Just because a decision and a decision process is transparent does not necessarily mean that everything in the process and in the decision is fully objective.
How different criteria are weighted is often based on values, which can differ between different stakeholders, i.e. is often subjective.
A process and a decision can be transparent even if it is not fully objective.
Normalised weights in MCDA mean…
weights in %, not numbers
Describe the purpose of using an event tree as part of risk assessment and illustrate how it can be used by means of an example.
Event trees analyse the question “What can this initial event lead to?”.
It links possible outcomes following an initiating event based on, for example, the success or failure of safety barriers.
The model has a horizontal structure that proceeds from left to right over time.
To be able to construct a correct event tree, it is necessary to have a good understanding of the analysed system as well as causes and consequence relationships, etc.
The results of an event tree analysis are probabilities for possible outcomes. The probabilities can be combined with information on consequences to calculate expected consequences.
What is a quantitative method? Give example.
Example: CBA
Explain the general aim and purpose of a CBA
…is aimed at investigating whether a project or a measure results in increased well-being of society, i.e. social profitability
...relies on welfare economics to express costs (negative effects) and benefits (positive effects) of a project/measure in monetary units
…monetise well-being change in society as a sum of net benefits (net benefit = benefits minus costs) generated by a project/measure: Positive sum of net benefits = social profitability, Negative sum of net benefits = social loss
Main question a CBA seeks to answer: Will a project/measure contribute to an increased well-being of society or not?
CBA step by step
1. Specify the project alternatives, define the reference alternative
2. Identify relevant costs (negative effects) and benefits (positive effects) and identify who stands for costs/ receives benefits (e.g. developer, public, specific groups)
3. Quantify effects of alternatives over the lifetime of the project relative to the reference alternative
4. Monetise (express in dollar/euro/SEK) all impacts whenever possible
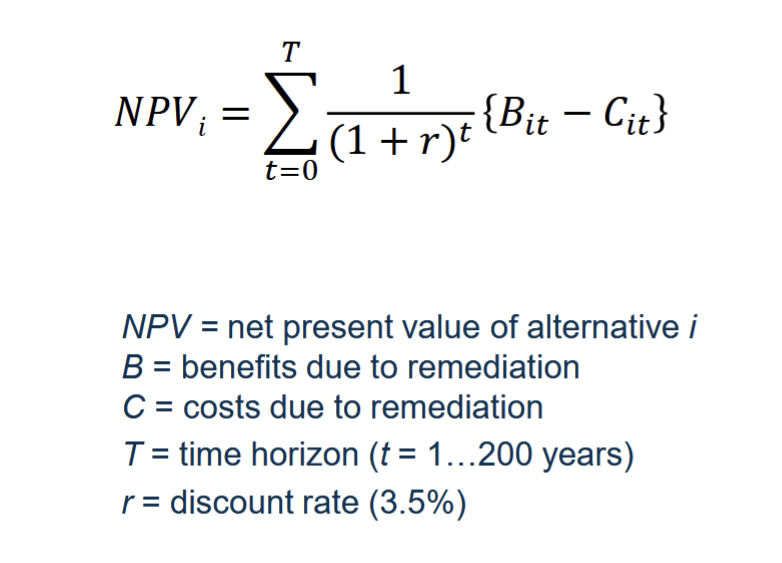
5. Discount all future benefits and costs to obtain present values
6. Compute net present value of each alternative
CBA in steps: 1. Specify the project alternatives and define the reference alternative
Describe the project and formulate its objective
• Specify project alternatives and reference alternative
Alternative risk-reducing measures to manage contaminated site
Reference alternative – ‘do nothing’
• Decide the time horizon for the project alternatives
Usually, long time horizons that include several generations
Specify when each effect (cost/benefit) occurs
CBA in steps: 2. Identify relevant costs and benefits
• Whose costs and benefits should be included in the analysis?
• A country? A region? A city?
• List all relevant negative and positive effects of the project, i.e. relevant cost and, respectively, benefits
• Specify who stands for each cost/benefit item
• Perform a qualitative assessment of each effect of each alternative to identify critical costs/benefits
CBA in steps: 3. Estimate impacts quantitatively over the relevant time horizon
• Identify all effects for everyone included in the defined society compared to the reference alternative(a change from A → B)
• Quantify these effects over the relevant time horizon
Measure effects in their respective units, e.g. amounts of excavated soil in tones, fuel consumption in liters etc.
Common mistakes at this stage are to miss impacts or to double-count them
CBA in steps: 4. Monetisation of cost and benefit items
• Many costs and benefits are already expressed in monetary units in a marketplace (dollar/euro/SEK)
• Monetary units provide a common unit for facilitating comparison of different types of costs and benefits
• There are two common measures of individuals’ preferences used to put a monetary value on the project effects:
Willingness to pay (WTP)
Willingness to accept (WTA)
CBA in steps: 5. Discount all future benefits and costs to obtain present values
• Costs and benefits from projects usually arise at different points in
time
• The value of future costs and benefits must therefore be converted
(discounted) in order to be summed up in today’s monetary value (or
the starting year of the project)
• To be able to compare the social profitability of project alternatives,
the present value of all costs and benefits must be calculated
Calculating NPV (formula)
Strengths and limitations of a CBA
Advantages:
- Comprehensive analysis
- Informed decision-making
- Monetary measurements (easier comparison)
- Prioritisation of recourses
- Transparency
Limitations:
- Anthropocentric perspective – complement a CBA with an MCA
- Monetisation challenges – proxy measures (benefit transfer), qualitative analysis
- Assumptions and uncertainties
- Time sensitivity
- Distributional effects
- Complexity
Ethical principles of a CBA
Utilitarianism
- Maximising overall utility (welfare)
Utilitarianism is an ethical point of departure in a CBA, i.e. the most ethical choice of a project/measure is those one that maximizes well-being for all affected individuals on the aggregate society-wide level.
Anthropocentric worldview
- Focus on human well-being
- Nature only has value through human utility
How are values defined in a CBA?
Value is the inherent worth that an individual (or society) assign to a good/service, which
contributes to his/her well-being.
Factors that influence the value :
- Scarcity
- Substitutes
- Time
- Preferences
Humans determine the value!
Factors that influence the value: Scarcity, subtitutes, time, preferences
Explain decision analysis
Comparing risk-reducing alternatives in a structured way
• Serves as a basis for decision-making
• Decision analysis should not be confused with decision-making!
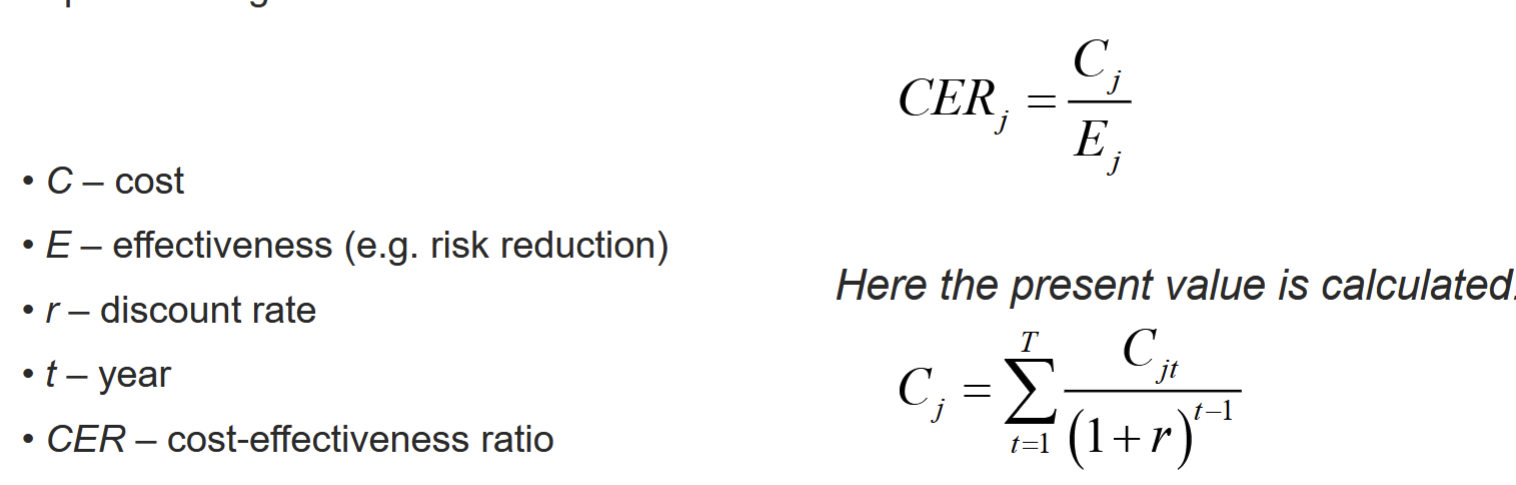
Cost effectiveness analysis
Tool to identify what alternative achieves a specified target to the lowest cost
Why account for uncertainty in risk assessment and decision analysis?
• Real-world systems are subject to variability, incomplete knowledge, etc.
• Ignoring uncertainty creates false confidence and can lead to poor or unsafe decisions
• Extreme but low-probability may be important to consider
• Decisions based on single-point estimates hide trade-offs and risk exposure
• Explicit treatment of uncertainty improves transparency, robustness, and credibility
• Uncertainty is not a weakness of analysis — it is a defining feature of real decision problems
Pareto criterion
• A change (from A -> B) is assumed to result in Pareto
improvement if at least one individual is better off while no one
is worse off.
• A change result in increased welfare even if it brings
significant inequalities, as long as no one is made worse off
(e.g. think of luxury housing)
What is the Kaldor Hicks criterion?
“B is more socially profitable than A if is “possible” for everybody to be a little bit better off”
Main idea: Criteria is that winners “can” in theory compensate losers. However, in practice they actually don’t have to do it.