QA 233 La Tech Test 1 Freling
1/87
There's no tags or description
Looks like no tags are added yet.
Name | Mastery | Learn | Test | Matching | Spaced |
|---|
No study sessions yet.
88 Terms
chapter 1
the scales of measurement and introduction
what are the main scales of measurement?
nominal, ordinal, interval, and ratio
what is nominal?
categorical data, which can be coded numerically in to a dataset
what is ordinal?
nominal & order of rank in data is meaningful
what is interval?
ordinal & interval between values is expressed in terms of a fixed unit of measure (always numeric)
what is ratio?
interval properties & ratio of two values is meaningful (always numeric). zero means absence
what units of measure in qualitative data?
nominal & ordinal
what units of measure in quantitative?
interval & ratio
what is cross-sectional data?
data collected at the same or approximately the same point in time
what is time series data?
data collected over several time periods
what are the 2 types of data sources?
observational & experimental
what is observational?
data acquired by observing what is occurring in a particular setting and recording variables of interest (surveys, opinion polls)
what is experimental?
data collected under controlled conditions. variation in other variables is controlled, in order to yield interferences about the impact on variables of interest
what are descriptive statistics?
data that is summarized and presented in a form that is easy for the audience to understand (tables, graphs, numbers)
what is a statistical interface?
the application of statical processes to data collected from a sample to make estimates and test hypotheses about the characteristics of a population
what is a population?
set of all elements of interest in a particular study (greek letters are used to denote)
what is a census?
used to collect information from the entire population
what is a sample?
a subset of population
what is a sample survey?
used to collect data from a sample of the population
what is analytics?
the scientific process of transforming data into insight for making better decisions
what are descriptive analytics?
describe what has happened in the past
what are predictive analytics?
the use of analytical techniques that use models constructed from past data to predict the future or to assess the impact of one variable on another
chapter 2
what are the 2 methods for summarizing categorical data?
tabular & graphical
what is tabular data summarization?
frequency distribution, relative frequency distribution, and percentage frequency distribution
what is graphical data summarization?
bar chart & pie chart
what is a frequency distribution?
a tabular summary of data showing the number (frequency) fo observations in each of several unique categories or classes

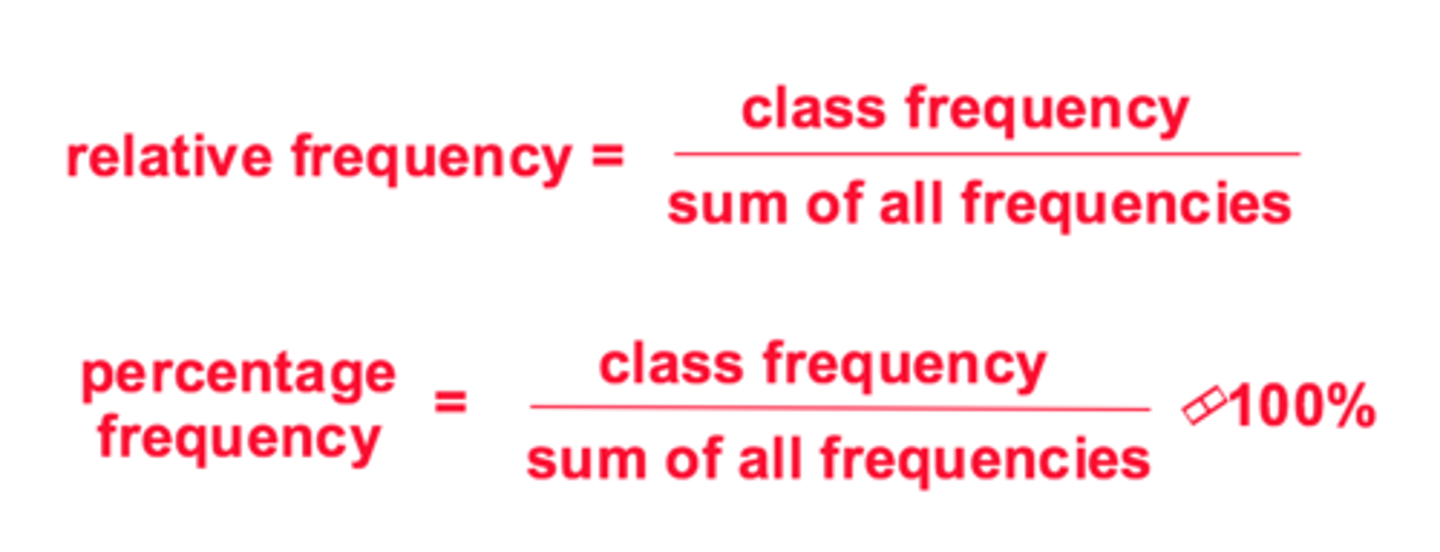
what is relative frequency?
fraction or proportion of the total number of data items belonging to a class
relative frequency of a class = frequency of the class / n
what is n?
the sample
what is percent frequency?
relative frequency multiplied by 100
percent frequency = relative frequency * 100
what is percent frequency distribution?
tabular summary of a set of data showing the percent frequency for each class
how do you display frequency for categorical data?
bar chart & pie chart
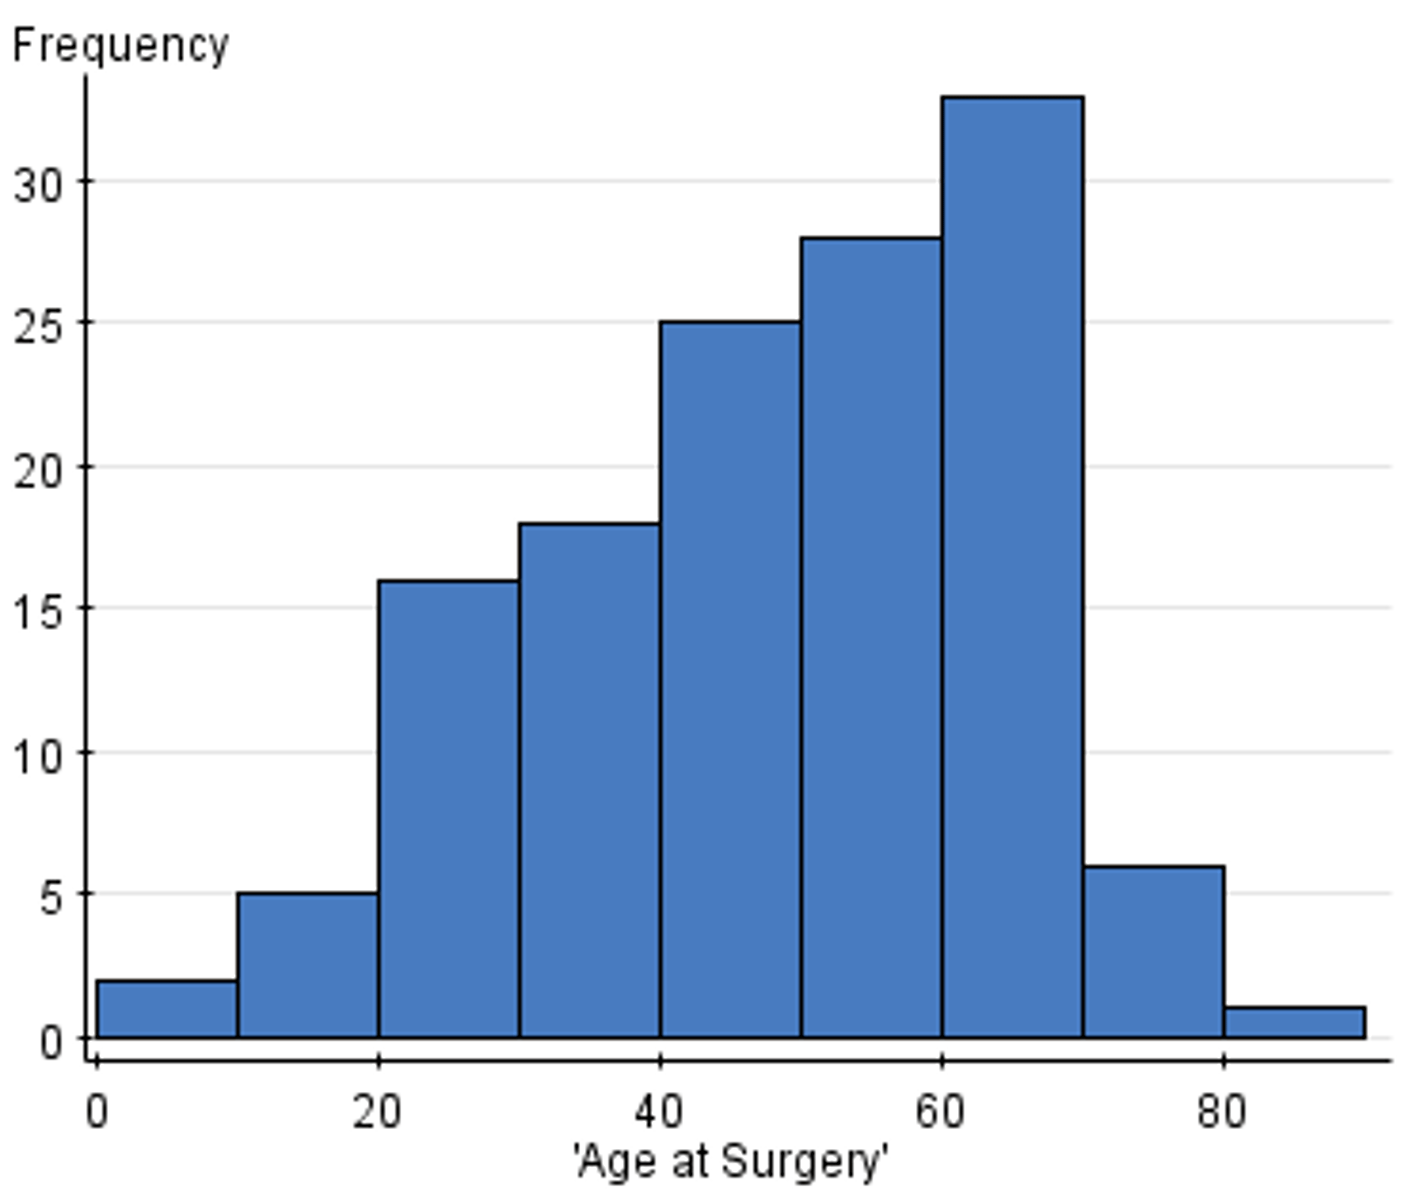
how do you display frequency for quantitative data?
histogram, dot plot, and stem & leaf
what is a cumulative frequency distribution?
shows the number of data items with values less than or equal to the upper-class limit of each class
what is cumulative relative (percent) frequency distribution?
shows the proportion (percentage) of data items with values less than or equal to the upper limit of each class
what is a histogram?
similar to a bar chart, but no natural separation between classes in a histogram
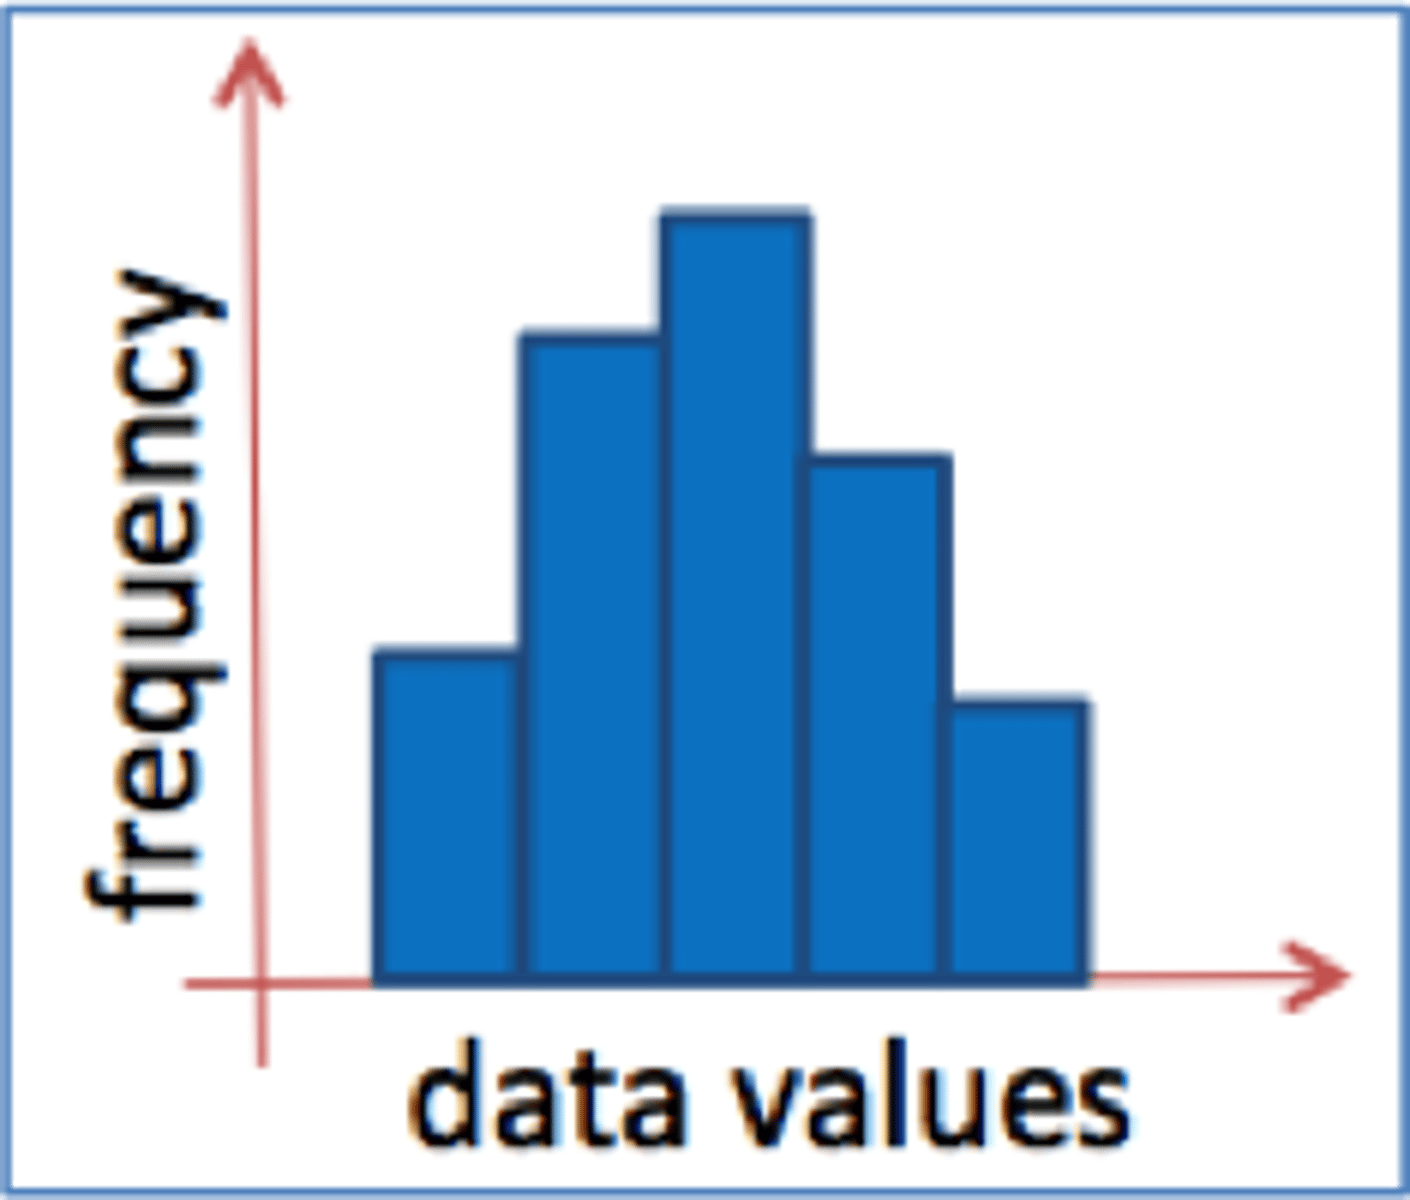
what are the 3 main histogram distributions?
symmetric, left skewed, and right skewed
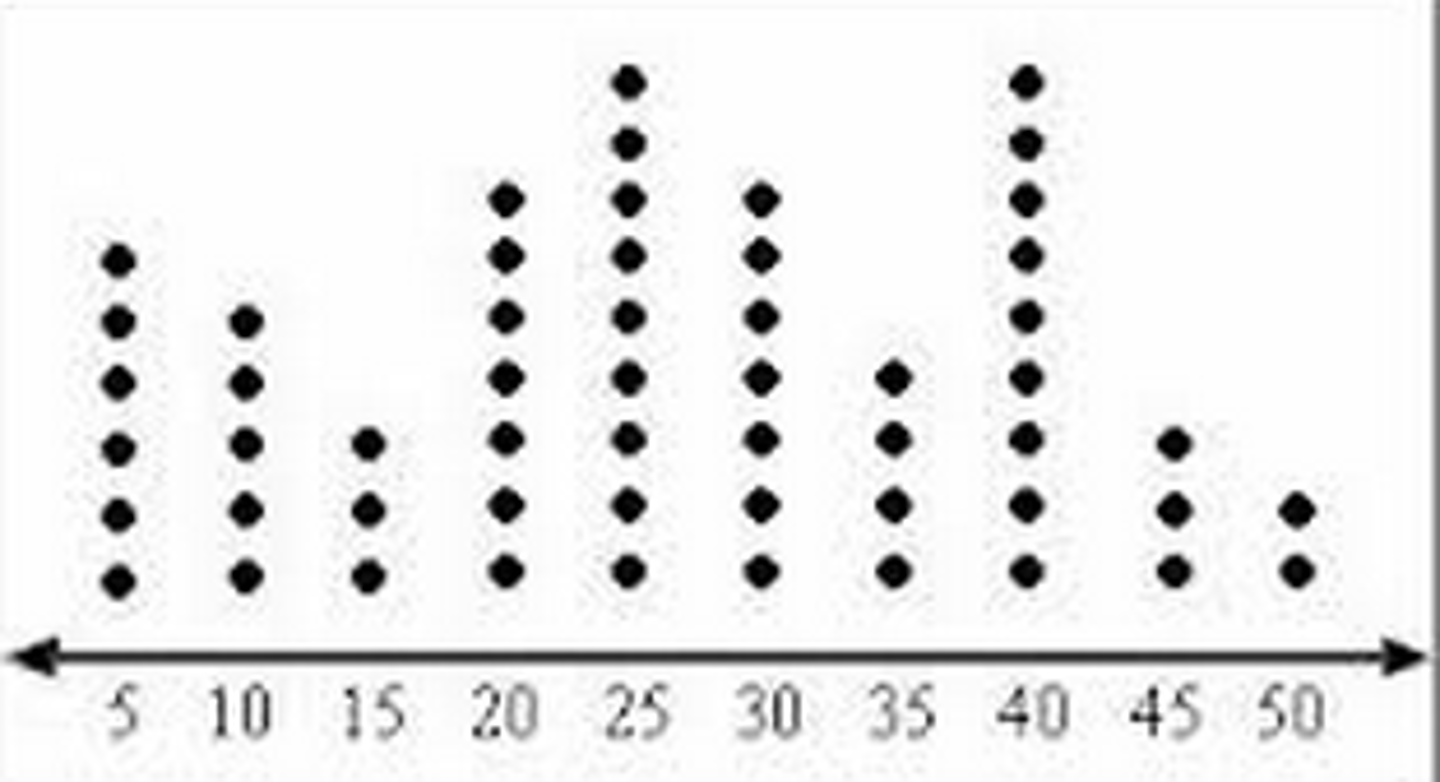
what is a dot plot?
quick way to manually create a histogram
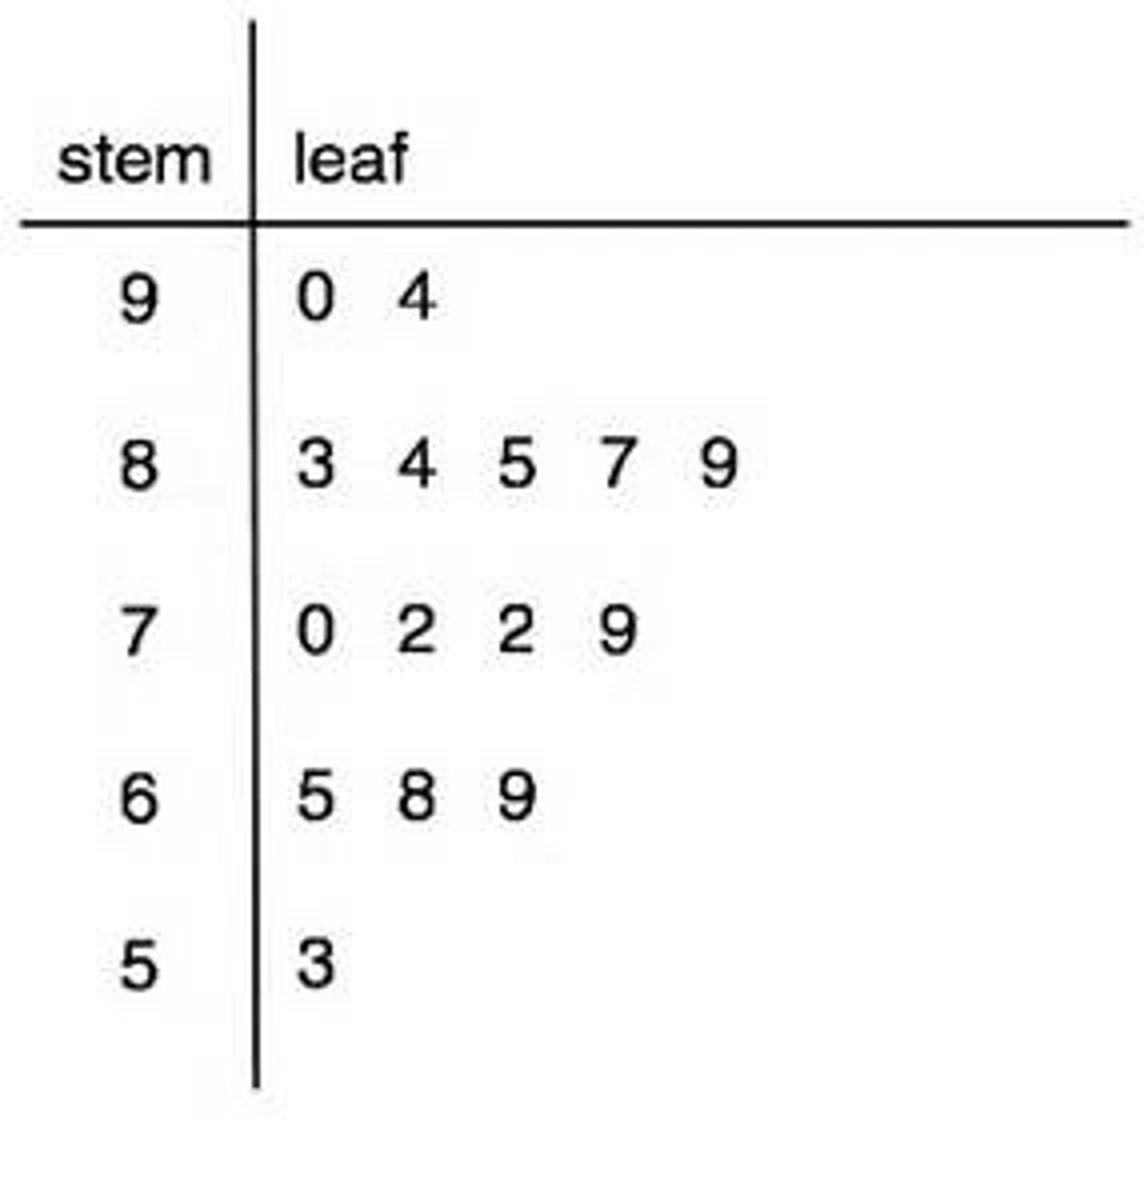
what is a stem and leaf?
shows the shape of distribution of data and rank order at the same time
what is crosstabulation?
a tabular summary of data for two variables (can be the same type or one of each ex. categorical & quantitative)
how can you summarize 1 categorical and 1 quantitative crosstabulation?
side-by-side bar chart & stacked bar chart
how can you summarize a 2 quantitative cross tabulation?
scatter diagram
what is the greek letter for population mean?
looks like a u

what is the greek letter for population variance?
looks like an o^2
what is the greek letter for standard deviation?
looks like an o

what is the symbol for sample mean?
x
what is the symbol for sample variance?
what is the symbol for sample standard deviation?
s
what are the measures of location?
mean, median, mode, weighted mean, geometric mean, percentile, and quartile
what is the mean?
the average value (xbar or weird you)
sum of samples/ number of samples
what is the median
the middle value of a set of values arranged in ascending order
what is the mode?
the value that occurs most frequently in a set of values
what is weighted mean?
mean value calculated by giving each value a weight according to its importance (GPA, average stock price)
sum of sample * weight / total weight
what is geometric mean?
the nth root of the product of n values
n square root x1x2... xn
what is percentile?
provides information about how data is spread over the maximium and minimum values
what are quartiles?
specific percentiles that divide the data set into 4 parts
what are the measures of variability?
range, interquartile range (IQR), variance, standard deviation, and coefficient of variation
what is range?
the difference between the largest and smallest values in a data set
what is interquartile range (IQR)
the measure of variability between the first and third quartile i.e the middle 50%
what is variance
the measure of variability based on the squared deviation of the mean
population variance =
sum of (xi - xbar)^2 / N
standard deviation
the square root of the variance
coefficient of variation
a measure of how large the standard deviation is relative to the mean
standard deviation / mean * 100
what is skewness?
a measure of how much the distribution of values in a data set deviate from symmetric (negative skewness, positive skewness, or 0 skewness)
what is relative location?
how much the values of a data set deviate from the mean
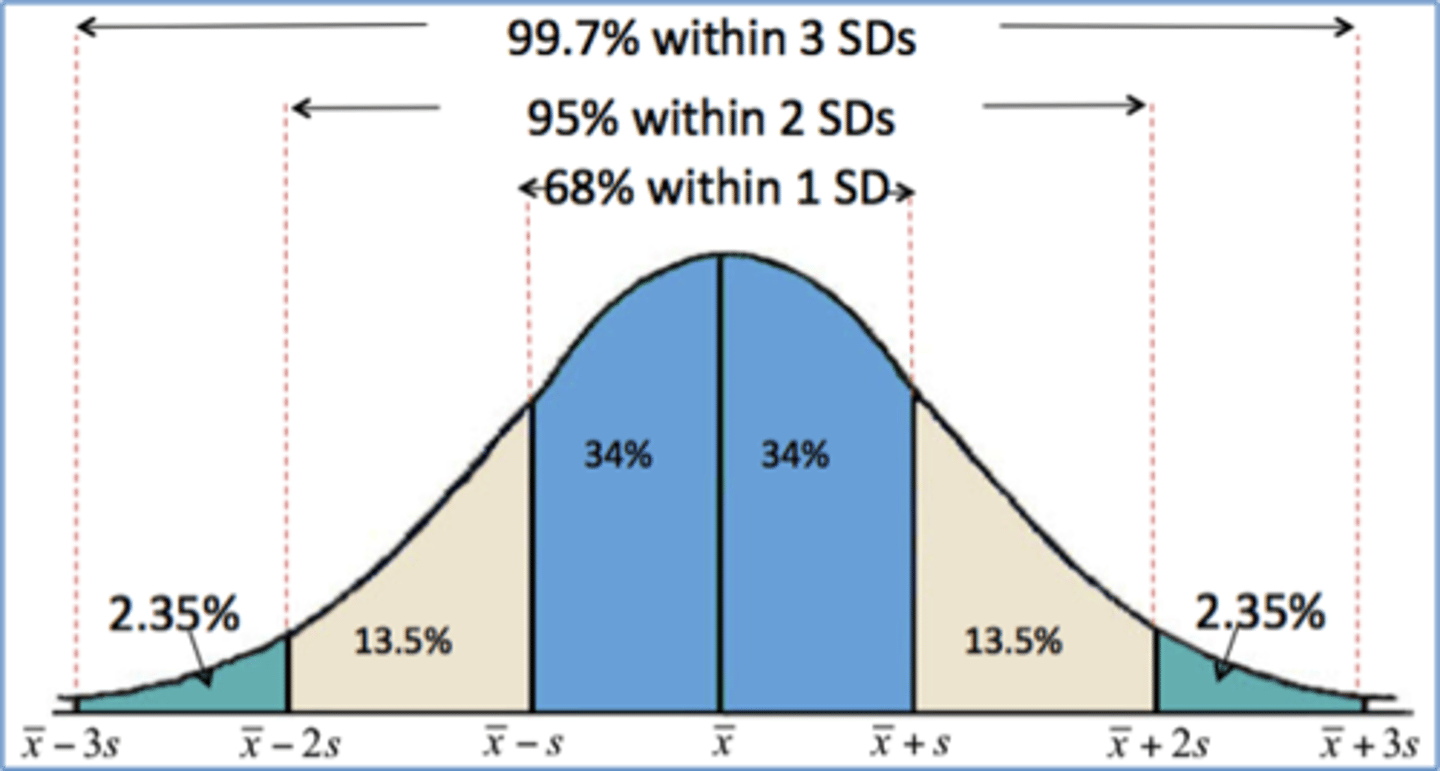
what are z-scores (standardized value)?
the number of standard deviations a value is away from the mean
what is the empirical rule?
applies to data values that exhibit a symmetric bell-shaped distribution - helps determine outliers
what is covariance?
the measure of the linear relationship between two variables
sample covariance =
the sum of (xi - xbar) * (yi - ybar) / (n - 1)
what is the pearson product women correlation?
measure of the linear relationship between two variables
sampel rxy =
sample covariance / (std.dev of x) * (std.dev of y)
population pxy =
population varience xy / population varience x * population varience y
what are combinations?
the order of the selection is not important when selecting from a population
what are permutations?
the order of the selection is important when selecting from a population
what are the 3 ways of assigning probability?
classical method, relative frequency method, and subjective method
what is the classical method?
assigning probabilities based on the assumption of equally likely outcomes
rolling a die
what is the relative frequency method?
assigning probabilities based on experimentation or historical data
waiting time at the doctor's office
what is the subjective method?
assigning probabilities based on judgment, using experience and intuition
tom and judy make an offer to purchase a house
judy says .8 for accepted & .2 for not
tom says .6 for accepted & .4 for not
what is an event?
collection of sample points
what is the probability of any even?
equal to the sum of the probabilities of the sample points in the event
what are the basic probability relationships?
complement, union, intersection, mutually exclusive
what is a complementing relationship of events?
event A is defined to be the event consisting of all sample points that are not in A
what is the addition law?
compute the probability of event A, or B, or both A and B occurring
P(AuB) = P(A) + P(B) - P(AnB)
what is a union of two events?
event containing all sample points that are in A or B or both (AuB)
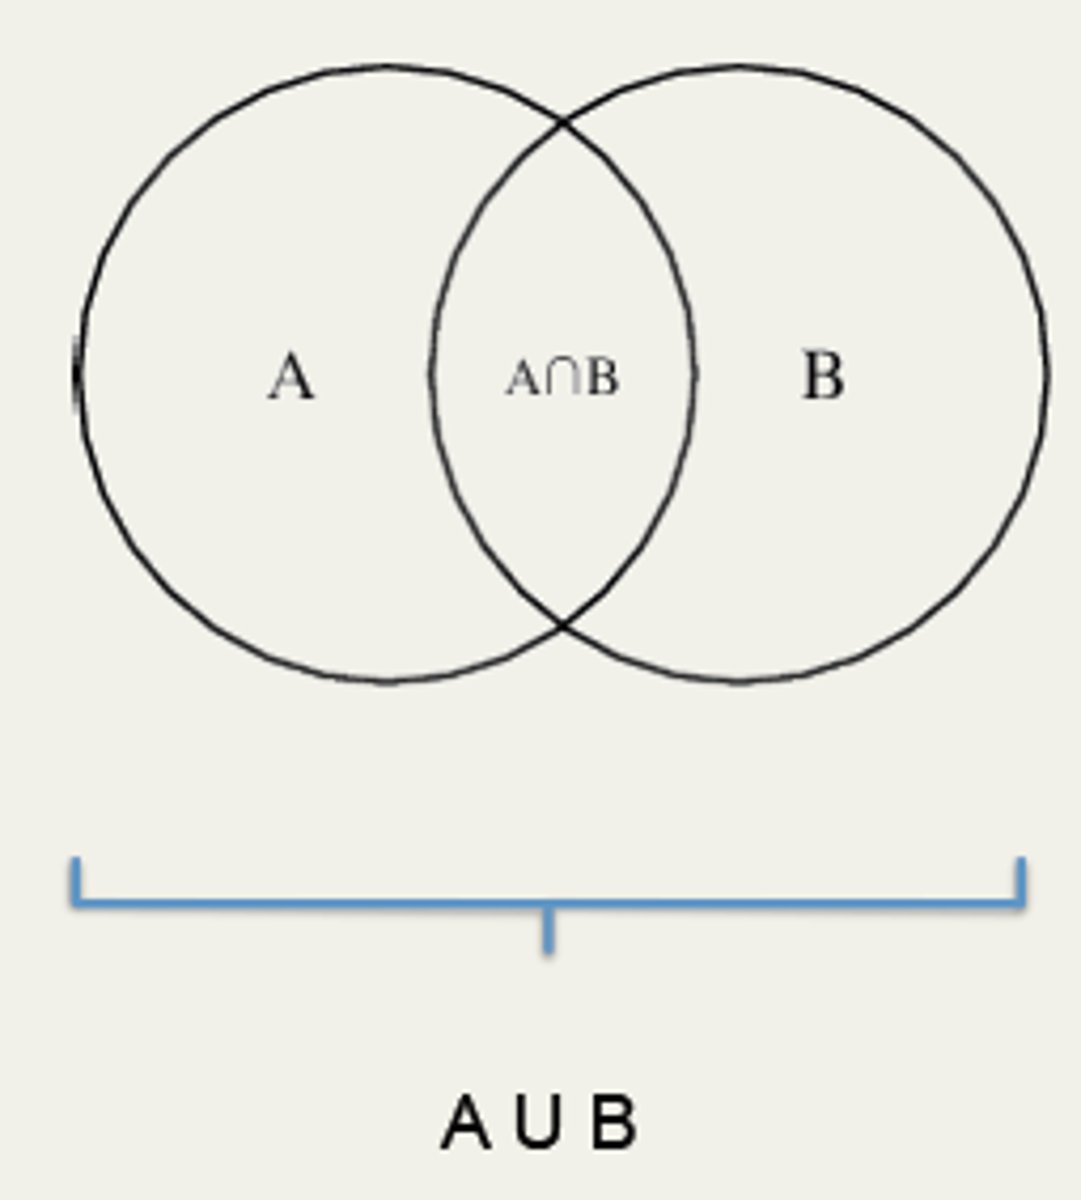
what is the intersecting of two events?
set of all sample points that are in both A and B (AnB)

what is the mutual exclusivity of 2 events?
the events have no sample points in common, and when one occurs the other cannot
what is conditional probability?
the probability of an event given that another event has occurred
P(A|B) = A given B
P(A|B) = P(AnB)/P(B)
what is the multiplication law?
a way to compute the probability of the intersection of two events
P(AnB) = P(B)P(A|B)
what is an independent event?
the probability of event ! is not changed by the existence of event B
what is babes theorem?
revising prior probabilities
what is a posterior probability?
what is the tabular approach?