Managerial Economics Exam 1: Chapter 1-4
1/99
There's no tags or description
Looks like no tags are added yet.
Name | Mastery | Learn | Test | Matching | Spaced |
|---|
No study sessions yet.
100 Terms
economics
the study of decision-making in the presence of scarcity
managerial economics
the application of economic analysis to managerial decision making
marginal reasoning
considering the effect of a small change
Examples of tradeoffs
how to produce
what prices to charge
whether to innovate
Younger individuals invest in _________ assets, while older individuals invest in ______ assets, like bonds.
riskier ; safer
Examples of other decision makers (in reference to managerial decision making)
consumers
workers
rivals
governments
market
an exchange mechanism that allows buyers to trade with sellers
strategy
a battle plan that specifies the actions or moves that the manager will make to maximize the firm's profit when interacting with a small number of rival firms
model
a description of the relationship between 2 or more variables
-what if analysis
-economic models include only the essential issues
-a simplification of reality
positive statement
concerns what is or what will happen and describes reality.
Ex: The economy is growing at 3.4%
This does not mean we are certain about the truth of the statement; it indicates only that we can test it.
normative statement
concerns what somebody believes should happen and prescribes a course of action.
Ex: The economy should be growing at 4%
economic theory
development and use of a model to formulate a hypothesis- proposed explanations for a phenomenon
Society faces trade-offs because of
scarcity
Example of a normative statement
To make the good available to more people, a lower price should be set.
Economic models are most often tested
using data from the real world
Profit is
the difference between a firm's revenues and its costs
Einstein was quoted saying "Everything should be made as simple as possible, but not simpler." When it comes to economic models this means that
A) models shouldn't be too complex.
B) models shouldn't be too simple.
C) models should have a level of abstraction appropriate to the topic investigated.
D) All of the above.
D. All of the above
Economic models are most useful in
predicting changes in one variable due to a change in one or more other variables.
If a model's predictions are correct, then:
-its assumption must have been correct
-it is proven to be correct
-both A and B
-none of the above
None of the above
A firm's managers are constrained by
consumers
workers
government
all of the above
all of the above
The purpose of making assumptions in economic model building is to
simplify the model while keeping important details.
Economists tend to judge a model based upon
the accuracy of its predictions
If a theory's predictions are incorrect
then economists will likely reduce their confidence in the theory.
Economic models are most useful in
explaining outcomes resulting from management decisions.
Microeconomics studies the allocation of
scarce resources.
Microeconomic models are used to
Make predictions, explain real-life phenomena, and evaluate policy alternatives.
CEOs should focus on
maximizing firm profits
A microeconomic model CANNOT be used to
evaluate the fairness of a proposal to nationalize health insurance
Example of a positive statement
If you consume this food, you will get sick.
If an important assumption is omitted from an economic model
the model's predictions will be inaccurate.
T/F:
Economic models are only useful in analyzing government policy.
False, economic models can be used to predict individual and firm behavior.
All private firms seek to
maximize profit
Non-price determinants of demand
income
price of related goods (substitutes and complements)
information
tastes and preferences
government regulations
population
time of year
future price expectations
Non-price determinants of supply
costs (of production, labor, materials, capital)
advances in technology
government regulations
number of sellers in the market
future price expectations
quantity demanded
amount of a good that consumers are willing to buy at a given price, other factors held constant
law of demand
consumers demand more of a good if its price is lower, as shown by the downward sloping demand curve
quantity supplied
amount of a good that firms want to sell at a given price, other factors held constant
law of supply
Tendency of suppliers to offer more of a good at a higher price, as shown by the upward sloping supply curve
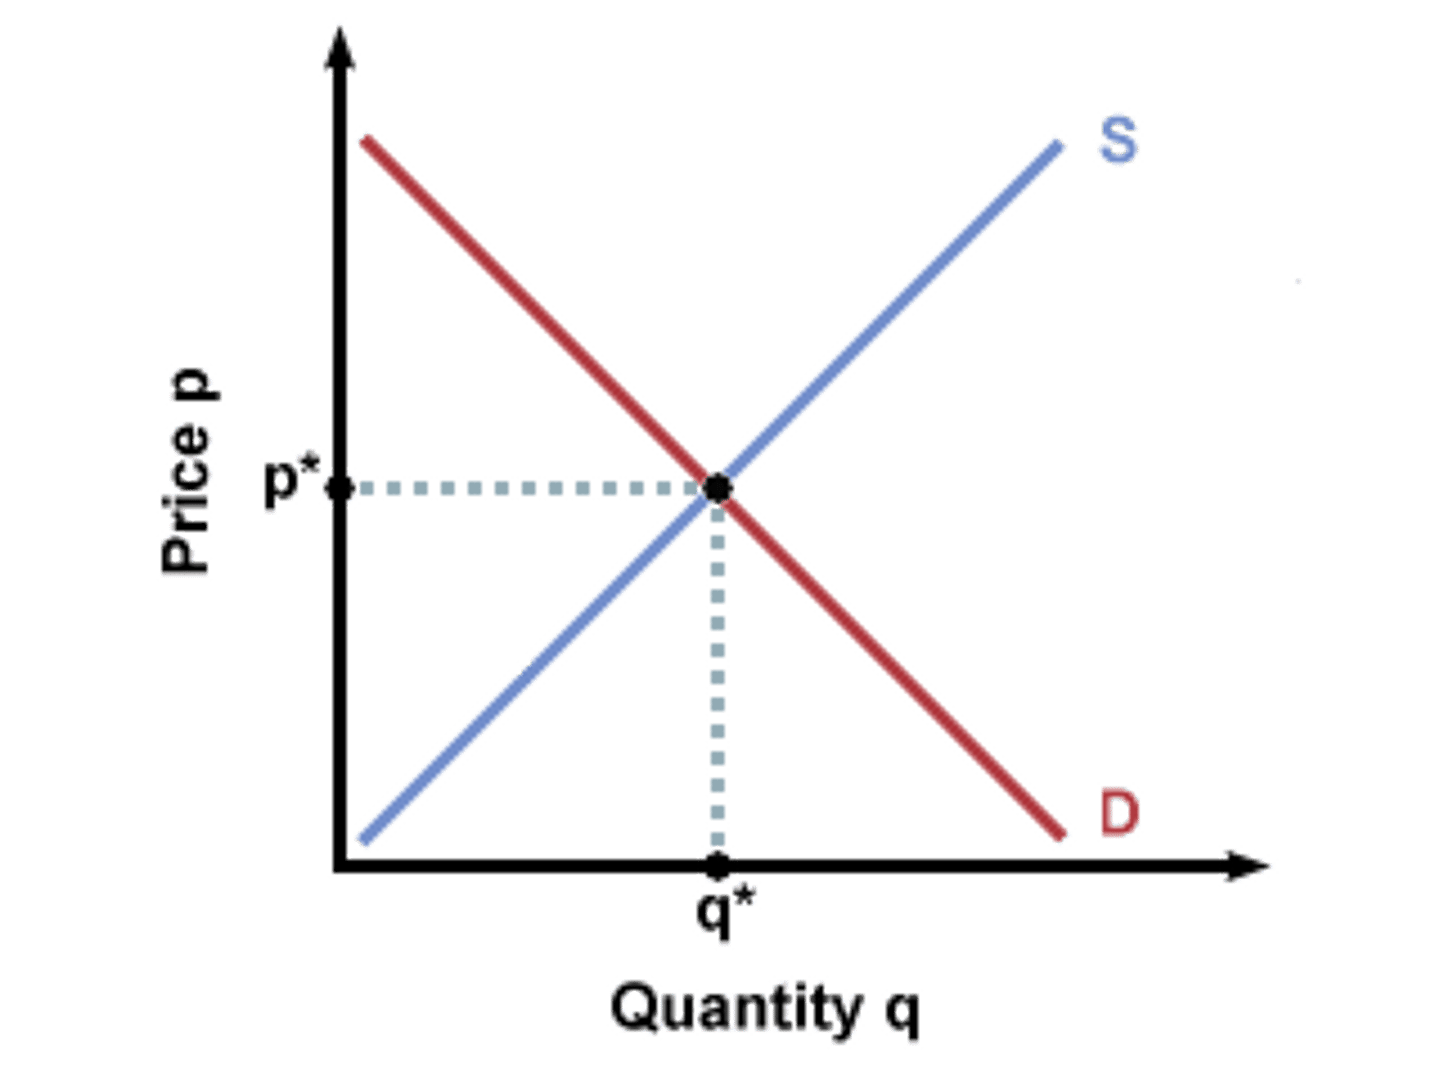
equilibrium
a situation in which no participant wants to change its behavior. quantity supplied equals quantity demanded.
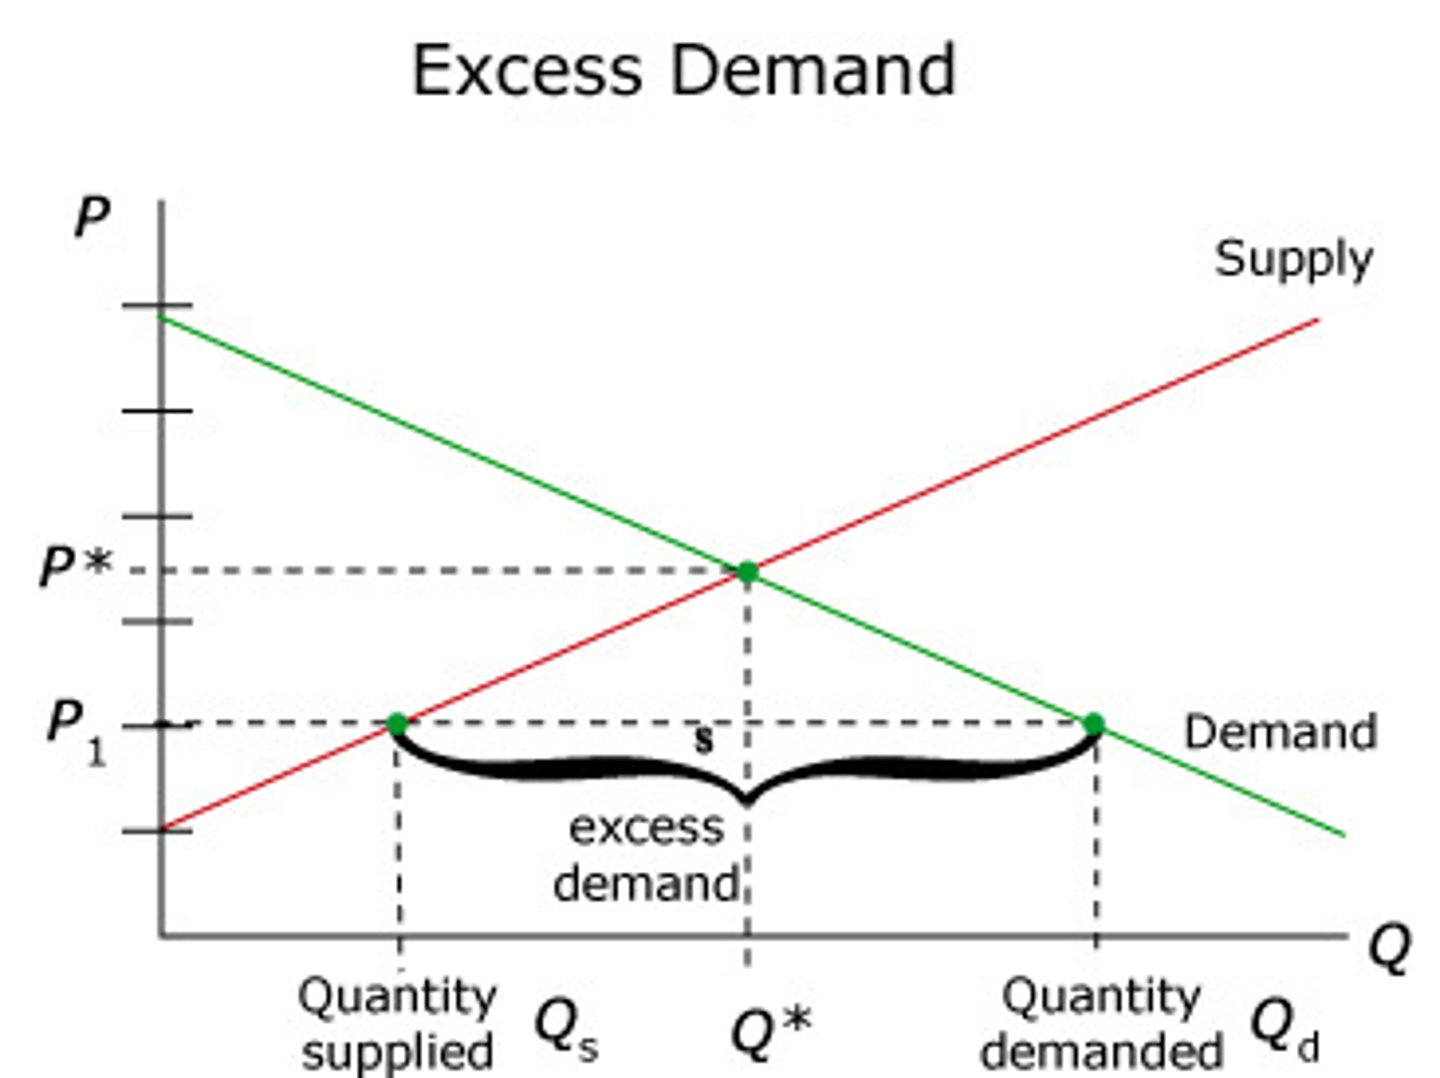
excess demand
the amount by which quantity demanded exceeds the quantity supplied at a specified price
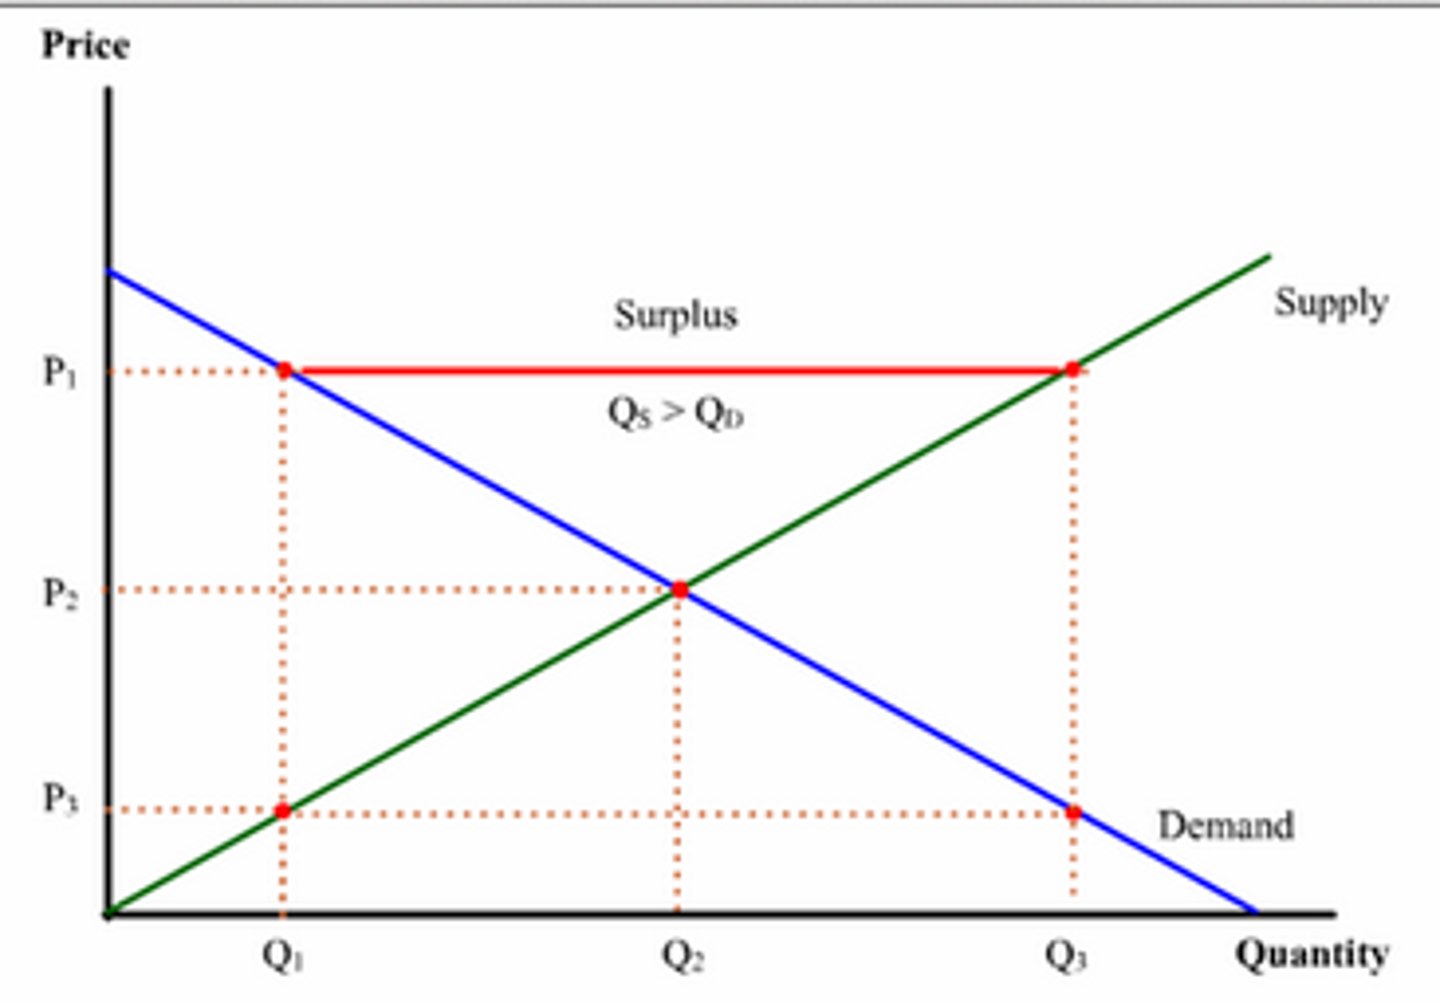
excess supply
the amount by which the quantity supplied exceeds the quantity demanded at a specified price
Types of government intervention
policies that shift curves
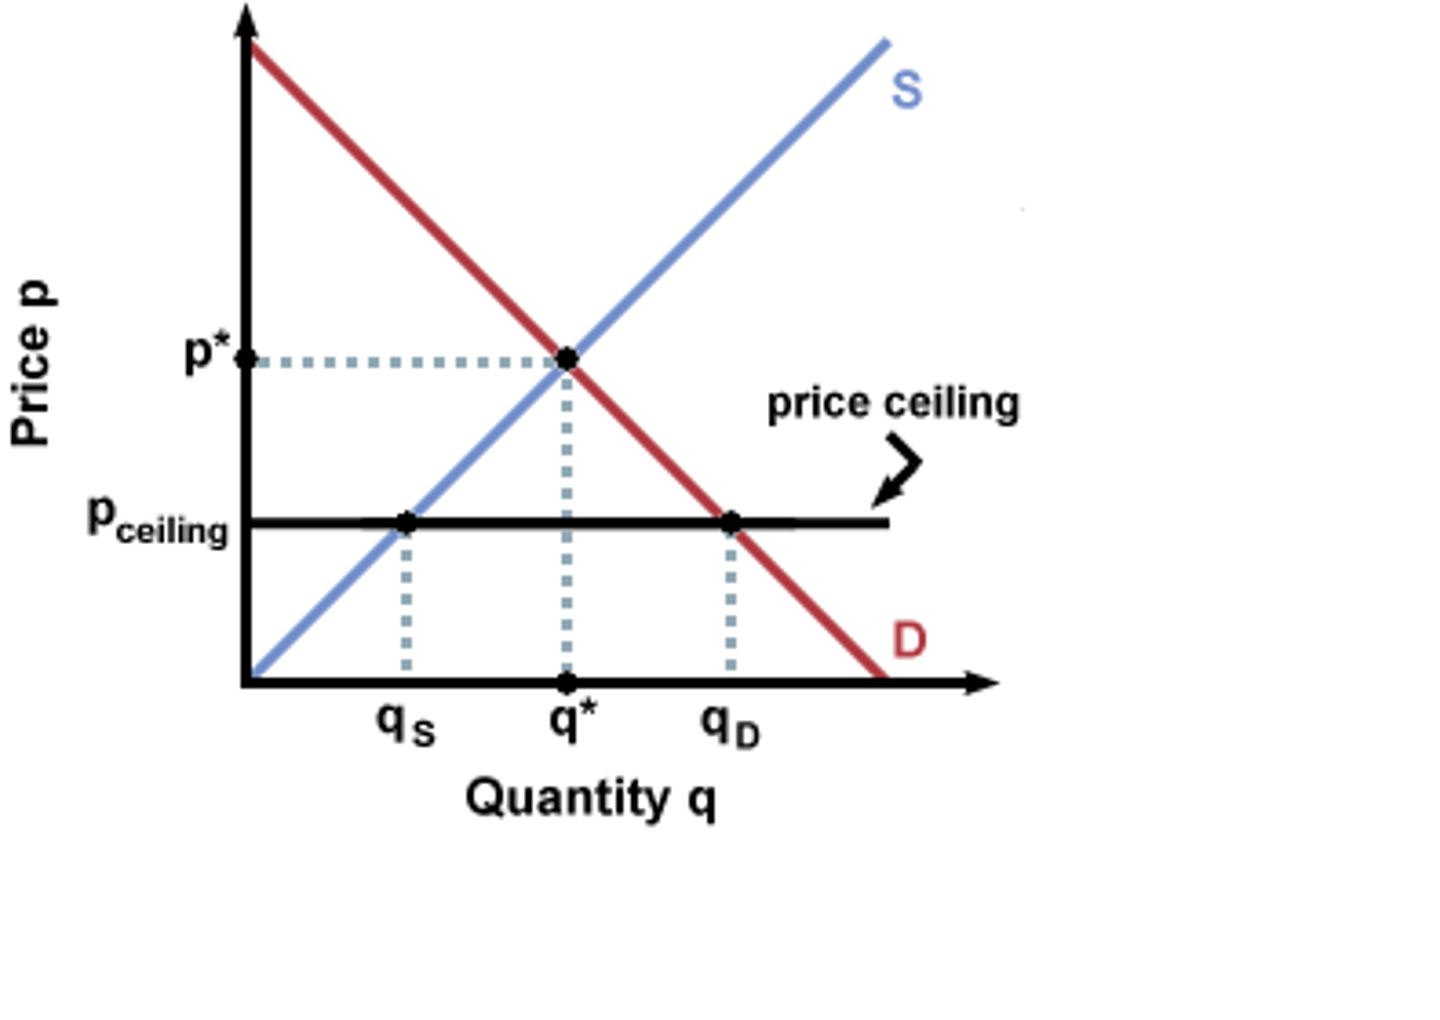
price controls
sales taxes
Price ceilings are set ______ the equilibrium price
below.
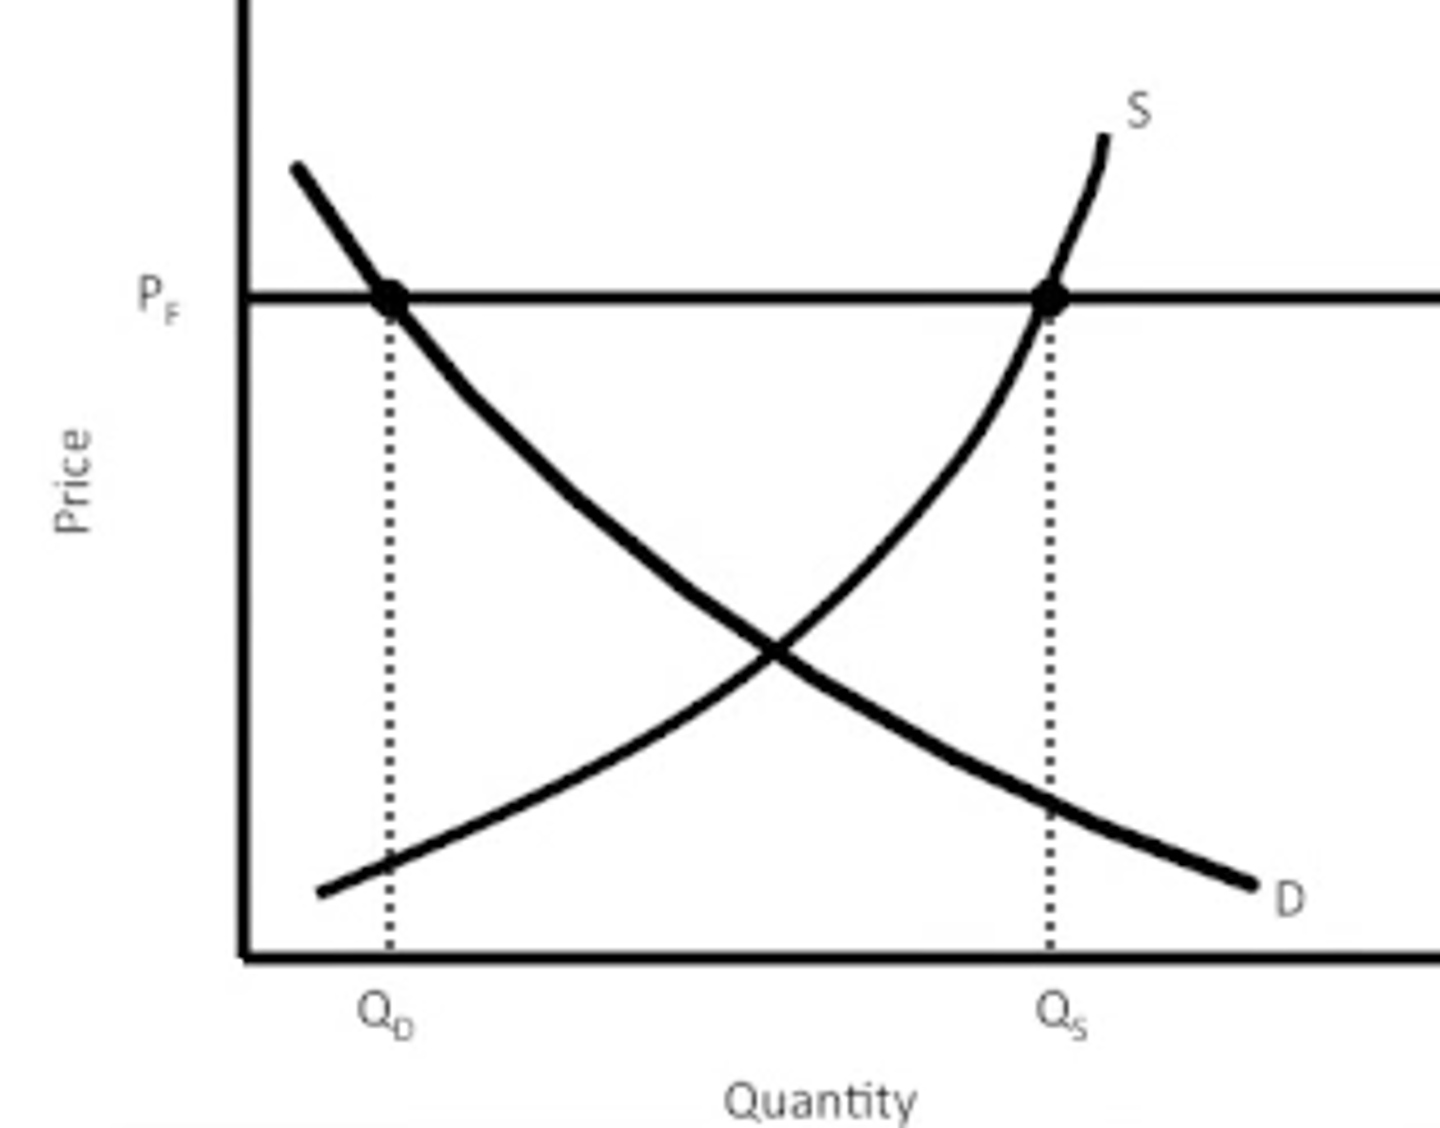
Price floors are set _______ the equilibrium price
above
Specific tax causes:
1. the equilibrium price consumers pay to rise
2. the equilibrium price that firms receive to fall
3. the equilibrium quantity to fall
The supply and demand model is accurate in what type of market?
a perfectly competitive market, in which all participants are price takers
Characteristics of price takers in a perfectly competitive market
-many buyers and sellers
-identical products
-participants have complete knowledge and information
-transaction costs are negligible
-firms can easily enter/exit the market over time
An increase in the price of oil will
leave the supply curve of oil unchanged.
An increase in the price of pork will lead to
a movement up along the demand curve.
From the 1970s through the 1990s, the relative price of a college education has increased greatly. During the same time period, college enrollment has also increased. This evidence suggests that during this time period
the demand curve for a college education has shifted rightward.
Which of the following cultural events likely increased the demand for the product highlighted in the event?
the inclusion of Reese's Pieces in the movie E.T.
The price of crude oil rose to over $100 per barrel in early 2013. What would we expect to see happen to the supply of plastic, which is produced using crude oil?
The supply of plastic will decrease.
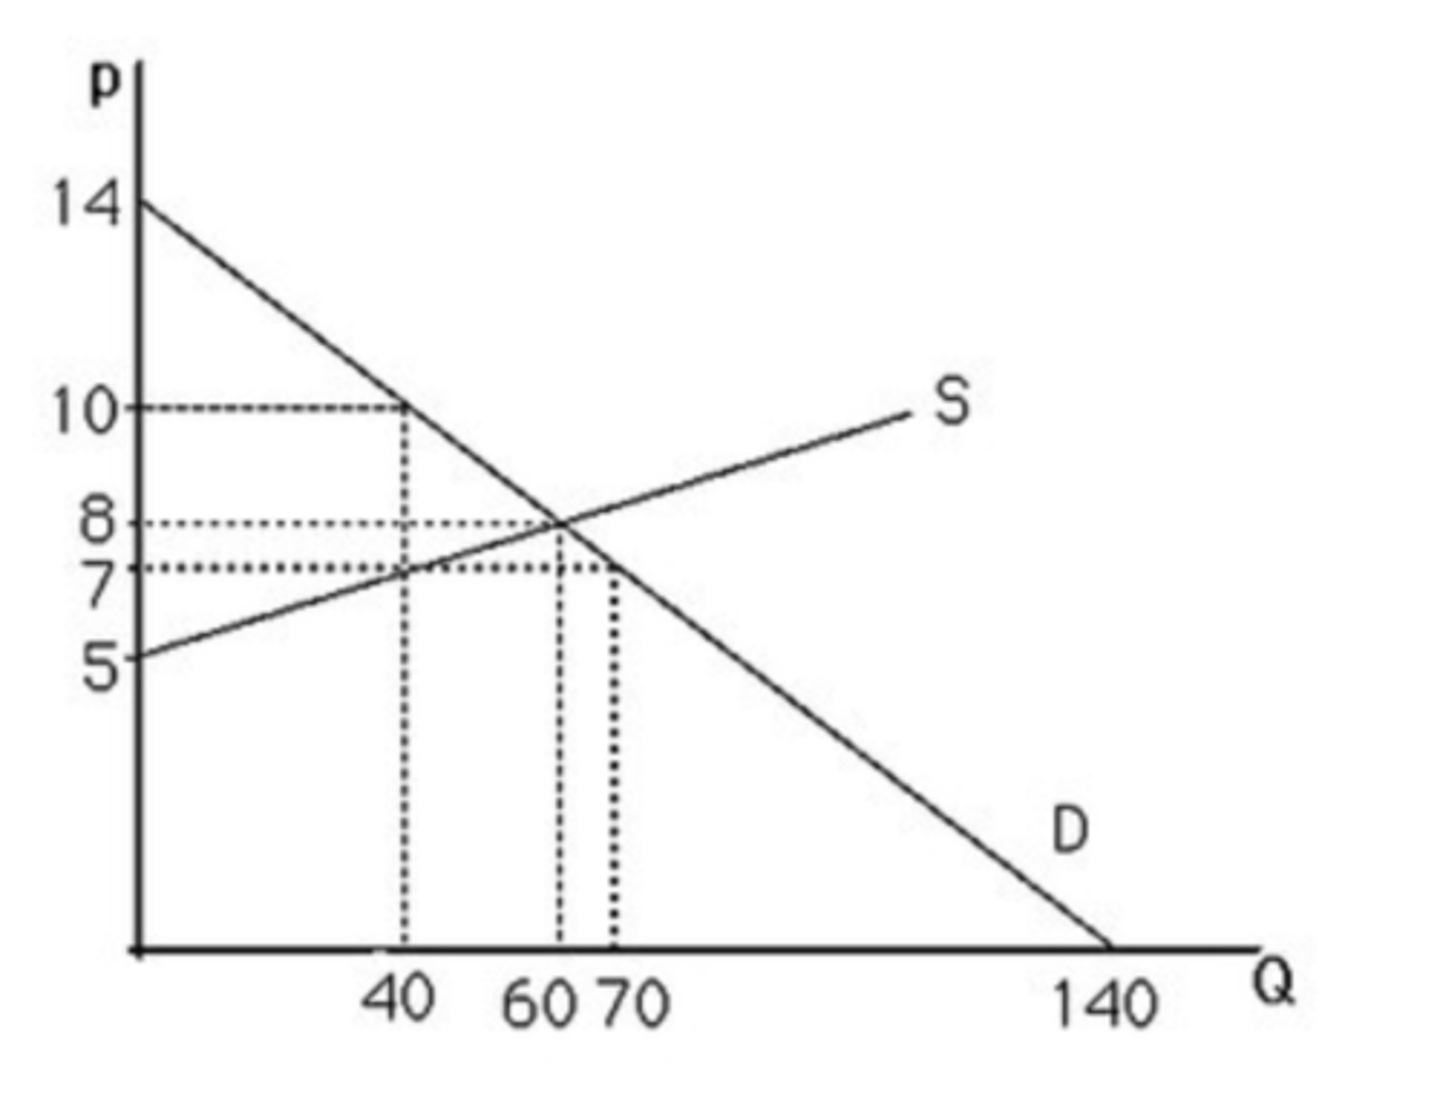
The above figure shows a graph of a market for pizzas in a large town. At a price of $10, the market
A) is not in equilibrium.
B) has excess supply.
C) does not have excess demand.
D) All of the above.
D. all of the above

The above figure shows a graph of the market for pizzas in a large town. At a price of $5, there will be
excess demand

An increase in consumer incomes will lead to
a rightward shift of the demand curve for plasma TVs.
If Qs = -20 + 10p, and Qd = 400 - 20p, what is the equilibrium price?
14
-20 + 10p = 400 - 20p
10p = 420 -20p
30p = 420
p = 14
Technological innovation in the production of computers has led to
a rightward shift of the supply curve for computers.
The supply curve
represents the quantity supplied at any given price.
The supply curve is influenced by
the prices of the inputs required to produce the product.
If the price of automobiles were to increase substantially, the demand curve for gasoline would most likely
shift leftward.
If the government institutes a specific tax for a good
the producer can generally only pass part of the tax onto the consumer.
It is appropriate to use the supply-and demand-model if, in a market
A) everyone is a price taker with full information about the price and quality of the good.
B) firms sell identical products.
C) costs of trading are low.
D) All of the above.
D. all of the above
As people have become more health-conscious and decided to eat food that is better for them
the demand curve for oranges and apples has shifted to the right.
Government actions can cause a
shift in either the supply or demand curves
The above figure shows a graph of the market for pizzas in a large town. At a price of $14, there will be
excess supply
Empirical methods:
-elasticity
-regression analysis
-forecasting
These are used to determine and analyze economic relationships that affect a firm's demand
elasticity
the measure of the responsiveness of one variable to a change in another
Elasticity= (equation)
percentage change in quantity demanded/percentage change in price
arc price elasticity
uses average price and average quantity as the denominator for percentage calculations
elasticity curve
income elasticity of demand
percentage change in quantity demanded divided by percentage change in income
cross price elasticity of demand
the percentage change in the quantity demanded of one good divided by the percentage change in the price of another good. (positive = substitute; negative = complement)
regression analysis
a statistical technique used to estimate the mathematical relationship between a dependent variable and one or more explanatory variables
random error term
captures the effects of unobserved influences
residual
the difference between the actual value of dependent variable and the predicted value
R^2
measure of goodness of fit of the regression line. share or dependent variable's variation that is accounted for by the explanatory variables.
extrapolation
seeks to forecast a variable of interest as a function of time. uses historical data and values.
Ordinary Least Squares Regression analysis attempts to
select a line that fits the data well.
A normal good has a ________ income elasticity of demand and quantity demanded ________ as income rises.
positive; increases
An R2 close to 1
indicates that almost all of the variation in the dependent variable is explained by the regression.
The percentage change in the quantity demanded in response to a percentage change in the price is known as the
price elasticity of demand.
If the demand curve is given by Q = a + bp, then a is
the quantity demanded when price is zero.
In regression analysis, the dependent variable
is the variable whose variation is to be explained.
If using a 95% confidence interval and the absolute value of the t-statistic is larger than the critical value, then
we reject the null hypothesis at a 95% confidence level.
Two variables are said to be ________ if they move together.
correlated
The random error term ________ the effects of ________ influences on the dependent variable that are not included as explanatory variables.
captures; unobserved
If the demand curve is given by Q = a + bp, then b is
the change in quantity demanded if price changes by 1.
An inferior good has a ________ income elasticity of demand and quantity demanded ________ as income rises.
negative; decreases
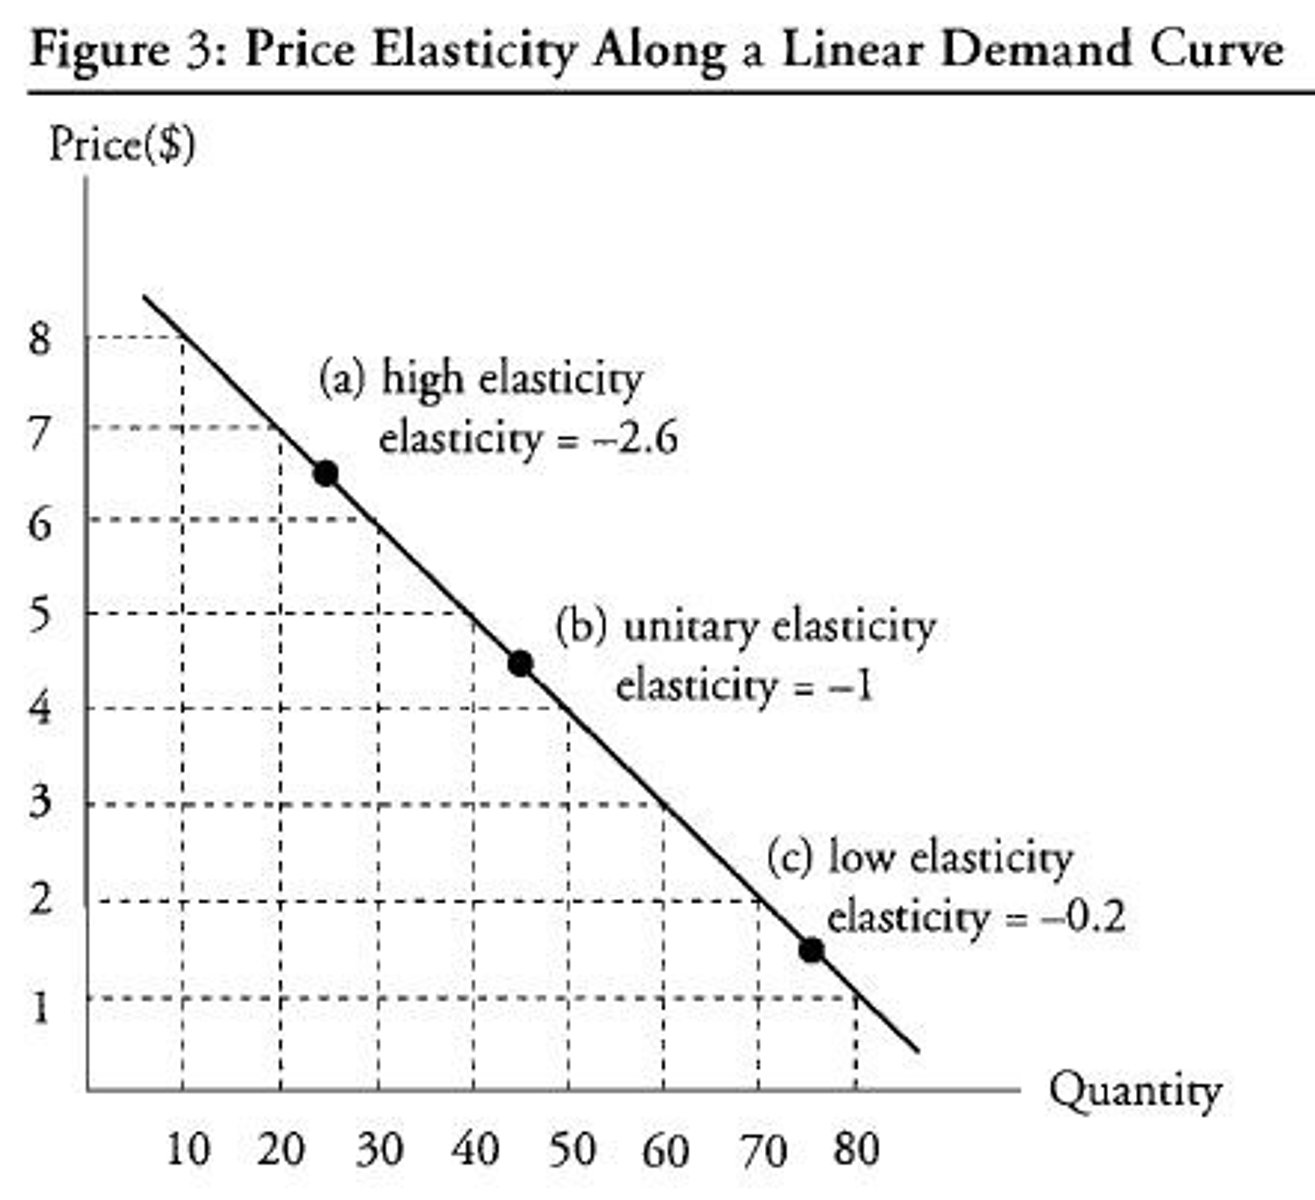
Elasticity along a downward sloping linear demand curve
changes along the curve.
In regression analysis, the explanatory variables
are the factors that are thought to affect the dependent variable.
If the price elasticity of demand for a good is less than one in absolute value, economists would characterize consumers of this good
as not very sensitive to price.
If the price of a slice of pizza rises from $2.50 to $3, and quantity demanded falls from 10,000 slices to 7,400 slices, calculate the arc price elasticity.
-1.64
Horizontal and vertical demand curves
have constant elasticities.
If demand is elastic
then a 1% decrease in price leads to a rise in quantity of greater than 1%.
A regression analysis with ________ explanatory variables is called a ________.
two or more; multivariate regression
If the demand for orange juice is expressed as Q = 2000 - 500p, where Q is measured in gallons and p is measured in dollars, then at the price of $3, the demand curve
is elastic.
3 assumptions about properties of consumers' preferences
-completeness
-transitivity
-more is better
indifference curve
the set of all bundles of goods that a consumer views as being equally desirable
marginal rate of substitution (MRS)
shows the rate at which a consumer can substitute one good for another while remaining on the same indifference curve. (slope of line)
marginal utility
extra utility received from consuming one more unit of a good.