Regression 1 - term 2 (L3)
1/29
There's no tags or description
Looks like no tags are added yet.
Name | Mastery | Learn | Test | Matching | Spaced | Call with Kai |
|---|
No analytics yet
Send a link to your students to track their progress
30 Terms
What is correlation?
An association or dependency between two independently observed variables.
What is an example of correlation?
Cloud cover correlates with probability of rainfall
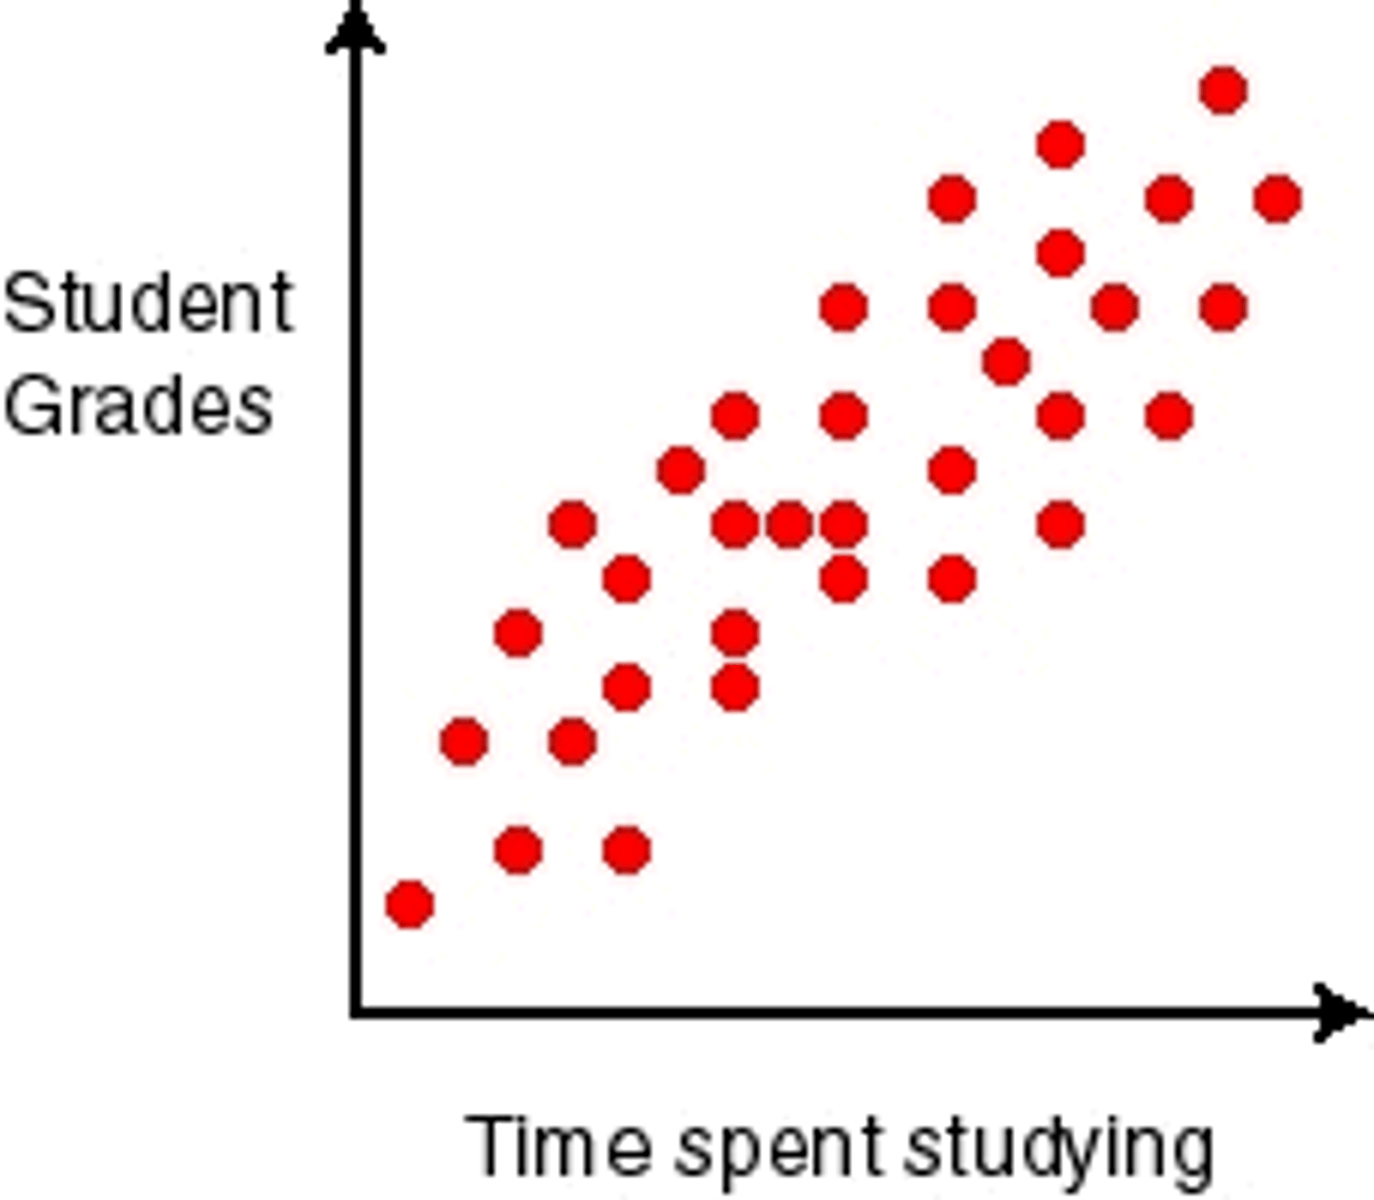
What can be used to visualise a correlation in statistics?
A scatterplot.
- each data point is a single subject
What do we mainly want to measure in a correlation?
How strong the association is between X and Y
(statistical relationship)
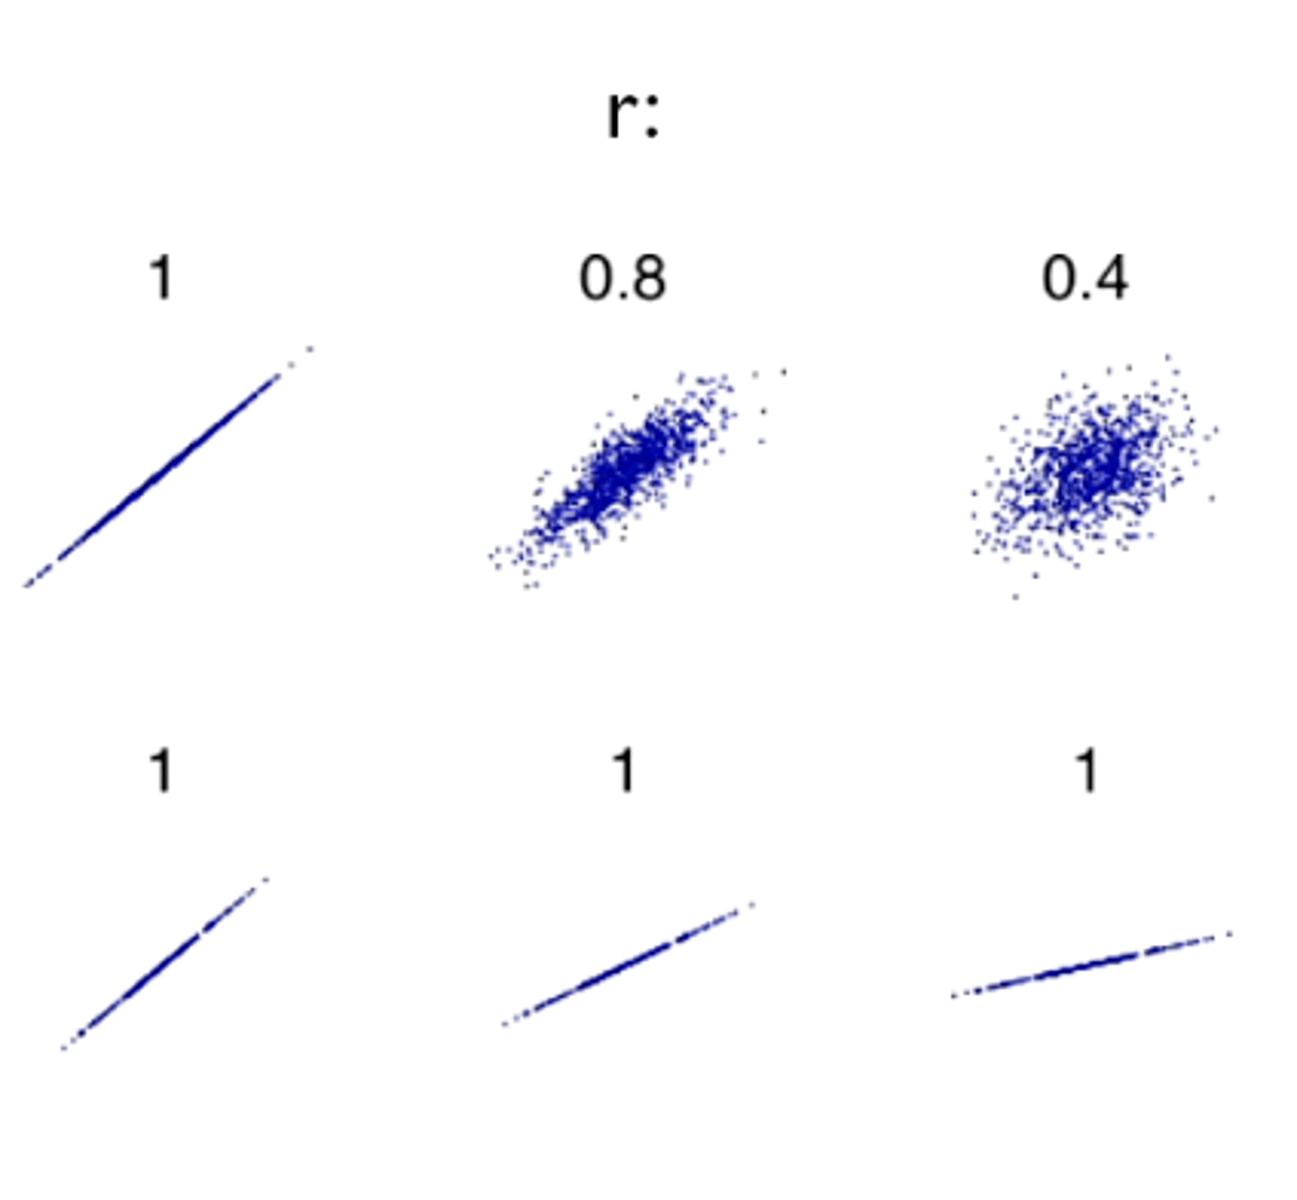
What score would indicate X and Y are completely independent of each other?
0.0
What score would indicate X and Y are identical to each other?
1.0
What score would indicate X and Y are exactly inverse to each other?
-1.0
What is a correlation score called?
A Pearson correlation coefficient
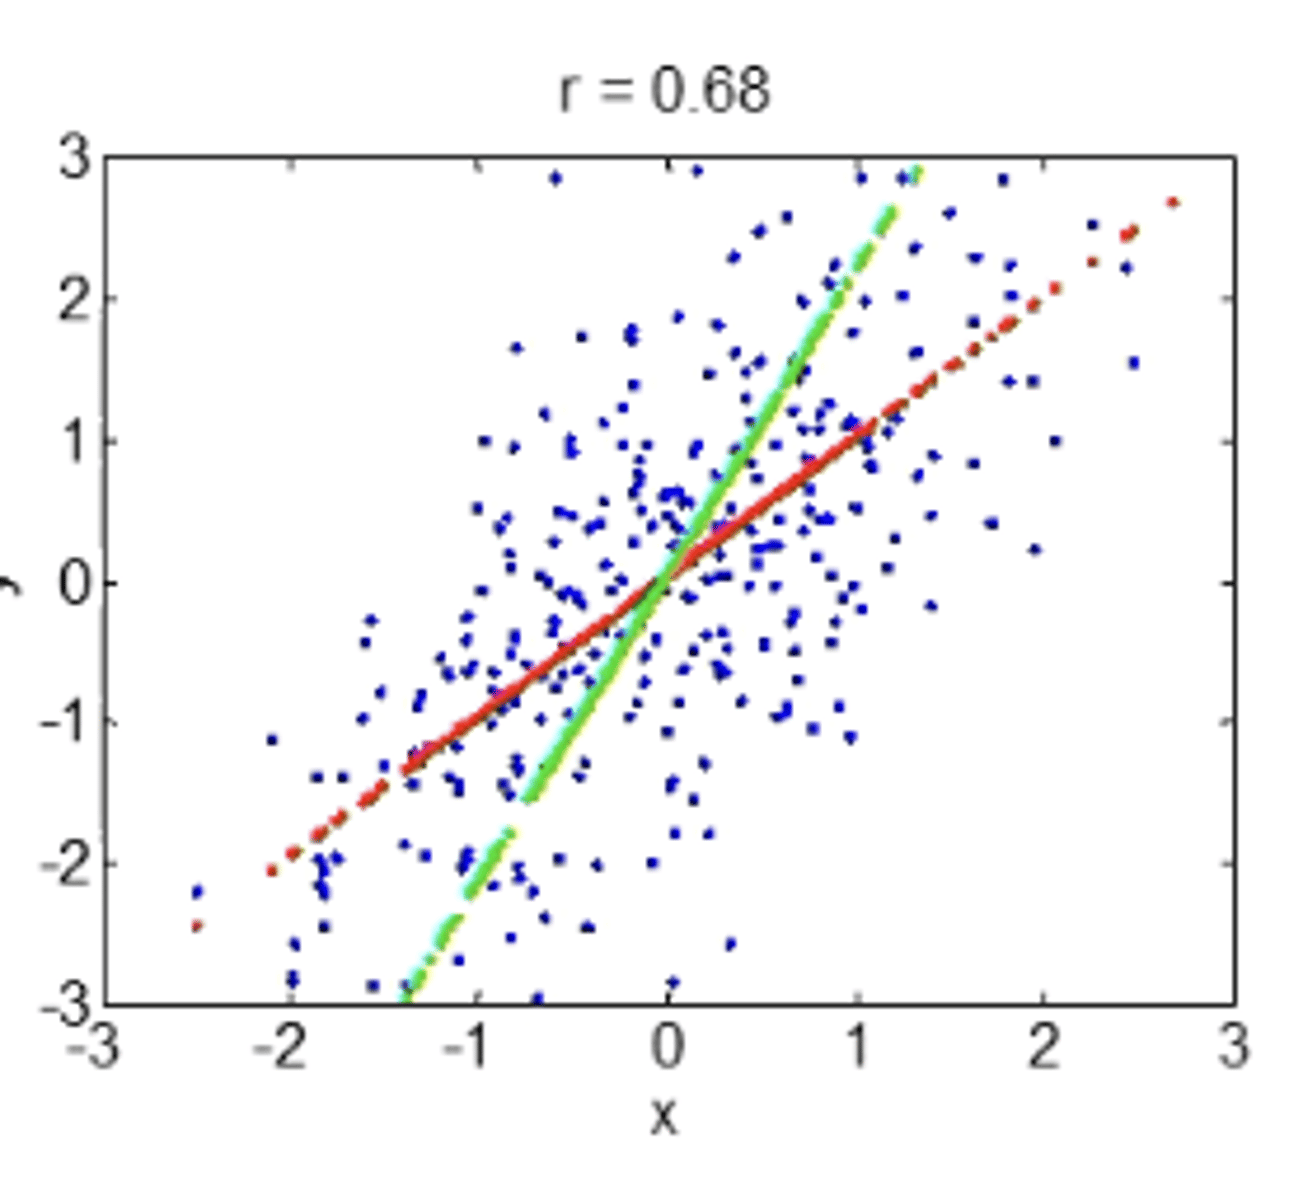
in a scatterplot, what indicates a strong correlation?
how close together the points lie (on the same line)
what type of variable is a pearson coefficient used for?
interval /ratio
what type of variable is a spearaman's rank or kendall's coefficient used for?
Ordinal scale (rank)
- size of differences between numbers are not related to magnitude.
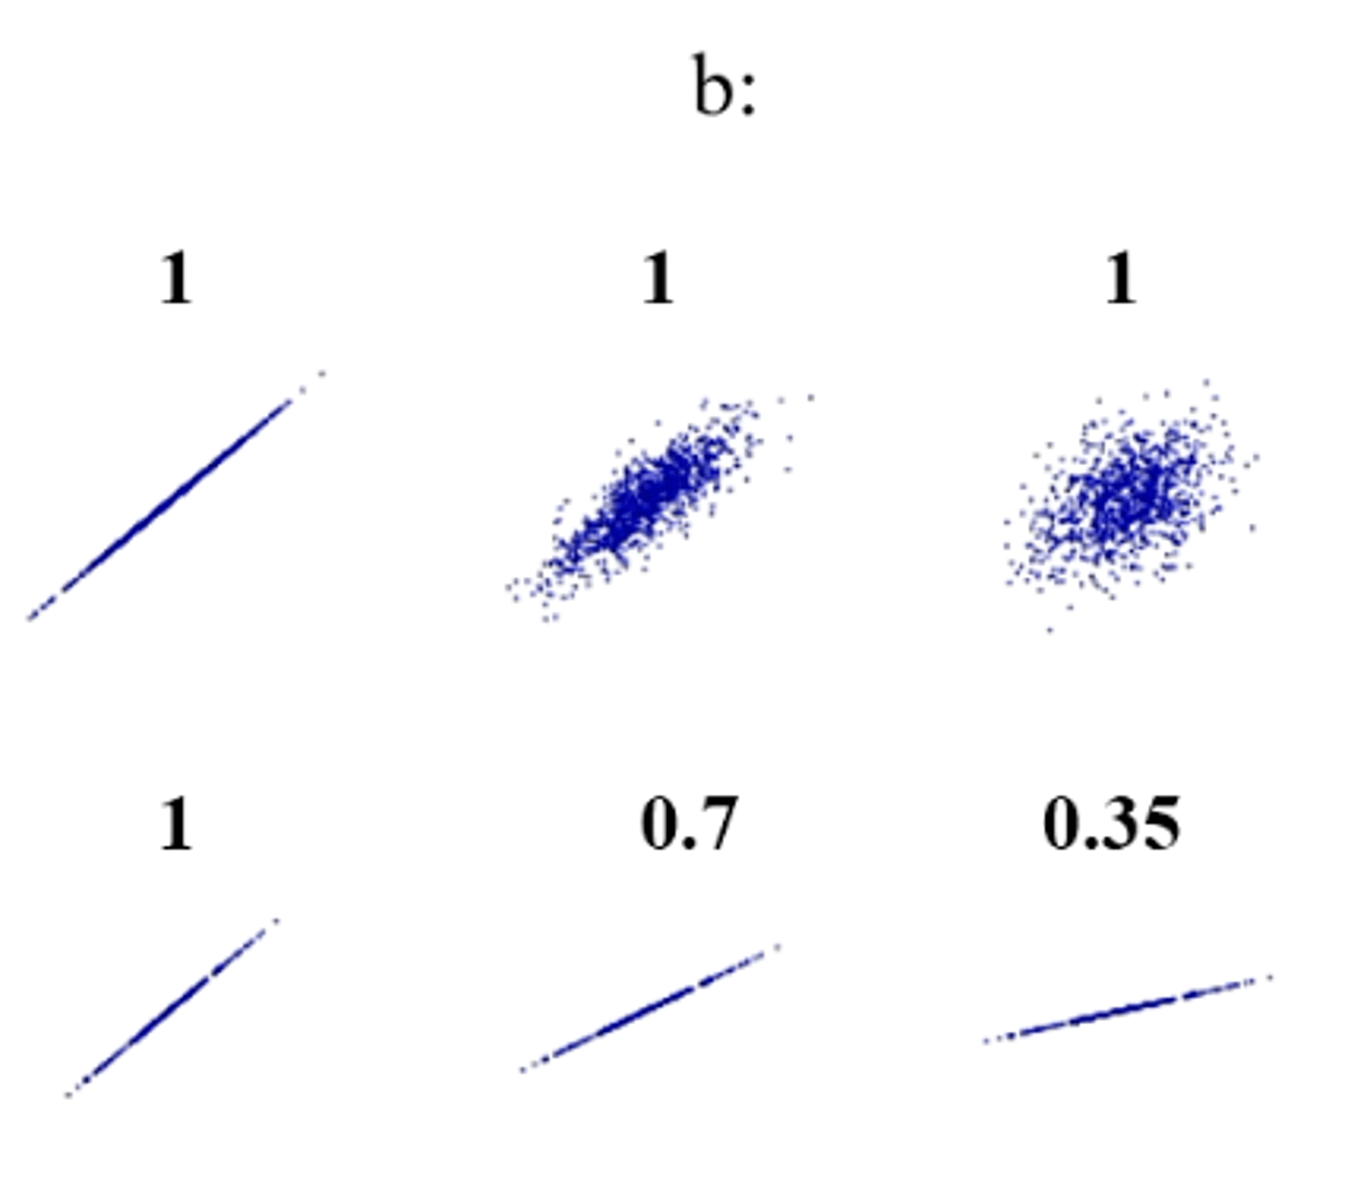
What does a regression correlation represent?
The slope of the effect of one variable on the other.
- the shallower the slope the smaller the regression-coefficient
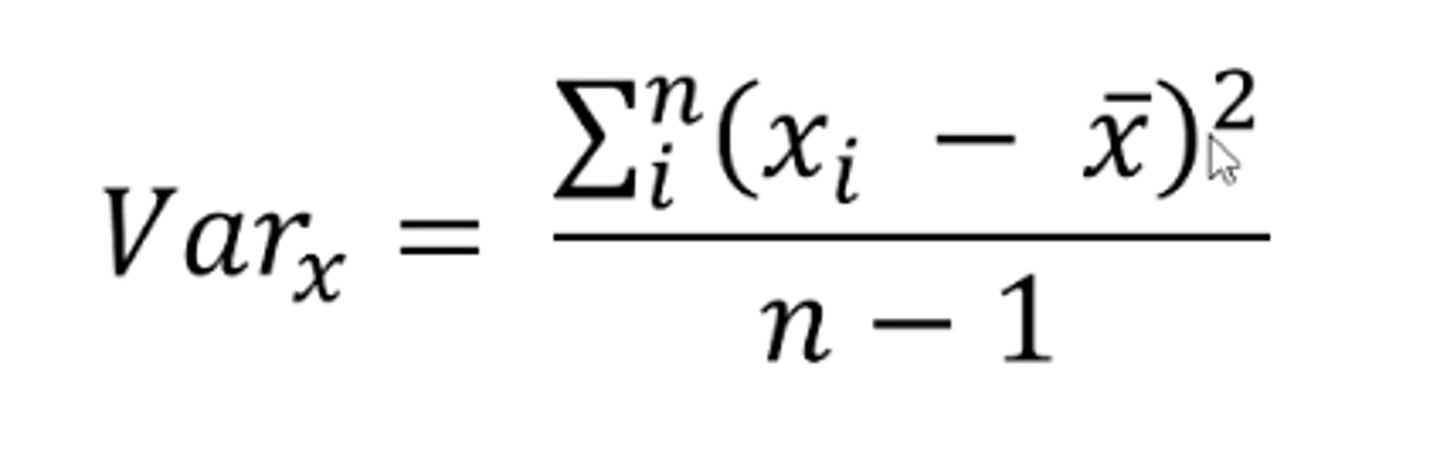
How do you calculate variance?
Subtract each individuals score from the sample mean, square it and then divide it by n-1
How do you calculate the Standard deviation?
Square-root the variance
what % of cases lie within a normal distribution?
68%
how do we measure covariance?
multiply the differences of each element from the mean of its own variable x with each other and then sum and divide by n-1
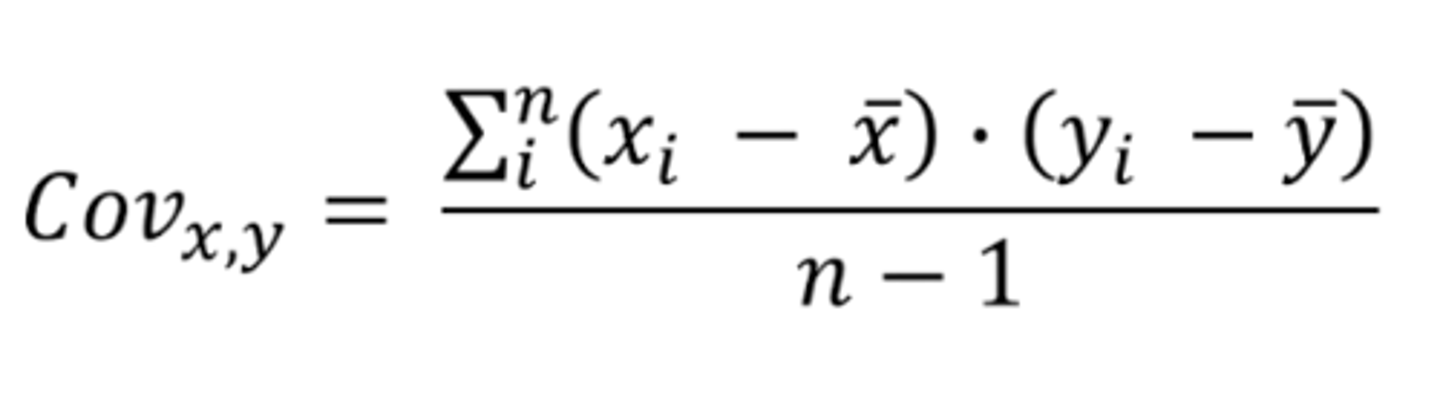
the more similar the variables of X and Y are...
The greater the covariance.
- highly similar = larger correlation value
what does a indiciate in a linear regression?
the slope (the variable that stands before x)
what does b indicate in a linear regression?
the y-intercept
what is a y intercept?
the point where the regression line cuts through the y axis) . It has the coordinates (0, y)
How are variance and sum of squares related?
the variance is the sum of squares divided by n-1.
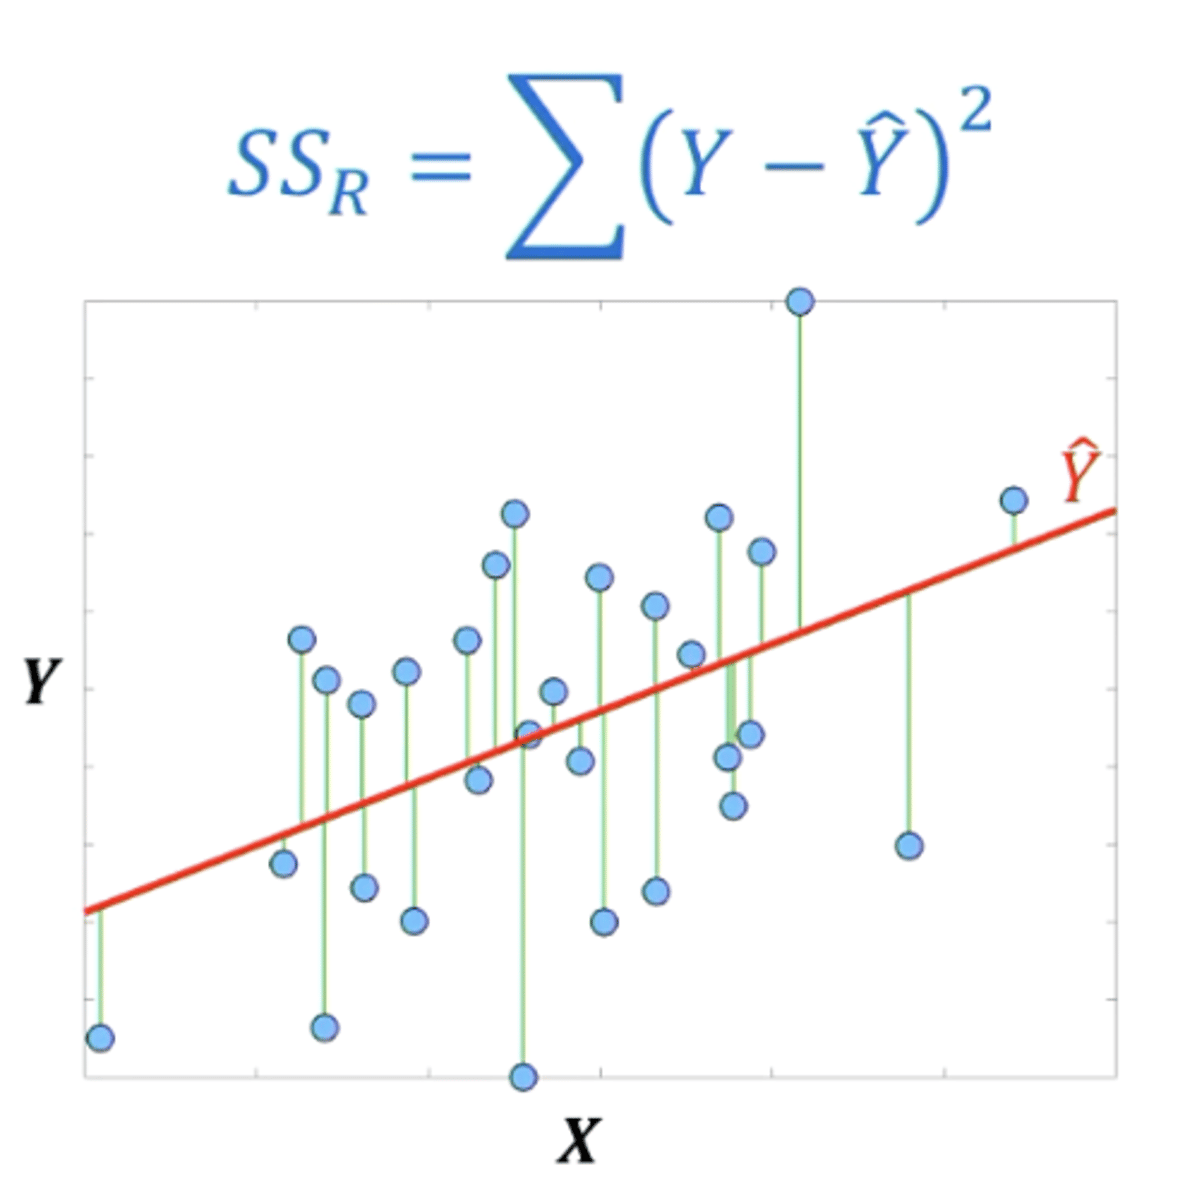
How do you work out the ERROR variance?
look at the differences of each empirical data point in y to the predicted values from the regression line along the dimension of y (the residual variance)
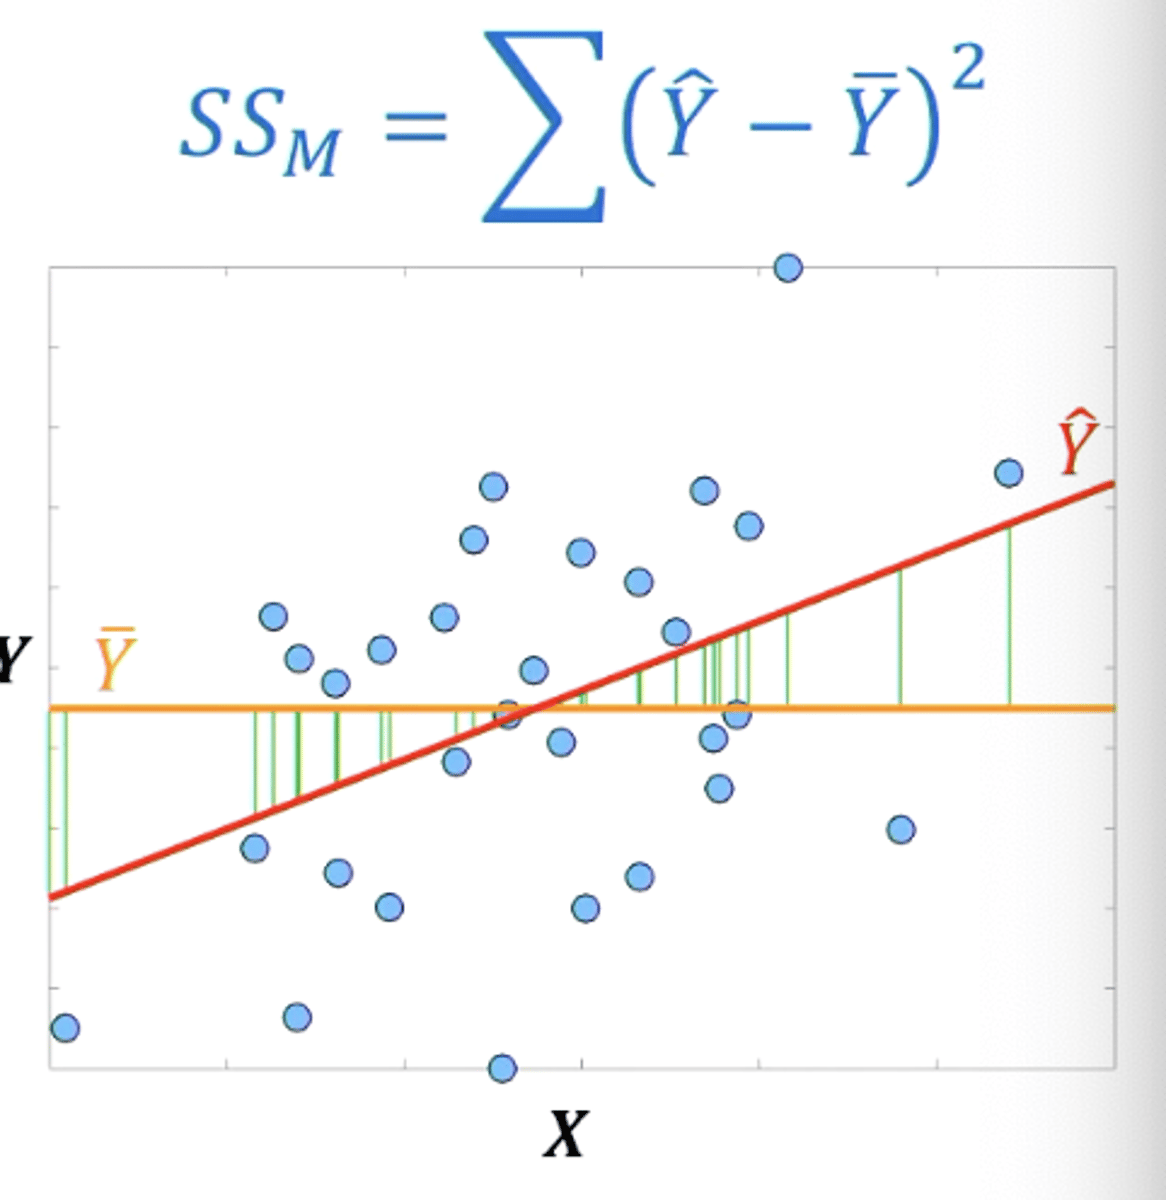
How do you work out the REGRESSION variance?
The sum of the individual predicted values of y in the data set subtracted by the empirical mean value of y.
then sqaured
if there is a deterministic relationship between X and Y, what should the prediction error be?
0
what does regression allow?
it allows prediction of the value of one based on the other.
unlike in correlations, regression of y on x is...
NOT the same as regression of x on y.
what is set normalisation?
when a variable is subtracted from the mean and then divided by the standard deviation of the variable.
- 'z-normalised'
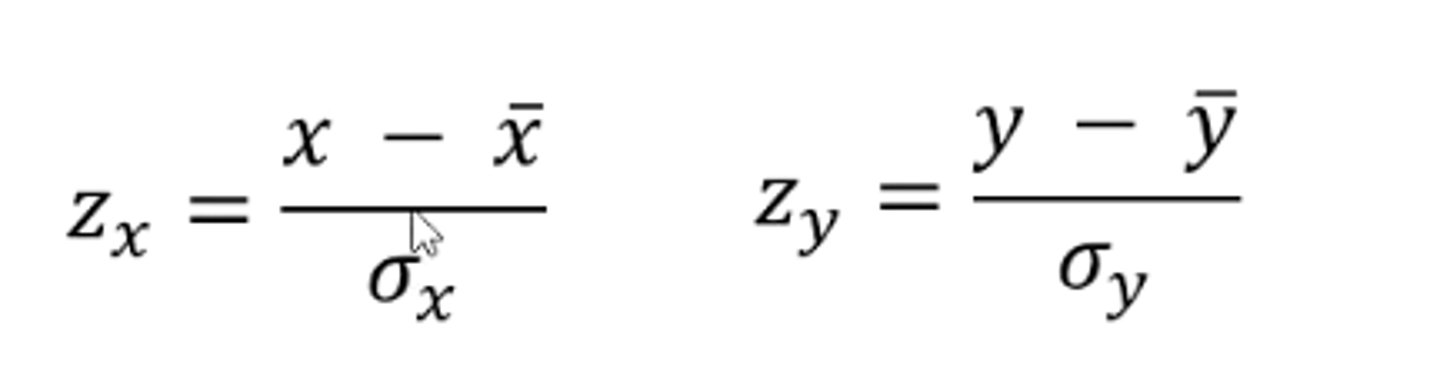
What does it mean if x and y have been z-normalised?
the regression coefficient expresses the strength of the correlation also (statistical relation)
what would a null hypothesis be in regression analysis?
There is no relation between x and y, so the regression slope would be 0 (flat)
What is the standard error of the slope?
The test size against which the regression slope is tested.