BIO307 - Ecology
1/103
There's no tags or description
Looks like no tags are added yet.
Name | Mastery | Learn | Test | Matching | Spaced | Call with Kai |
|---|
No analytics yet
Send a link to your students to track their progress
104 Terms
Ecology
the scientific study of the relationship between organisms and their environment
Heterogeneity
non-uniformity; natural systems are highly non-uniform at multiple scales
Climate
Uneven heating of the Earth’s surface drives air movement and weather systems
Uneven heating
Angle of incidence of sun’s rays is positively correlated with the amount of heating; heat spread over larger areas with low angles of incidence at poles
El Niño/La Niña
Changes in atmospheric pressure affect ocean currents, decade-scale
Milankowitch cycles
Changes in Earth’s orbit and tilt of its axis, long-term glacial/interglacial cycles of 100,000 year periods
Hadley cells
creates high precipitation areas at equator with rising hot air and deserts 30º out with falling cool air.
Ocean currents
Affects regional climate, the ocean has a stabilizing affect on local climate
Aspect
direction of a surface or slope
N/S slopes
Generally warmer and less vegetated on S slopes in N-hemisphere.
Tilt causes S slopes to get more direct sunlight, snow melts faster, too fast for plants too use.
E/W slopes
Generally warmer and more vegetated on W slopes versus.
Land has more time to heat up before W slopes get direct sunlight, better for photosynthesis.
Soil Depth
Shifts with slope position, water storage
Albedo
Reflectance of a surface
high albedo high reflectance
implications with drying and nutrients
Soil texture
the triangle, water retention
Aquatic environments are ___ to T due to ___
less, high capacity of water
Water has ___ albedo
Low, absorbs lots of radiation
Thermal Stratification (vertical)
T varies with depth, seasonal turnover, thermocline
Benthic Zone
bottom and sides of stream channel
lowest ecological region
Hyporheic Zone
substrate below and adjacent to stream
Riparian Zone
adjacent terrestrial area
riffles
shallower, faster zones
pools
deeper, slower zones
Biomes
Characteristic types of vegetation determined by large-scale climactic variation
Climate diagrams
0’s match and T:P is 1:2
P below T is a drought period, Insufficient precipitation to facilitate plant growth
Rules to robust experimental design
Designed to test a particular hypothesis
testable hypothesis
can infer causation within scope of inference
Must include replicated experimental units
to which treatments are applied
no pseudoreplication
Treatments must be assigned randomly
random assignment
Must control for variation
minimize effect of outside factors
keep other factors same for all replicates/treatments or at least account for it
Inferring Causation
BACI: Before/After, Impact/Control site for observational studies while following rules
Treatments must be established with respect to the independent/explanatory variable in order
Evolution
change over time in the heritable characteristics of a population;
change in allele frequency over time
Mechanisms of Evolution
Mutation
Natural Selection
Genetic drift
Gene flow
Non-random mating
Proximate (Immediate) Cause
how the behavior occurs; mechanistic
Ultimate Cause
why the behavior occurs; evolutionary or historical reason
Evolutionary Approach to Behavior
ability to survive and reproduce is in part dependent on behavior so nat sel should favor individuals whose behaviors make them fitter
Gene-Environment Interxn
Most aspects of animal behavior controlled by both genes and evironment
Optimal Foraging Theory
Animals will maximize the amount of E gained per unit of feeding time and minimize the risks involved
Marginal value theorem
Food may be depleted in a patch after spending some time there;
GUD: density of prey items where it is energetically favorable to move to a new patch
Mating Behaviors
Males may provide females with direct or indirect benefits;
Compared to males, females invest more time and energy, and have less offspring;
Selection should favor mating behaviors that:
protect the female’s investment (choosing a good mate → females are pickier)
allow males to mate with as many females as possible
Life History
a record of events relating to an organism’s growth, development, and reproduction as well as its survival.
Life History Strategies
the overall pattern in the average timing and nature of life history events;
determined by division of t and E between growth, repro, and survival;
Individuals within a species show variation;
Nat sel favors individuals with life history strategies which make them fitter
Phenotypic plasticity
One genotype may produce diff phenotypes under diff env conditions;
Can produce continuous range of growth rates;
Can produce discrete types –– called morphs
Differences between asexual and sexual reproduction
Asexual reproducers have a more rapid growth rate compared to sexual reproducers;
Sexual reproducers are better at adapting to changing env conds;
In asexual reproduction, favorable gene combinations are far less likely to be broken up;
ex: Daphnia
Semelparous
only reproduce once; then DIE
Iteroparous
can reproduce multiple times; little whores
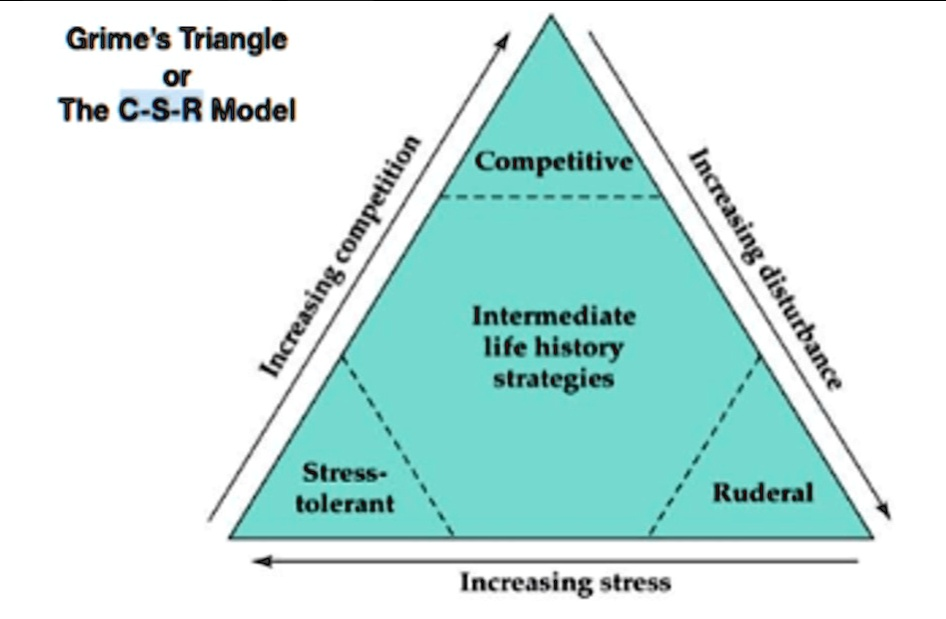
r-selection
selection for high pop growth rates;
uncrowded or newly disturbed environments;
High fecundity, low survivorship
K-selection
selection for slower growth rates in pop that are at or near K;
in crowded conditions, efficient reproduction is favored;
Low fecundity, high survivorship
Trade-Offs
organisms allocate limited E to one structure/function at the expense of another
Grime’s triangle model
Tolerance versus Avoidance
Staying put and dealing with it versus moving away from change
Fundamental Principle of Environmental Variation
geographic ranges of species are related to constraints imposed by the environment
Stress
environmental change results in decreased rates of physiological processes;
lower potential for survival, growth, or reproduction;
distinct from disturbances (discrete event)
Acclimatization
organisms adjusting to stress through changes in behavior or physiology;
NOT adaption (change in pop over time)
Absolute density measures
# per area/volume;
total count or census of small area → subsampling;
transect line with quadrats along it
Relative density measures
sampling with a constant but unknown relationship to true data;
Catch per Unit Effort (CPUE)
Metapopulation
A group of population linked by dispersal (gene flow)
Dispersal
movement from birthplace;
distance, patch size, transport methods
Population vortex
when population decreases, genetic variation reduces and reduces ability of pop to respond to env change;
feedback loop;
high frequency of inbreeding
Env stochaticity
unpredictable changes in the environment that can cause extinction of small populations
Exploitation competition
species compete indirectly through their mutual effects on the availability of a shared resource
Interference competition
species compete directly for access to a resource
Competitive exclusion
If the niche of a weaker competitor is shared with a stronger competitor, the stronger competitor will likely drive the weaker one to extinction
Competition exclusion principle
two species that use the same limiting resource in the same way cannot coexist
Lotka-Volterra Competition Model
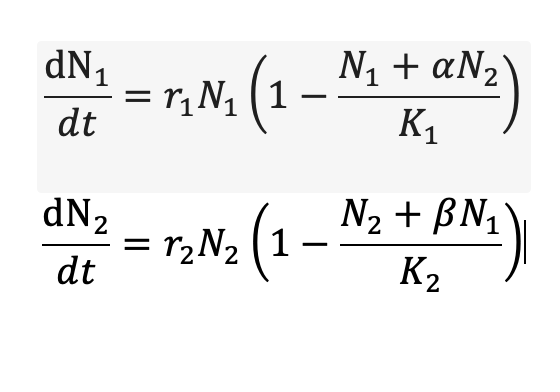
Nx = pop. density of species x
rx = intrinsic rate of increase of species x
Kx = carrying capacity of species x
α = effect of species 2 on species 1
β = effect of species 1 on species 2
Intermediate disturbance hypothesis
Disturbance can kill some while creating opportunities with others;
Highest diversity at intermediate level of disturbance
Character displacement
Nat sel results in competing species becoming more diff over time
Generalist predator
eat a broad range of prey items, w/o showing preference
Specialist predator
do show a preference, narrower range of prey
Herbivore diet
can be grouped by what part of plant they eat;
generally narrow diet
Anti-predator adaptions
large size, rapid vs agile movement, body armor, toxins, aposematic (warning) coloration, crypsis/camouflage/mimicry, living in groups
Anti-herbivory adaptions
compensatory growth –– herbivory triggers growth
physical defenses –– tough leaves, thorns, spines, pernicious hairs, saw-like edges
secondary compounds –– compounds that reduce herbivory. Some are toxic to herbivores, others attract predators or parasites/oids.
Constitutive defenses
Always on;
Often phys but chem too
Induced defenses
Stimulate by herbivore attack;
Often chem but phys too
Endemism
Species that are native and unique to a geographic area;
Seen in islands and island-like things
The latitudinal gradient hypothesis
Terrestrial: species richness is highest at equator and decreases towards the poles
higher rate of species diversification in tropics
evolutionary timeline is greater in tropics (glacial)
Higher productivity results in more abundant resources in the tropics
Marine: reversed, highest towards the poles and decreases towards the equator
Filter analogy
Local community structure is a function of a series of abiotic and biotic filters
Ecosystem engineers
species that affect the environment
Topographic relief gradient
More species in mountainous regions, especially mammals
Biodiversity hotspot
a biogeographic region that is both a significantly reservoir of biodiversity and is threatened with destruction
Complementarity hypothesis
As species richness increases so does ecosystem function
Redundancy hypothesis
As species richness so will ecosystem function to a leveling off point
Idiosyncratic hypothesis
relationship will vary because some species have stronger effects than others
1º production
autotrophic fixation of carbon
2º production
heterotrophic assimilation of organic matter
Net primary production equals
gross primary production subtracted by respiration
Eutrophication
increased nutrients in lakes;
aging of lakes;
natural process exacerbated by humans
Streams are ___ limited
“storage”
Lakes are often ___ limited
P
wetlands are generally ___ limited
N
River Continuum Concept
explains the predictable gradient that rivers exhibit;
based on nutrient availability, E sources, and downstream transport of organic matter;
RCC → biotic components of ecosystem, predictable
Wetlands
Salt marsh more productive than freshwater;
often not very biodiverse
Detritus
Accumulates more in terrestrial vs aquatic ecosystems
Allocthonous
PP derived from outside of stream
Autocthonous
In-stream PP
2nd Law of Thermodynamics
During transfer of E, some is lost;
Energy decreases w/ increased trophic levels
Relationship between E and biomass across trophic levels
In terrestrial ecosystems, E increases with biomass and both decrease with trophic levels;
In aquatic ecosystems,
E decreases with biomass
E decreases with trophic levels
biomass increases with trophic level
Herbivores and plants: Terra vs Aqua
Terra herbivores consume lower prop of autotroph biomass;
Aqua plants require less cellulose, easier to digest;
Aqua plants more nutritious while terra more defensive;
Terra herbivores more constrained by predators
Trophic Cascades
A series of trophic interxns that result in changes in biomass ad species composition;
Bottom-up or Top-down
Factors affecting trophic levels
Energy: amount of PP, more = more levels
Disturbances: more frequent = less levels
Ecosystem size: bigger is better––larger ecosystem support larger pops, have more habitat heterogeneity, and higher species diversity
Biogeochemistry
The study of the phys, chem, and biological factors that influence the movement and transformation of elements
C:N ratios
Animals have lower C:N ratio than plants, herbivores must consume more than carnivore to get N
Soil Parent Material
Bedrock, Till (glaciers), or Loess (wind)
Leeching (Soil)
Movement of dissolved particles from upper to lower layers (or horizons)
HIPPO
Habitat loss
Invasive species
Pollution
Population (human)
Overharvesting