66 Lesson 3: DuPont Analysis, Equity Analysis, Credit Analysis, and Business and Geographic Segments
1/48
There's no tags or description
Looks like no tags are added yet.
Name | Mastery | Learn | Test | Matching | Spaced |
|---|
No study sessions yet.
49 Terms
What are the uses of the decomposition of ROE?
Facilitates evaluation of various aspects of the company's performance affecting ROE.
Identifies reasons for changes in ROE over time.
Explains differences in ROE among different companies.
Guides management in improving ROE.
Demonstrates the relationship between different categories of ratios and their impact on owner returns.
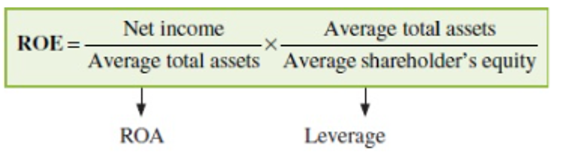
What is the Two-Way Dupont Decomposition?
It breaks ROE into two components → ROA and Financial Leverage Ratio.
(Net Income/ Average Total Assets)*(Average Total Assets/ Average Shareholders Equity)
A company can improve ROE by improving ROA or increasing its reliance on debt for financing.
When can using debt effectively boost ROE?
When the return on borrowed funds exceeds the borrowing cost.
What happens if borrowing costs surpass the returns generated from borrowed funds?
It can lead to a decline in both ROA and ROE.
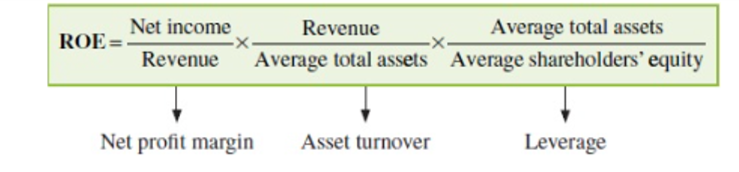
What is the Three-Way DuPont Decomposition of ROE?
It expresses ROE as the product of three components: Net Profit Margin, Asset Turnover Ratio, and Financial Leverage Ratio.
(Net Income/Revenue)*(Revenue/Average Total Assets)*(Average Total Assets/Average Shareholders Equity)
Net Profit Margin: Indicates profitability, showing profit generated per unit of sales.
Asset Turnover Ratio: Indicates efficiency, revealing revenue generated per unit of assets.
Financial Leverage Ratio: Reflects solvency, comparing total assets to equity capital.
What does ROA (Return on Assets) represent in relation to the Three-Way DuPont Decomposition?
ROA is a function of both profitability (net profit margin) and efficiency (asset turnover).
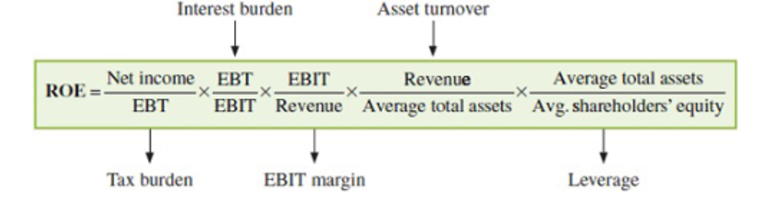
What is the Five-Way DuPont Decomposition of ROE used for?
It is used to separate the effects of taxes and interest on ROE by breaking it down into five components:
(Net Income/EBT)*(EBT/EBIT)*(EBIT/Revenue)*(Revenue/Average Total Assets)*(Average Total Assets/Average Shareholders Equity)
Tax Burden Ratio: It represents the portion of pretax profits retained by the company, calculated as (1 - average tax rate). A higher tax burden ratio implies the company can keep a higher percentage of its pretax profits.
Interest Burden Ratio: Reflects the impact of interest expenses on ROE. High borrowing costs reduce ROE.
EBIT Margin: Captures the effect of operating profitability on ROE.
Asset Turnover Ratio: Indicates overall efficiency.
Leverage Ratio: Compares the total value of assets to equity capital.
How does DuPont analysis help in understanding ROE changes?
DuPont analysis helps reveal changes in ROE driven by shifts in company operations, such as changes in profit margins, asset turnover, and leverage.
What are some general principles regarding ROE and its components?
Higher profit margins, asset turnover, and leverage generally lead to higher ROE. However, increasing leverage may not always boost ROE, as higher interest costs can reduce the interest burden ratio, offsetting the impact of increased financial leverage.
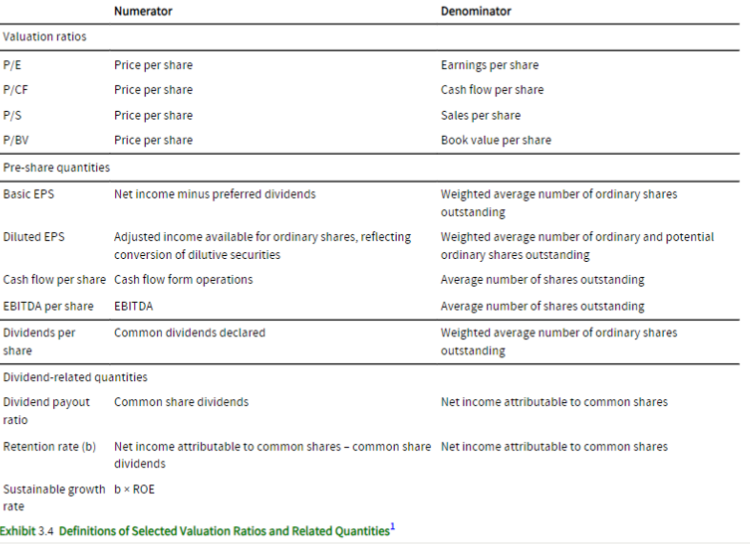
What does the Price-to-Earnings Ratio (P/E) measure?
It measures the relationship between a stock's price and its earnings per share, showing how much investors are willing to pay per dollar of earnings.
How is the Price-to-Cash Flow (P/CF) ratio calculated?
It's calculated as Price per share divided by Cash flow per share, measuring the relationship between a stock's price and its cash flow per share.
What does the Price-to-Sales (P/S) ratio express?
It expresses the stock's price in relation to its sales per share.
What does the Price-to-Book Value (P/BV) ratio reflect?
It reflects the stock's price compared to its book value per share.
How is Basic EPS (Earnings per Share) calculated?
Basic EPS is calculated as (Net income - Preferred dividends) / Weighted average number of ordinary shares outstanding, representing earnings attributable to each common share.
What is the purpose of Diluted EPS (Earnings per Share)?
Diluted EPS accounts for the potential dilution of earnings from convertible securities.
How is Cash Flow per Share calculated?
Cash Flow per Share is calculated as Cash flow from operations / Average number of shares outstanding, indicating the amount of cash flow generated per share.
What does EBITDA per Share represent?
EBITDA per Share represents EBITDA (Earnings Before Interest, Taxes, Depreciation, and Amortization) per share.
EBITDA / Average number of shares outstanding
What does Dividends per Share show?
Dividends per Share shows the amount of dividends distributed to each common share.
Common dividends declared / Weighted average number of ordinary shares
What does the Dividend Payout Ratio measure?
The Dividend Payout Ratio measures the percentage of earnings paid out as dividends to shareholders.
(Common share dividends / Net income attributable to common shares)
What does the Retention Rate indicate?
The Retention Rate indicates the percentage of earnings that a company retains and reinvests in the business.
(Net income attributable to common shares - Common share dividends) / Net income attributable to common shares
How is the Retention Rate calculated, and how does it relate to the Dividend Payout Ratio?
(Net income attributable to common shares - Common share dividends) / Net income attributable to common shares
It complements the Dividend Payout Ratio, as Retention Rate = (1 - Dividend payout ratio).
What is the Sustainable Growth Rate, and how is it calculated?
The Sustainable Growth Rate reflects the company's ability to sustain growth by reinvesting earnings. It is calculated as Retention rate × ROE (Return on Equity).
Provide a summary of the valuation ratios
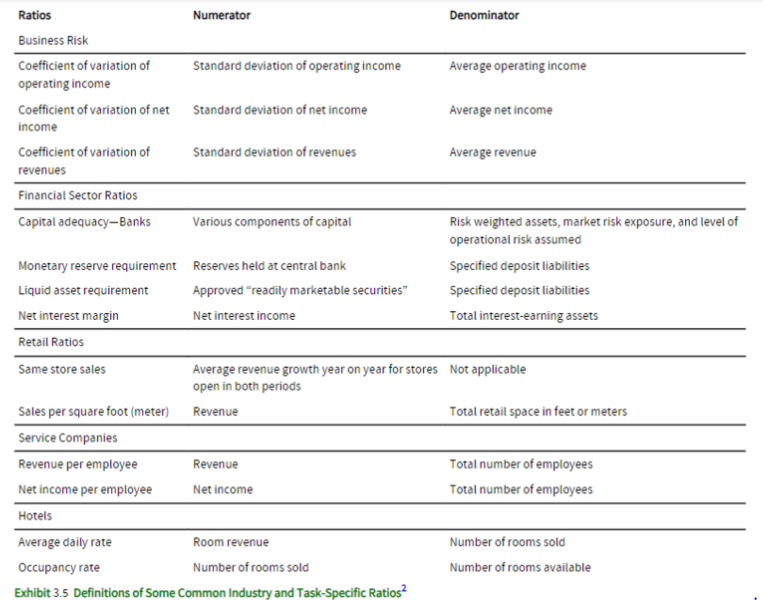
What is the significance of Same Store Sales Growth in the retail industry?
Same Store Sales Growth measures the increase in sales at existing stores, excluding sales generated from new store openings. It helps evaluate the effectiveness of a company's retail operations and customer loyalty.
In which industries are Regulatory Ratios commonly used?
Regulatory Ratios are commonly used in regulated industries such as banking.
Examples of Regulatory Ratios in the banking industry include liquidity ratios and cash reserve ratios.
What is the primary purpose of Regulatory Ratios in regulated industries?
Regulatory Ratios ensure compliance with industry-specific regulations.
What do Capital Adequacy Ratios assess in the banking industry?
Capital Adequacy Ratios assess a bank's solvency relative to its risk exposure, helping to ensure the bank's financial stability.
Provide a summary of industry-specific ratios
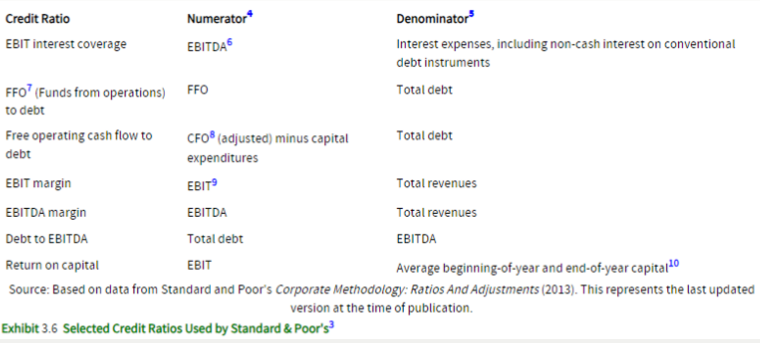
What is involved in the Credit-Rating Process?
The Credit-Rating Process involves analyzing financial reports and assessing a company's operations.
How is credit risk defined?
Credit risk is defined as the risk of loss due to a debtor's payment failure.
What is involved in the Credit-Rating Process?
The Credit-Rating Process involves analyzing financial reports and assessing a company's operations.
It emphasizes the relationship between a company's business risk profile and financial risk.
Which key ratio is used in evaluating credit risk?
ROA (Return on Assets) is used in evaluating credit risk.
What is considered in credit risk assessment related to long-term financial structure?
Long-term D/A (Debt-to-Asset ratio) is considered in credit risk assessment.
Why is the interest coverage ratio significant in evaluating credit risk?
The interest coverage ratio is significant because it assesses a company's ability to cover its interest expenses with earnings.
Which ratio is useful for assessing credit risk by examining the company's ability to generate cash flow to meet debt obligations?
The Cash flow to debt ratio is useful for assessing credit risk.
Provide a summary of credit risk assessment ratios
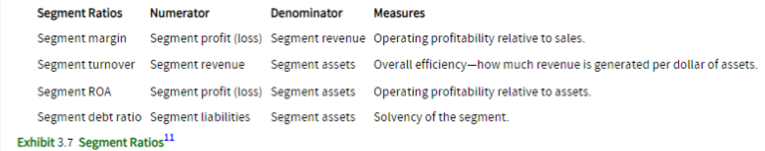
Why do analysts analyze underlying business segments?
Analysts analyze underlying business segments to comprehend the company holistically.
What can business segments include?
Business segments can include subsidiary companies, operating units, or different geographical areas.
How is a Business Segment defined, and what sets it apart?
A Business Segment is defined as a distinct component that provides individual or related products/services. It is subject to unique risks and returns compared to other segments.
What does a Geographical Segment refer to?
A Geographical Segment refers to a distinguishable component that provides products/services within a specific region.
Provide a summary of some segment ratios
What does financial analysis include, and why is it integral in forecasting earnings?
Financial analysis includes common-size and ratio analysis and is integral in forecasting earnings.
What do analysts do during model development for forecasting future performance?
Analysts create models and pro forma financial statements for future performance. They utilize past trends, relationships, and consider expected future events.
How are Pro Forma Income Statements prepared?
Pro Forma Income Statements are prepared using the historical relationship between income statement items and sales.
How are non-sales-driven items typically treated in Pro Forma Income Statements?
Non-sales-driven items may be assumed as fixed or related to balance sheet items (e.g., interest expense linked to long-term liabilities).
What happens to the need for investment in working capital and long-lived assets as a company's scale increases?
As a company's scale increases, more investment in working capital and long-lived assets is needed for expansion.
What does Sensitivity Analysis show?
Sensitivity Analysis shows the range of outcomes with altered assumptions.
What does Scenario Analysis reveal?
Scenario Analysis reveals changes in key financial quantities due to specific events, such as raw material supply loss or demand reduction.
What are Simulations in forecasting techniques?
Simulations are computer-generated sensitivity and scenario analyses based on probability models for outcome-driving factors.