Charts, Diagrams, and Tools
1/27
There's no tags or description
Looks like no tags are added yet.
Name | Mastery | Learn | Test | Matching | Spaced |
|---|
No study sessions yet.
28 Terms
Gantt chart
A visual representation of a project schedule, displaying tasks or activities as bars on a timeline, with their durations and dependencies, providing a clear view of project progress and timelines.
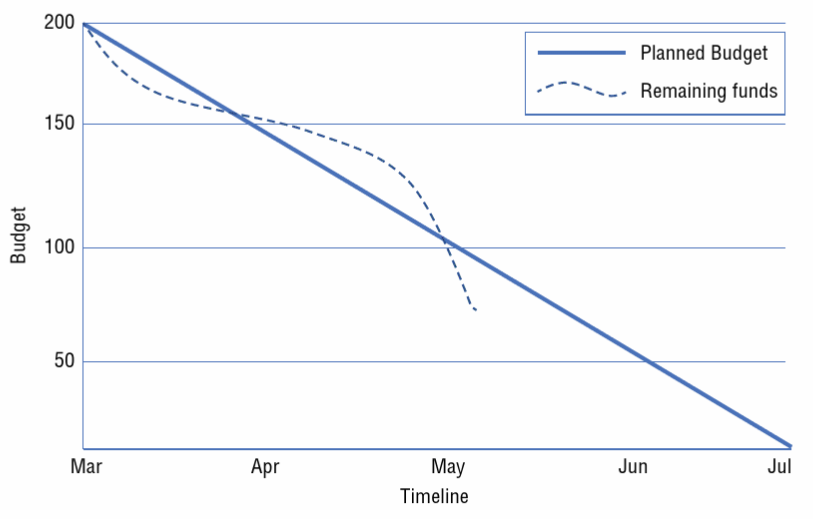
Budget burndown chart
A graphical tool that tracks how project expenses or budgets are being spent over time, helping to monitor and manage financial aspects of a project.
Project network diagram
A visual representation of project activities and their interdependencies, often created using techniques like the Critical Path Method (CPM) or the Program Evaluation and Review Technique (PERT).
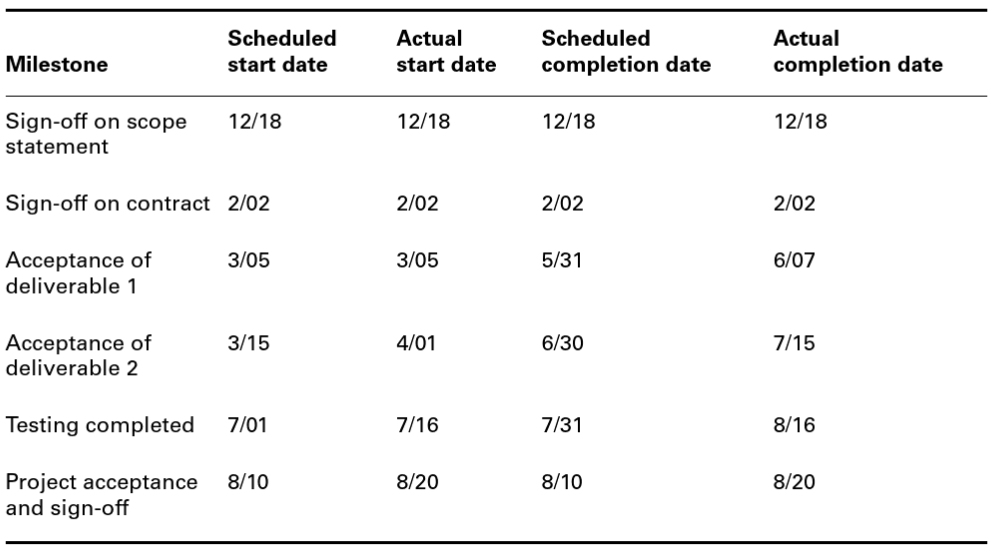
Milestone chart
A visual representation that highlights important project milestones or significant events, offering a snapshot of key accomplishments and progress.
Program Evaluation Review Technique (PERT) chart
A project management tool used to model and analyze the tasks and activities required to complete a project, providing estimates for task duration and identifying critical path activities.
Project organizational chart
Illustrates the project team's structure, roles, and reporting relationships, helping stakeholders understand the project's hierarchy and lines of authority.
Issue log
A document that tracks and records issues, problems, or challenges that arise during a project, along with their status and resolution efforts.
Defect log
A record of defects or bugs identified during testing or quality assurance processes, detailing their nature, severity, and steps taken to address them.
Change log
A record of all changes made to a project, including modifications to requirements, scope, or any other project elements, typically documenting the reasons for each change.
Risk report
Provides an overview of project risks, including their likelihood, impact, and mitigation strategies, to help project stakeholders understand and manage potential threats.
Risk register
A comprehensive document that catalogs all project risks, their characteristics, and their management plans, serving as a central reference for risk management.
Project dashboard
A visual tool that displays key project metrics and performance indicators in real-time, offering a quick overview of project status and health.
Project status report
A regular update on the project's progress, outlining accomplishments, challenges, and the current status of key project elements, helping stakeholders stay informed.
Version control tools
Manage changes to documents and code by tracking versions, enabling collaboration, and ensuring that the most recent and accurate versions are used.
Time-tracking tools
Software applications that help monitor and record the time spent on various project tasks, aiding in project scheduling, resource allocation, and billing.
Task board
A visual management tool, often in the form of a physical or digital board, used to display and track the progress of tasks and activities in a project, especially in Agile methodologies.
RTM
A document that links project requirements to their sources and traces their implementation throughout the project lifecycle, ensuring alignment between requirements and project deliverables.
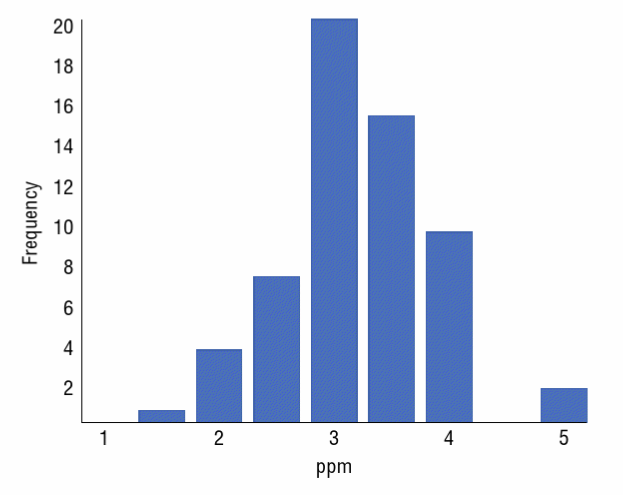
Histograms
Graphical representations of data distribution, showing the frequency or count of data points within specific intervals or bins, helping to visualize data patterns and trends.
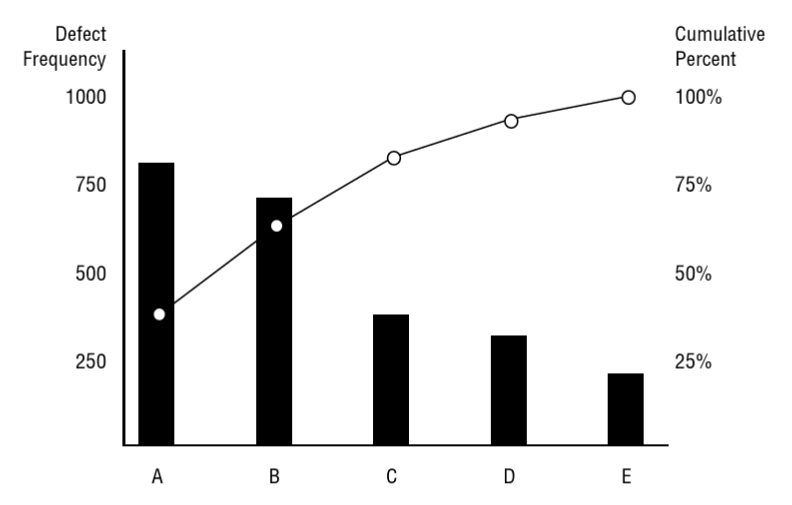
Pareto charts
Combine bar graphs with a line graph, highlighting the most significant factors (often the "vital few") contributing to a particular issue or problem, allowing for focused problem-solving.
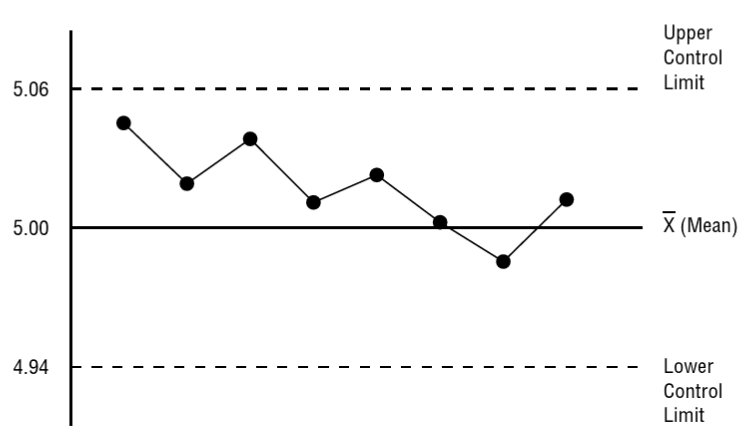
Control charts
Statistical tools that monitor process performance over time, displaying data points in relation to upper and lower control limits, allowing for the identification of process variations and deviations.
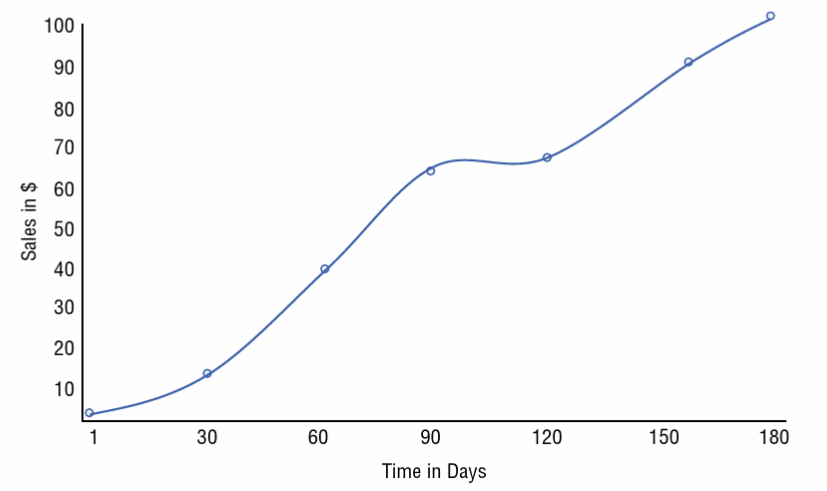
Run charts
Display data points in chronological order, helping identify trends, patterns, or shifts in a process over time, aiding in process improvement efforts.
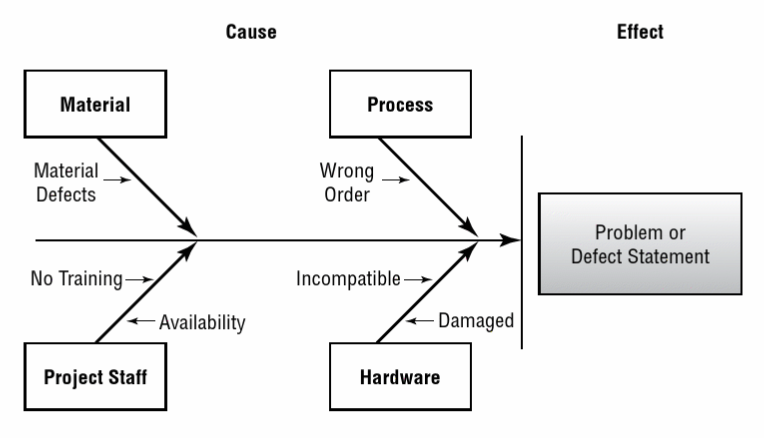
Fishbone/Ishikawa diagrams
Also called cause-and-effect diagrams, visualize the various potential causes of a problem or issue, helping teams identify root causes and solutions.
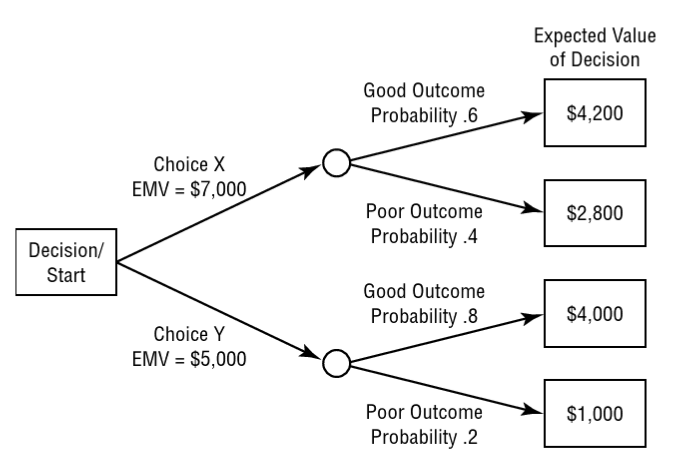
Decision tree
A visual representation of a decision-making process, showing a series of choices or decisions and their potential outcomes, helping in structured decision analysis.
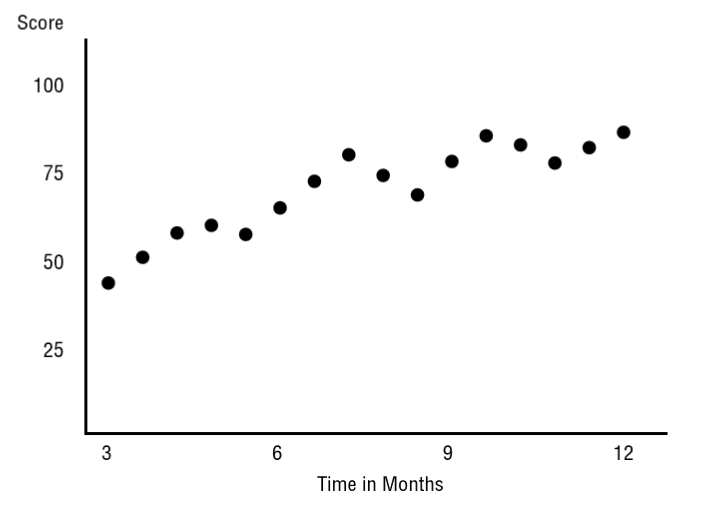
Scatter diagrams
Illustrate the relationship between two variables by plotting data points on a graph, enabling the identification of correlations or lack thereof between variables.
Burndown charts
Visual representations of project progress, tracking remaining work over time, helping teams manage scope and timelines.
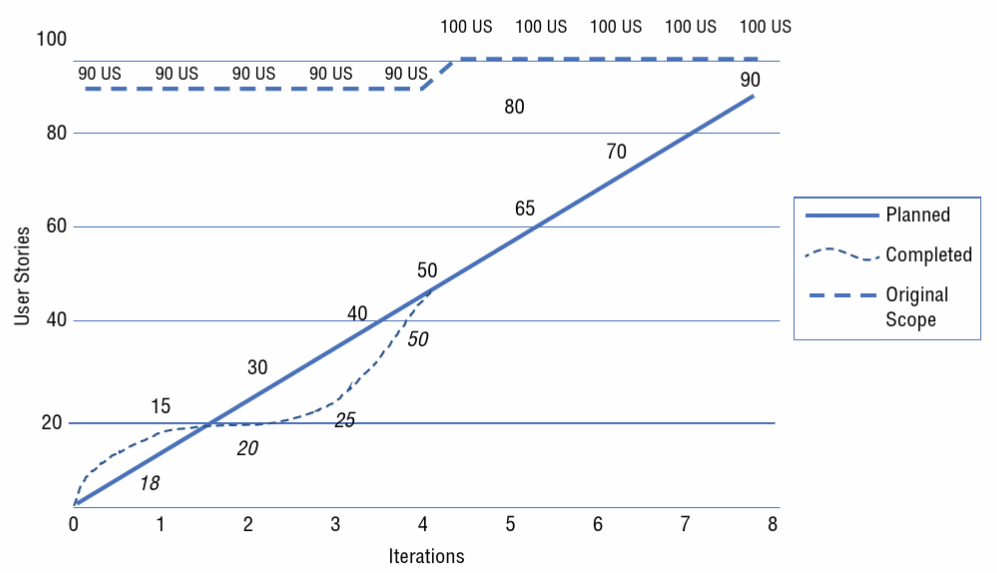
Burnup charts
Visual representations of project progress, tracking completed work over time, helping teams manage scope and timelines.
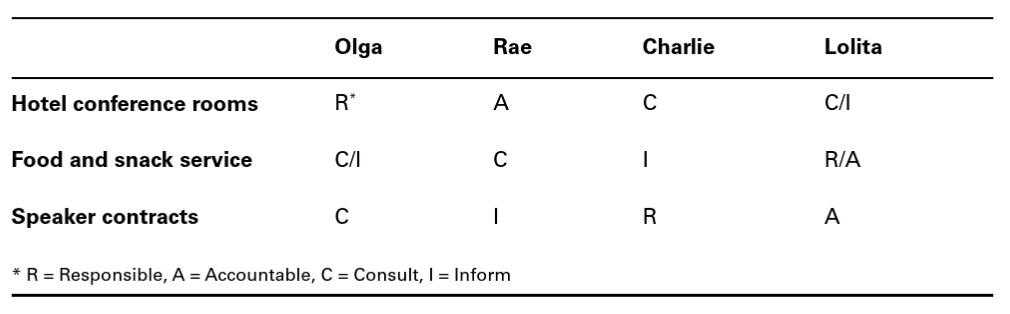
RACI (Responsible, Accountable, Consulted, Informed) chart
A chart with resource names (or the individual names of team members) listed in each column and work elements such as milestones or work packages listed as the row.
Responsibility Assignment Matrix (RAM)
A matrix- based chart that maps your WBS elements to the required resources.