Quantitative Economics and Econometrics
1/122
There's no tags or description
Looks like no tags are added yet.
Name | Mastery | Learn | Test | Matching | Spaced | Call with Kai |
|---|
No analytics yet
Send a link to your students to track their progress
123 Terms
autocorrelation
serial correlation of the same variable across two time periods
e.g. Bob is selected to participate in the survey where he reports his mood every week. The response in week 1 may be systematically correlated to the response in week 2.
unbiased estimator
Expectation of the estimator = true value of the estimator
Variance (general formula)
E(x²) - [E(x)]²
Panel data
Data that spans multiple time periods
Repeated cross-section? Is there autocorrelation?
In each time period, a new sample is selected. This means that across time periods and within time period, there is independence.
NO there is no autocorrelation.
tobit - when to use
there exist corner solutions, or censoring
when will truncation (or nonresponse) lead to OLS be unbiased/consistent
if the selection criteria is wholly independent of u
on the other hand, if the selection criteria depends on y (e.g. s=1 iff y>c, then s is wholly dependent on u)
first-differenced equation
taking two cross sections in two time periods, then subtracting to get a “change in” OLS eqn
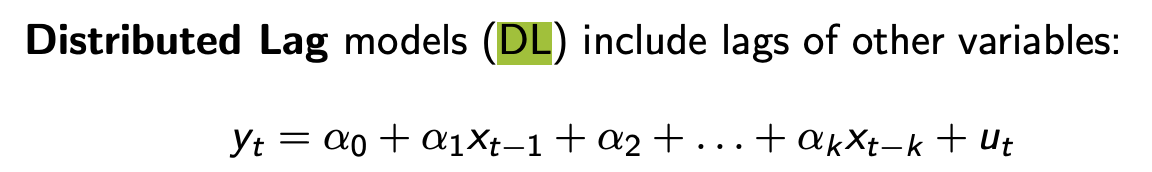
distributed lag model
when there are lagged indep variables included in the regression
e.g. trash2025 = b0+ b1*govbudget2023 + b2*govbudget2022
time dummies in first-difference eqns
why do we need them?
how do we interpret the coeff on the time dummy
for removing the time-invariant, fixed effects (a)
since it would be 1 for the year and -1 for the year after, it measures the effect of entering/exiting that year on y
chow test
what is it for
how do we do it
write the formula
for comparing before and after a structural change
same as in F-test. compute f-statistic. But make sure the regression has dummy variables interacting on regressors BEFORE and then AFTER the break
formula: let SSR1+SSR2=SSRUR then it is the same as the F statistic formula.
SSRR - (SSR1 + SSR2) / q
———
(SSR1+SSR2) / df
problems with first-differencing
key assumption that a needs to be uncorrelated with all x
sometimes variables do not vary much across two periods (or even more! e.g. educ)
how to deal with OVB (5 possibilities)
include it as a regressor
include more controls s.t. conditional exogeneity holds
use panel data, fixed effects / first-differencing, so every individual is observed multiple times (this assumes OVB doesnt vary over time)
IVs
run a randomised controlled experiment
what is the OLS variance
how is the IV variance different
compare sizes
sigma² / SSTx
there is also a R²(x,z) term in the denominator
IV variance is larger
how to know if we shd use OLS or TSLS
Hausman Test
CEV assumption.
What do we hope for when there is measurement error?
ALL regressors (including the TRUE REGRESSOR) is independent of the measurement error
We hope that there are multiple ways that the variable was measured. This will reduce the severity of bias.
bias vs consistency vs efficiency
bias = tends to produce the wrong outcome
consistency = tends to produce the same outcome (low var)
efficiency = doesn’t need a large sample size to produce a given outcome
what does logit/probit replace? why is it better?
replaces LPM
better bcos only returns fitted values between 0 and 1
what is the beta in a logit/probit (interpret)
the estimated beta in a logit/probit model is the value which maximises the log-likelihoods across all observations
How do we correct for sample selection bias
Heckman Correction
How do we perform Heckman Correction
How do we know Heckman is consistent for OLS?
Define the selection critera.
Perform a probit and calculate the Inverse Mills Ratio for each observation
Regress y on all variables and the estimated I.M.R.
Do a t-test on the final regression, on the coeff of the IMR. H0: coeff = 0, HA: coeff =/= 0
We require the coeff = 0 for OLS to be consistent
→ i.e. no evidence of selection bias
What does Tobit rely on? (assumptions))
Homoskedasticity of error terms is a MUST
Error terms MUST also be normally distributed
Is it a problem to truncate x or truncate y?
Truncate y, because this leads to systematic bias in the sample
Truncation vs censoring?
Truncation is when values above/below a certain y are completely tossed away from a sample. They are out of the dataset.
Censoring is ALL individuals are sampled, they are in the dataset, but then the dependent variable is restricted to a certain range (e.g. top-coding, where salary “500,000 gbp and more” is a selection)
Truncation - use MLE truncreg (OR Heckit if truncation is from an unobserved process, like self-selection bias e.g. unemployed people are excluded from the sample)
Censoring - use Tobit
What happens (to the regression, and so to the coefficients) when you use OLS to erroneously predict a top-coded regression sample?
Since values above a certain y are censored-off, then the top-coded-out responses artificially ‘flatten’ the OLS regression
OLS produces coefficients way way below what is the true value (in fact, it tends toward zero)
Incidental truncation (sample selection bias), definition?
When you toss away samples that don’t meet a certain selection criteria (e.g. s=1[y>50]) and the selection criteria is not random
However, if the selection criteria is based on x and not y, OLS remains consistent and unbiased. E.g. if you use IQ to predict wage. But you restrict the IQ to be x>100 then OLS is still valid, but the interpretation is just slightly different in that you are estimating the effects for the population of which IQ>100
Why is it only a problem if we truncate y?
Truncating x does not give any issues, unbiasedness and consistency still hold.
But doing so for y is problematic because y and u are correlated. Hence, by truncating y, the sample selection is correlated with u (MLR 4 violated)
Steps to perform Hausman Test?
H0: cov(x1,u) = 0 (exogeneity) → use OLS
Ha: cov(x1,u) =/= 0 (endogeneity) → use TSLS
Regress x on z to obtain fitted values of x (I.e. run the first stage of TSLS)
For each observation, subtract x-hat from x, to yield v-hat
Regress y on x (original values) and v-hat
T-test to check significance of coefficient on v-hat
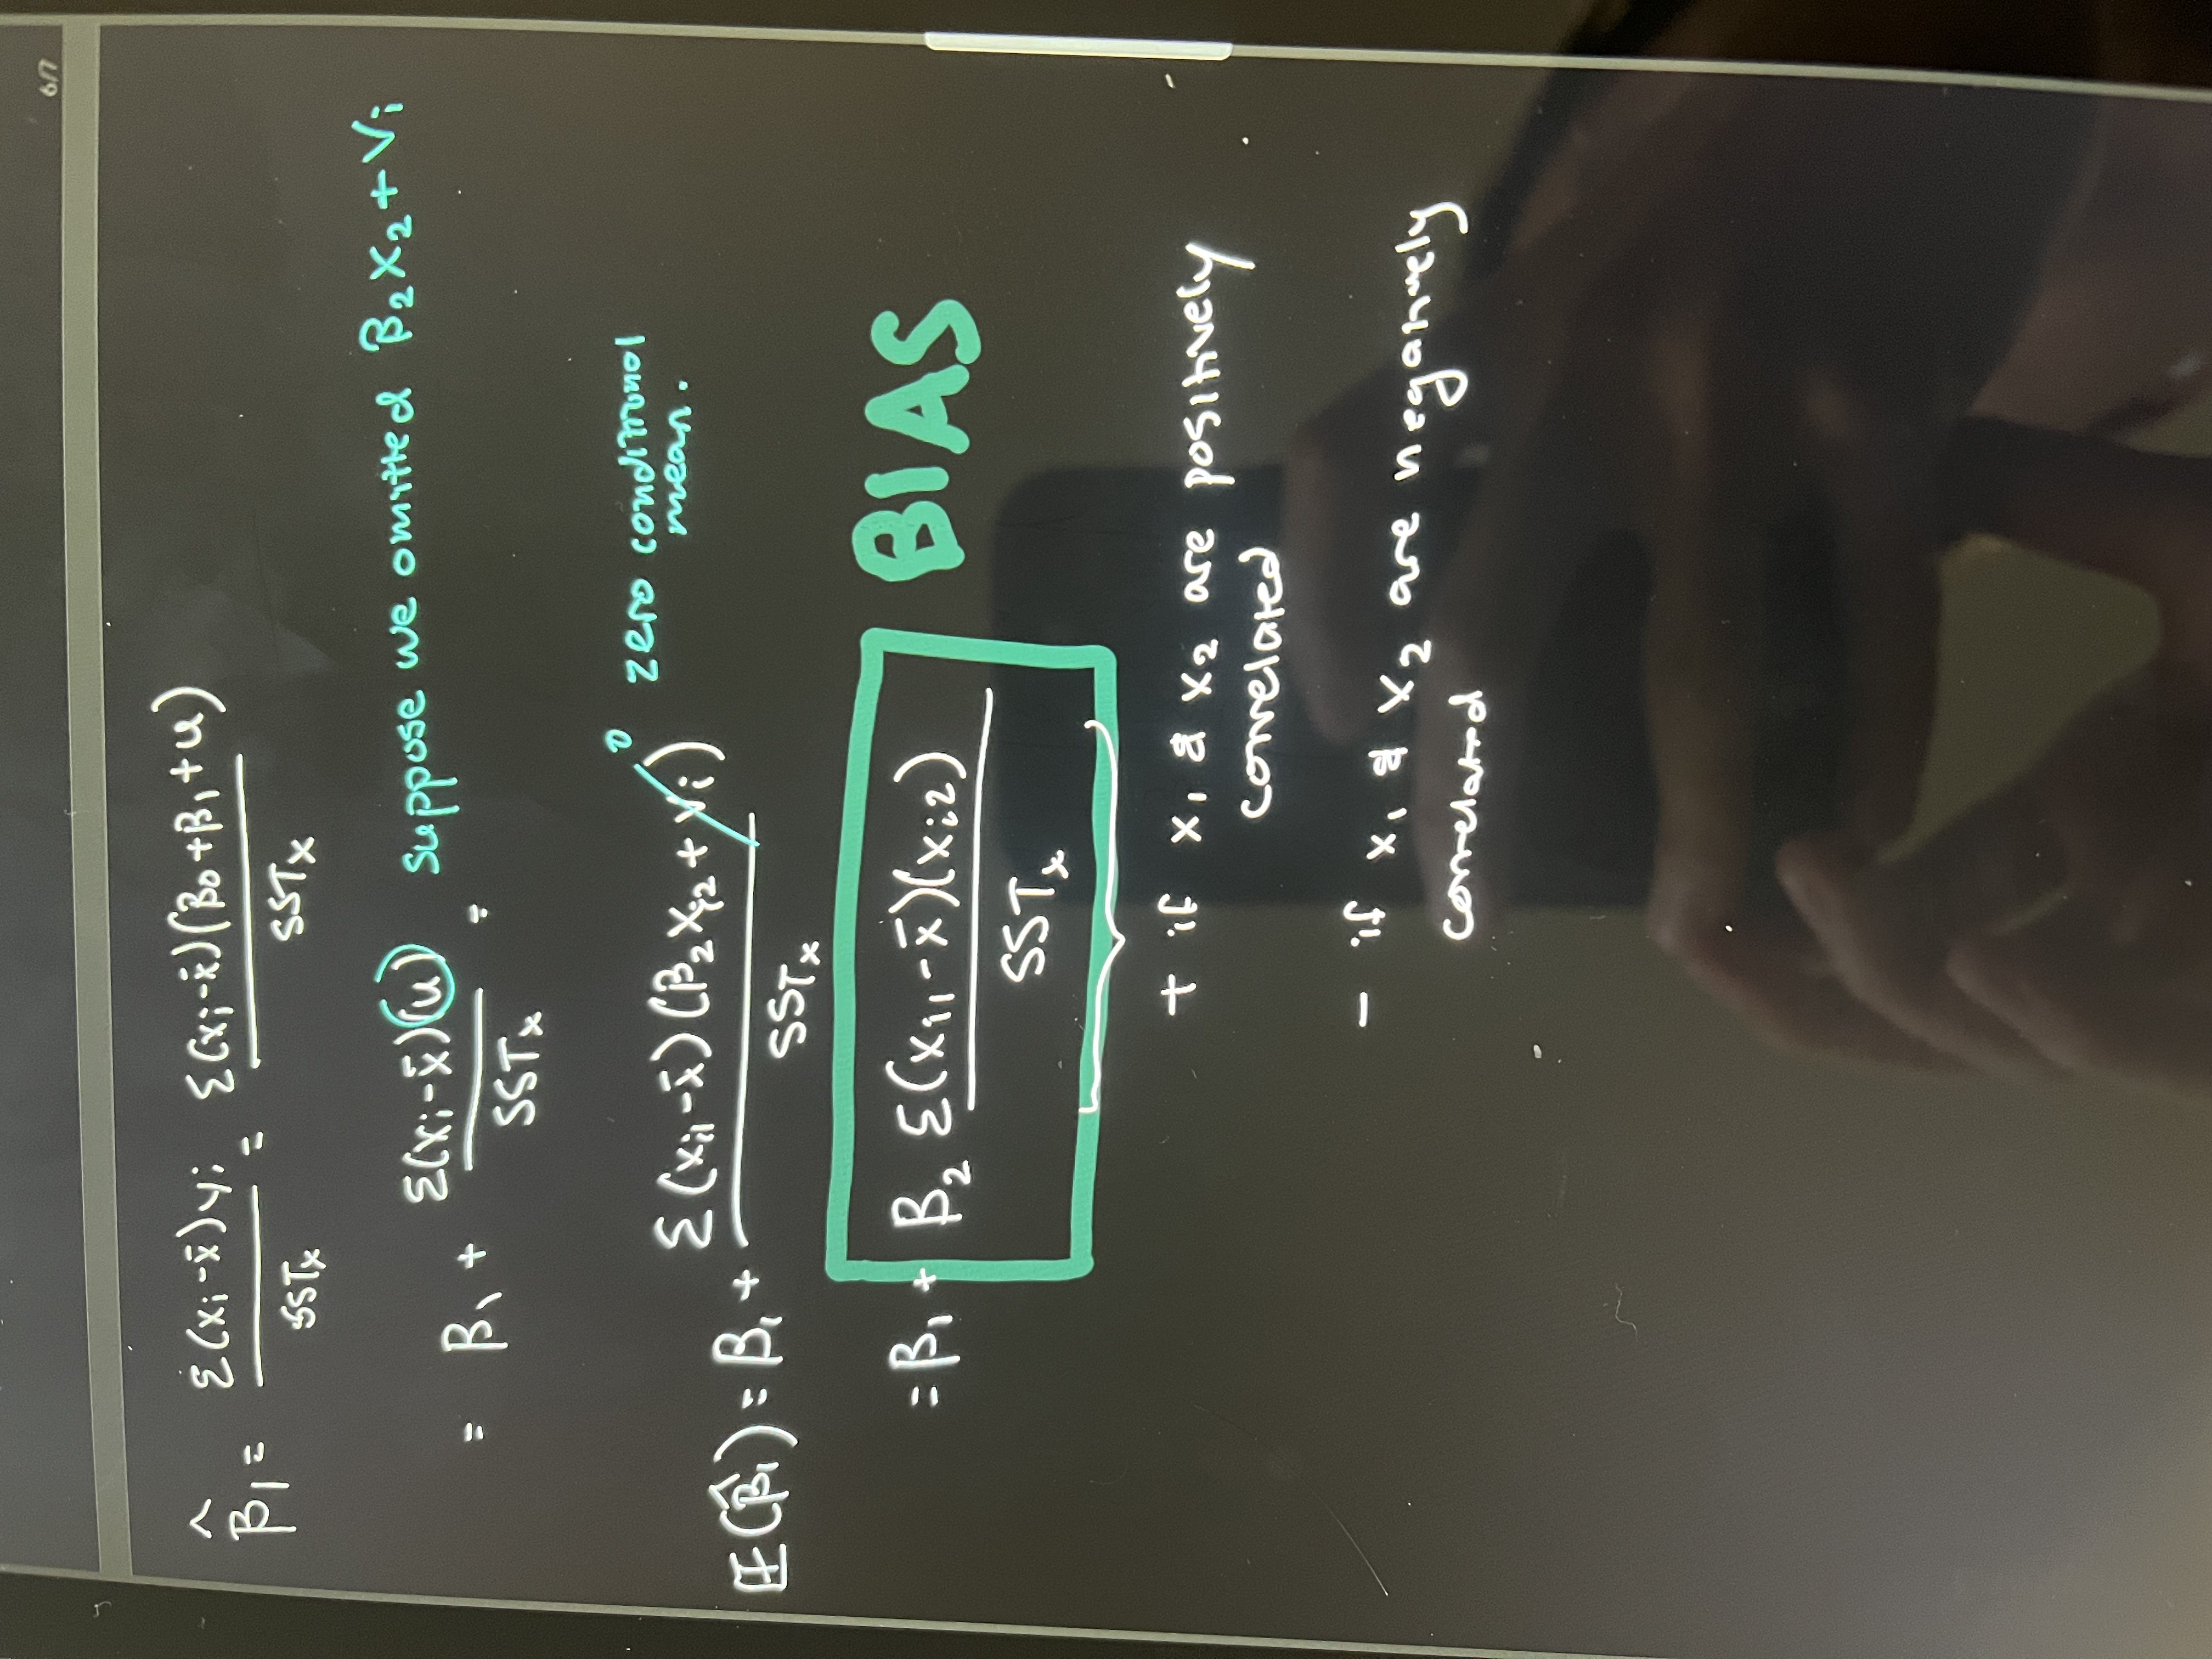
Derive the OLS (SLR) beta-hat from the definition.
check tablet notes for answer derivation steps
Derive the OLS (MLR) beta-hat step by step using the partialling-out method.
Regress xi1 on xi2, with ri1 being the error term and alphas as coefficients
Regress y on ri1 (y = B0 + B1ri1 + v)
Rewrite the OLS SLR beta-hat.
What are the ways we can test for multiple exclusion restriction in MLE? And why do we want to do it?
Compare this with the OLS case. Why is there a different methodology for MLE?
Wald statistic (in x)
LM statistic (in m)
LR statistic (in y) - we know the form = 2
the point is to check whether adding more indep variables makes a difference, or to see whether the indep variable is affecting the dep var at all
In OLS, we do the same using the t-statistic. MLE has diff ways to find bc u is not assumed normally distributed.
weak vs strict exogeneity
weak: E(u|x) = 0
strict: E(u|X) = 0 (as in, the average of error terms must be uncorrelated across time periods)
OLS exogeneity vs TS exogeneity
(Why do we need strict exogeneity in TS?)
under cross-sections/OLS, we need just weak exogeneity because the samples are chosen from a random process
under TS, we need strong exogeneity because samples are not random.
Bidirectionality in TS? Is it ok
If y affects x too, (endogeneity), generally TS3 condition is violated - strict exogeneity does not hold true
How do we model an exponential time series
use log specification on y, linear on independent variables
spurious regression problem
when x is erroneously concluded to have a positive effect on y.
when in fact an omitted variable TIME naturally causes both x and y to increase with time.
When there exist serially correlated errors, standard OLS variances are invalid because…
They assume that the covariances of the errors across observations are zero.
The number of lags in an AR or DL model is best chosen using…
An information criterion like BIC (Bayesian Information Criterion)
What are the appropriate ways to adjust for seasonality? (3)
Include month dummies
Use trigonometric functions as controls
Use an annual change transformation (1st differencing)
Why does QLR have different test statistics to T? Is it larger or smaller than T?
The QLR test statistic is the maximum out of many test statistics. It is therefore larger than T.
Random walk process - definition? What happens to the variance? And what about stationarity? What type of trend is this?
When is the only time a random walk “OLS consistent”?
When the autocorrelation term (Beta) is exactly equal to one. Variance increases linearly over time. Violates stationarity and weak dependence. This is a stochastic trend (unit root)
A random walk can be OLS consistent ONLY if the error term is stationary AND the regressor and regressand are cointegrated (cointegrated = fancy way of saying they move together. e.g. short term and long term interest rates)
Because of lack of what in TS do we need additional/new requirements compared to OLS? And what are these requirements?
Lack of random sampling
New requirements: Weak dependence, stationarity, and strict exogeneity
MA model
→ Which TS requirements are satisfied by the model?
Write the MA(1) model functional form.
→ What are we assuming in this functional form?
Moving average model
Satisfies both weak dependence and stationarity
MA(1)
y = b0 + b1(et-1) + et
Values, especially errors from more than 2 periods ago has no effect on current y
Assumption we need to make to establish stationarity?
u is independent of the dependent variable cov(u,xt)=0
AR(q) model assumption for weak dependence?
Beta must be less than 1.
Derive the mean and variance of a stable AR model (What must we assume? What abt the autocorrelation?)
(ASSUME STATIONARITY. As it is autoregressive, there exists autocorrelation)
By stationarity, E(yt) = E(yt-1). Take expectation of both sides of the model. Then E(yt) = B0 / (1-B1)
Take variance of both sides of model. By stationarity, Var(yt) = Var(yt-1).
Var(yt) = sigma2e / 1-B12
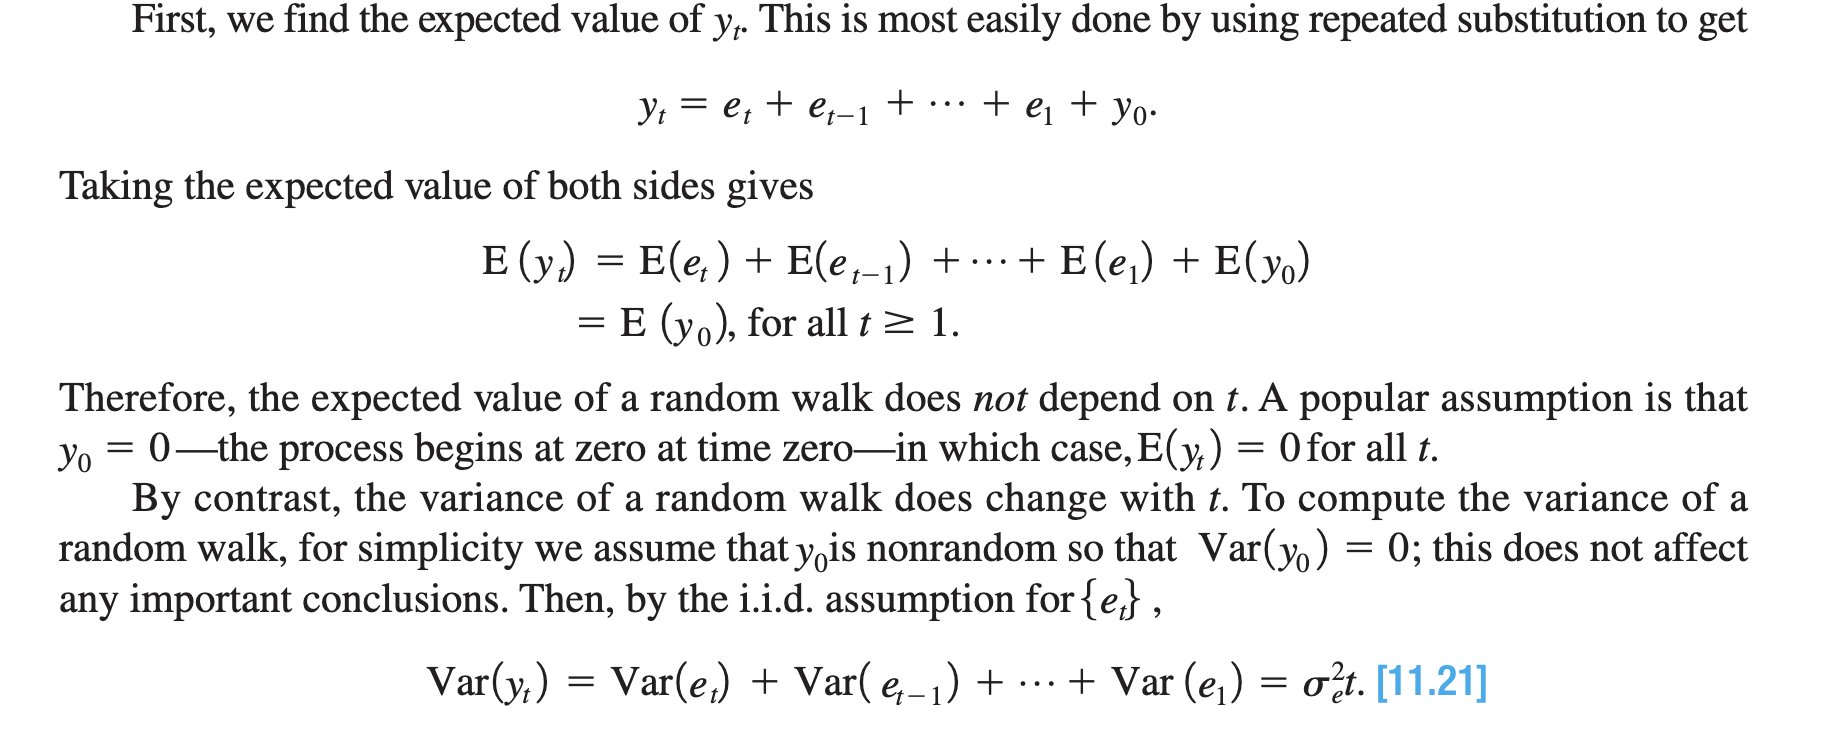
Derive the mean and variance of a random walk AR? And with drift term?
With drift term:
The mean is E(yt) = E(y0)
The variance is Var(yt) = sigma2t with assumption that var(y0)=0
Log-likelihood function (Write down the formula) for Probit/Logit
What does the MLE try to do?
The MLE chooses beta to maximise the log-likelihood function
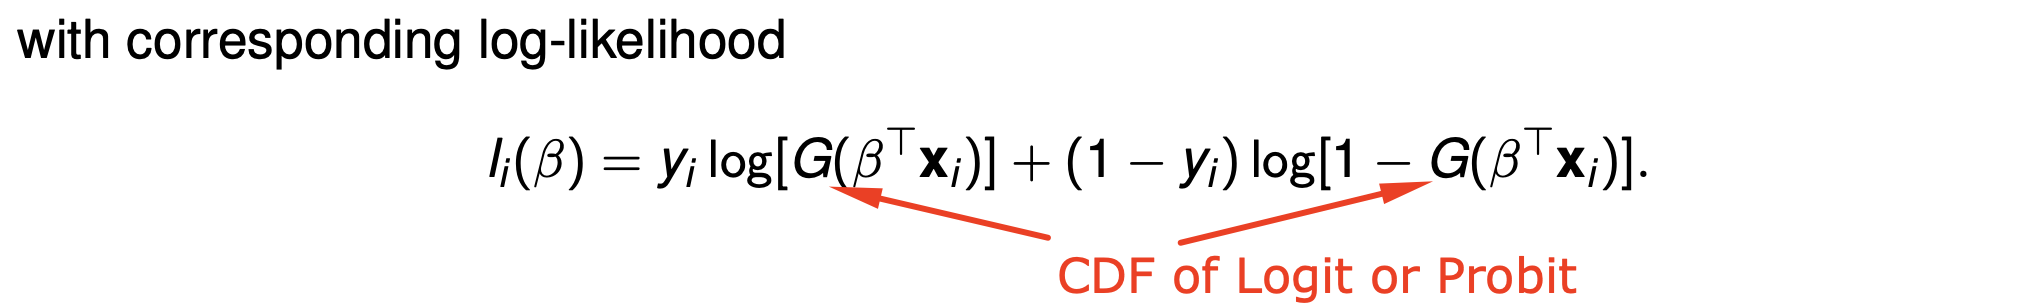
CDF of Probit
Probit uses the normal distribution.
The CDF is therefore the area underneath the PDF. PDF = 1/sqrt(2pi) * exp(-z²/2)
So take the integral of PDF evaluated from -inf to z.
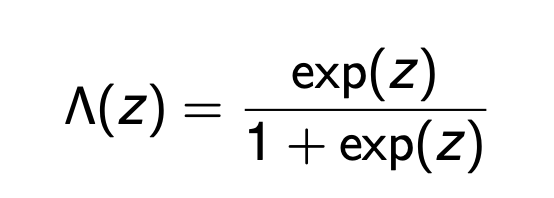
CDF of Logit
How do we test whether to include more lags in forecasting model? (1 do and 1 don’t)
In the first place, use AIC/BIC to determine the best number of lags.
If unsure, DO compute the RMSFE in the regression w/ and w/o the new lag variable. If it FALLS then yes include the lag.
DO NOT test for coefficient significance on lag (this does not necessarily tell us whether the new variable improves forecasting - pvalues are good for within-sample inference but not OOS forecasting)
forecast interval assumptions and formula
assume:
u is normally distributed
if using transformations (like log), the forecasted change is small
formula:
y-hatT+1|T ± 1.96(RMSFE-hat)
Is it ok if coefficients are biased in forecasting
Yes because we just care whether the forecasting is correct
How do I obtain the effect of x on y if using PROBIT/LOGIT?
If x is a discrete regressor, then simply plug in values into the cdf. For example if we want to measure the effect of going from x=3 to x=4,
CDF(B0 + B1(3)) - CDF(B0 + B1(4))
If x is a continuous regressor, then we would have to find the marginal. = G’(B0 + B1x)B1 Take the derivative of the CDF and evaluate at x=3. In the probit case that would be the Normal PDF. In the logit case that is PDF=CDF(1-CDF)
Logit pdf
PDF = CDF(1-CDF)
Where CDF = exp(.)/(1+exp(.))
What is the key assumption to probit
We are using the normal distribution, specifically the standard normal (mean = 0, variance = 1)
We need to standardise normal distributions that are nonstandard, by dividing by sigma
Partial effect at the average (Formula?)
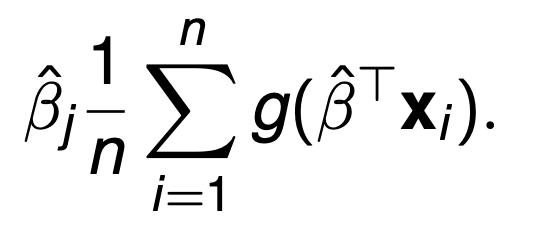
Average partial effect (Formula?)
PEA = pdf(BTx)*Bj
APE = (See image)
how do we know whether the data fits well for probit/logit/tobit
use Pseudo R2 = 1- [ln(LUR)/lnLR]
Where L is the log-likelihood
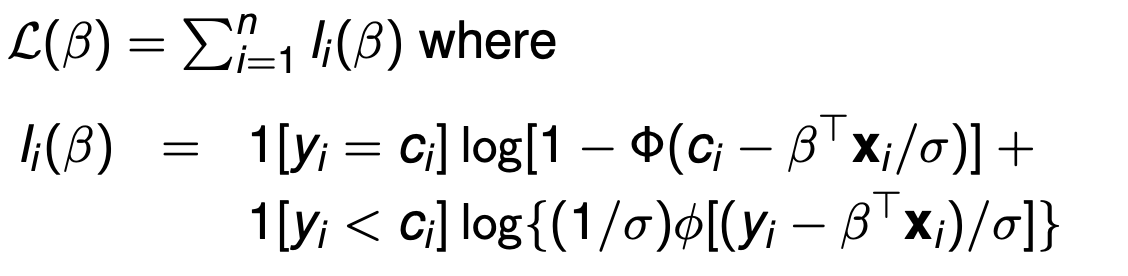
Log-likelihood function (Write down the formula) for Tobit?
How is the function different if it is not ‘above’ censored but instead ‘below’ censored?
Note: The ENTIRETY of ci - BtX should be divided by sigma (error in the slides)
If it is below censored, then the sign obviously flips, but also no need to do 1- in the first bit.
What does beta measure in Tobit?
Beta measures the effect of xj on the observed values of y, i.e. y*
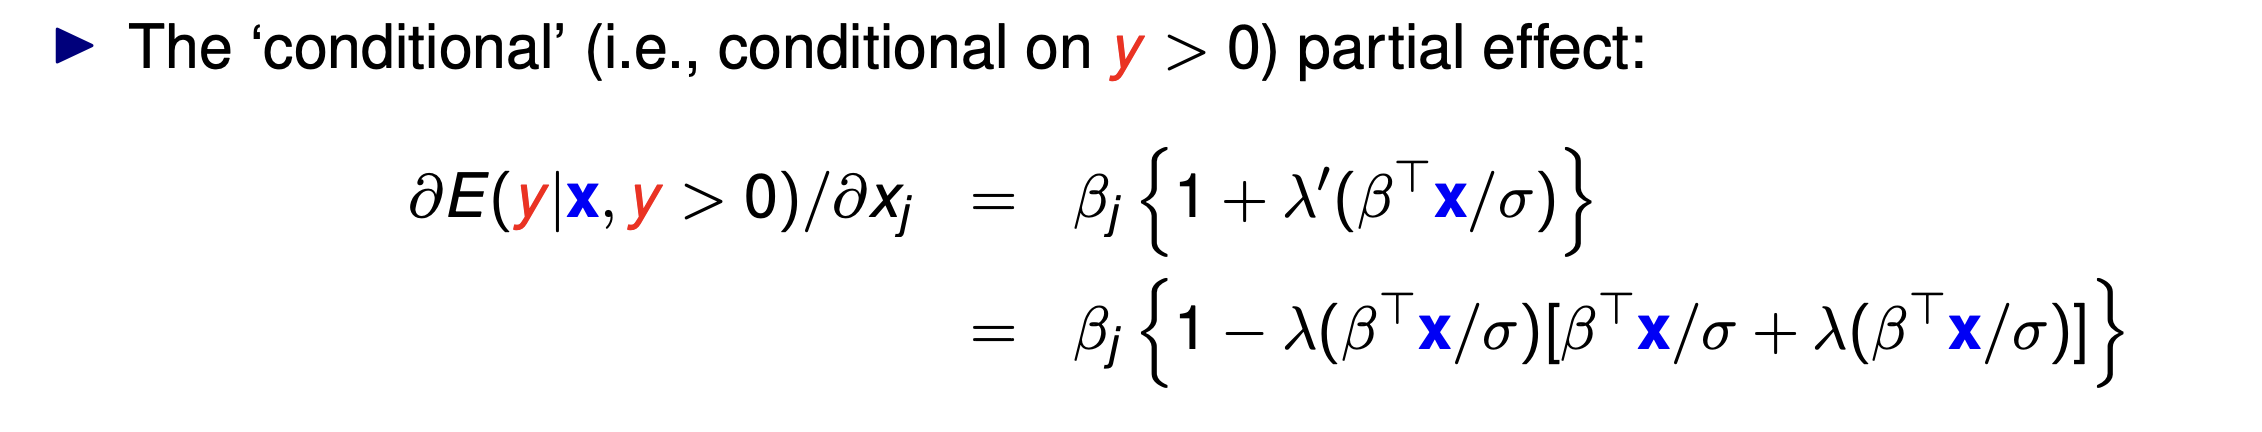
Tobit conditional partial effect (what is it? Formula?)
Conditional partial effect is E(y|x, y>0)
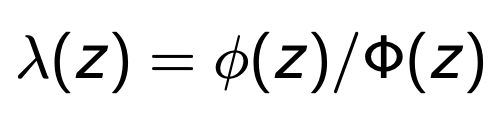
Inverse mills ratio formula
PDF/CDF
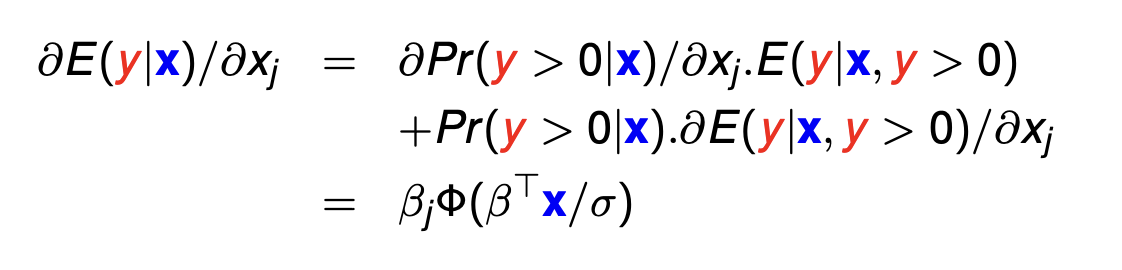
Tobit unconditional partial effect (What is it similar to? Definition? Formula?)
Unconditional partial effect is E(y|x).
The formula is similar to the probit/logit continuous PEA. Except note that we use cdf instead of pdf. and we must standardise the value.
“Unconditional” because it is NOT conditional on y being greater or less than the censor threshold c
how do we know the autocorrelation of an AR model?
how do we know if an AR model displays weak dependence?
The coefficient on the lag is the sample autocorrelation
IF AR model has B<1, → weak dependence
if random walk or B>1, → no weak dependence
percentage change in time series formula
100Δln(Yt)
= 100(ln(Yt) - ln(Yt-1))
this can be shown to equal 100*(change in Yt formula)
= 100(ln(Yt/Yt-1))
= 100(ln(1+(Yt - Yt-1)/Yt-1))
approx equal to 100(Yt - Yt-1)/Yt-1)
Holds for small changes in Yt
Autocorrelation formula
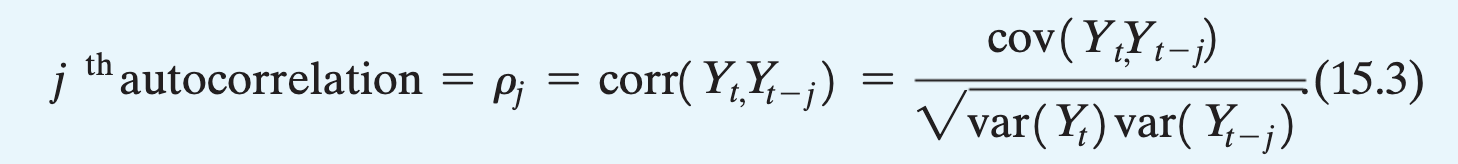
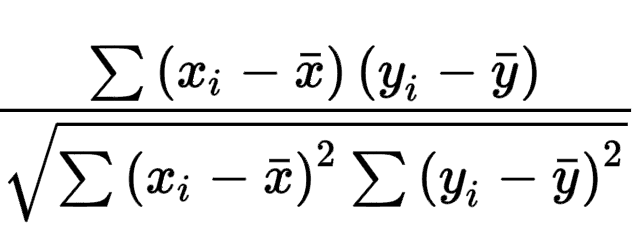
General formula for correlation
This is how the correlation coeff, r, is calculated
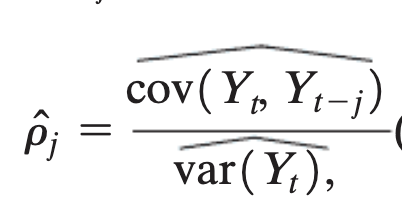
Sample autocorrelation formula
the denominator is simply var(yt) because we have assumed var(yt) and var(yt-1) are the same under stationarity.
Textbook definition of stationarity
Historical relationships can be generalised to the future because the distribution of Yt is same over time.
Formally, the joint distribution of (Yt+1, Yt+2, …) does not depend on t
What is the formula for forecast error? And hence the formula for MSFE? RMSFE?
Forecast error = YT+1 - Y-hatT+1|T
MSFE = exp[(forecast error)²]
RMSFE = root of MSFE
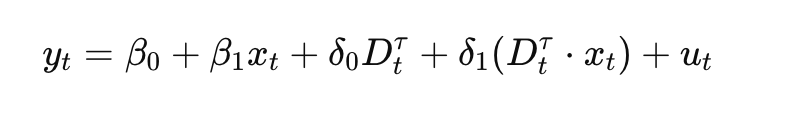
How is the QLR test statistic found? Explain in detail
For every time period between [.15T, .85T] = [t1, t2],
Create a regression equation for each break date you would like to test (every period in the data). With a dummy variable =1 if t>break date, =0 if not.
yt = b0 + b1yt-1 + a0t + a1t*yt-1 + u
The null hypothesis is H0: alpha0 = alpha1 = 0. The alternative hypothesis is at least one of them is not equal zero. Repeat for every possible time, t.
Compute the joint f-statistic, and find the maximum one.
On the tables: QLR test statistic reference “q” is the number of regressors+1. (df = n-k-1, but q = k+1)
note: the QLR cannot be performed on the last 15% of data, but we can still check whether there is a structural break in the last 15% by comparing the POOS forecasts with the actual data
What are the three ways to calculate RMSFE?
Sample error method
Final prediction error method
Pseudo out-of-sample method
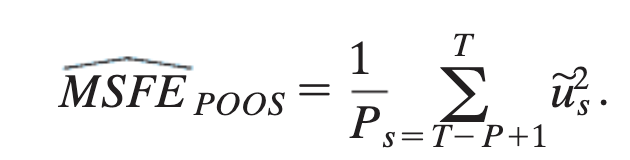
POOS method (Steps?) and hence write the formula for MSFE under POOS
Choose a number of out-of-sample observations, P (s=T-P) s will be your in-sample observations (Usually 10%/20% left of T is P)
Estimate regression y on s.
Calculate Y-hat for 1 period ahead of s, and find the forecast error.
Repeat for every period in P until you get many forecast errors
Sample error method for finding MSFE
ASSUME: Stationarity
Write out the MSFE formula and expand for both
We have the oracle forecast variance and estimation error
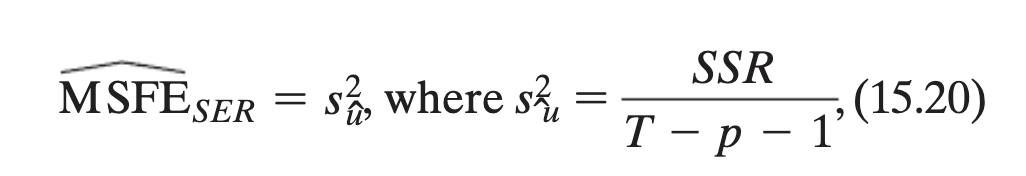
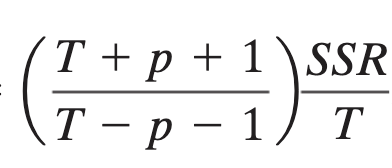
Final prediction method for finding MSFE
Assume: Stationarity, homoskedasticity of errors
T = observations
p = number of lags
deterministic vs stochastic
stationairty implies…?
deterministic: trend has a determined pattern, a clear trend. Stationary → deterministic
stochastic: trend appears to be random
Dickey-Fuller test (What is it for? How do we do it?)
It is to determine whether a AR model is stochastic or not (unit root or not)
We cannot use a t-test. Instead, use a one-sided
H0: a = 0 HA: a < 0
in the regression of deltaY on Yt-1
dY = B0 + a(Yt-1) + ut
calculate the Dickey-Fuller statistic a1/SE(a1)
compare to critical values
note: we DO NOT RUN A T-TEST as OLS does not work
How do we check for structural breaks?
Use the QLR test for the centre 70%. For the last 15%, the POOS observations can be used to generate a forecast. Plot this against the true values and see if they deviate.
QLR test steps:
Create a regression equation for each break date you would like to test (every period in the data). With a dummy variable =1 if t>break date, =0 if not.
yt = b0 + b1yt-1 + a0t + a1t*yt-1 + u
The null hypothesis is H0: alpha0 = alpha1 = 0. The alternative hypothesis is at least one of them is not equal zero. Repeat for every possible time, t.
Compute the joint f-statistic, and find the maximum one.
What is meant by “dynamic causal effect”
In a distributed lag model, a particular Xt will have effects that span not only for Yt but also Yt+1, Yt+2, and so on…
The dynamic causal effect is the effect of Xt on all Yt, Yt+1, Yt+2, …
i.e. the sequence B1, B2, B3, …
Anytime a DL model includes a human element, it is likely that…
Strict exogeneity may be violated.
Because humans are forward-thinking. Changing future value of Y would likely influence a different pattern for X
Autocorrelation is a problem for the …
It does not affect…
But, autocorrelation won’t be a problem if we assume…
STANDARD ERRORS in OLS. This leads to problems for inference. That’s why we use HAC SEs.
It does not affect the accuracy/consistency/biasedness of the coefficients
If we assume homoskedastic standard errors, then autocorrelation is not a problem. BUT… this is often a terrible assumption which is why we use HAC SEs.
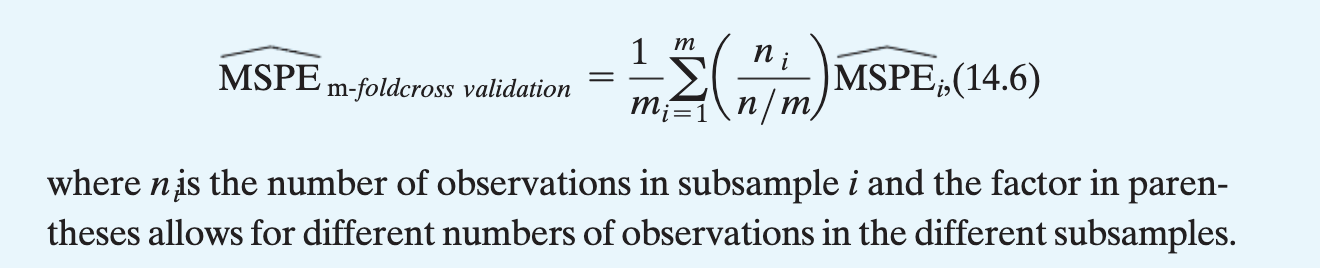
How do we find the MSPE (steps)
what is it for
The mean-squared prediction error
Use M-fold Cross Prediction
This is the similar process as what we did for finding MSFE.
STEPS:
Determine m, the number of folds. Divide your sample N by m as equal as possible.
Using all but subsample m=1, estimate OLS and find the MSPE-hat for m=1
Repeat for m=2 (Do include m=1 here) and so on, until all the m has been done
Calculate the eqn in the image
This is for choosing the ‘penalty parameter’ in Lasso, for big data
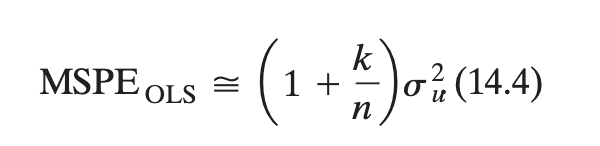
MSPE. What are the two ways to estimate it. Report the formula for the more ‘strict’ way to estimate it.
You can use m-fold cross prediction or use MSPEOLS. MSPEOLS is more strict because HOMOSKEDASTICITY IS REQUIRED.
where k is the number of regressors…
OVB bias direction intuition?
Bias direction = sign of corr w/ x * sign of effect on y
checks for internal/external validity (5)
OVB
Linear model misspecification
Errors-in-variables bias (measurement error)
Sample selection bias
Simultaneous causality bias
OLS estimates (b1 and b0) for binary explanatory variable
B-hat1 = ybar1 - ybar0
B-hat0 = ybar0
average treatment effect
ATE = ybar(1) - ybar(0)
However, this is not observed. This requires us knowing what would happen to EVERY individual if they somehow were both in the control and experiment
Instead, we only observe y0 and y1. y0bar is not the same as ybar(0) … because it is the ybar of the observations assigned 0.
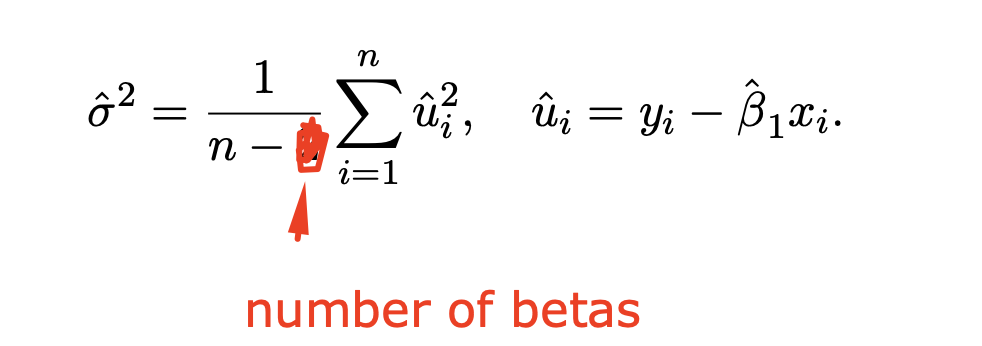
Sample variance of u formula (under OLS)
If both the regressor and regressand are in the log-form, how do we interpret the coefficient on the regressor?
e.g. log(y) = b0 + b1(logx)
A 1% increase in x is associated with a b1% increase in y.
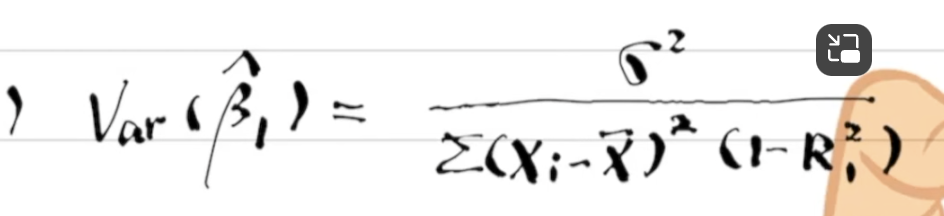
Variance of B1-hat for MLR
The denominator is also equiv. to sum(ri1-hat)²
Derive the proof of OVB
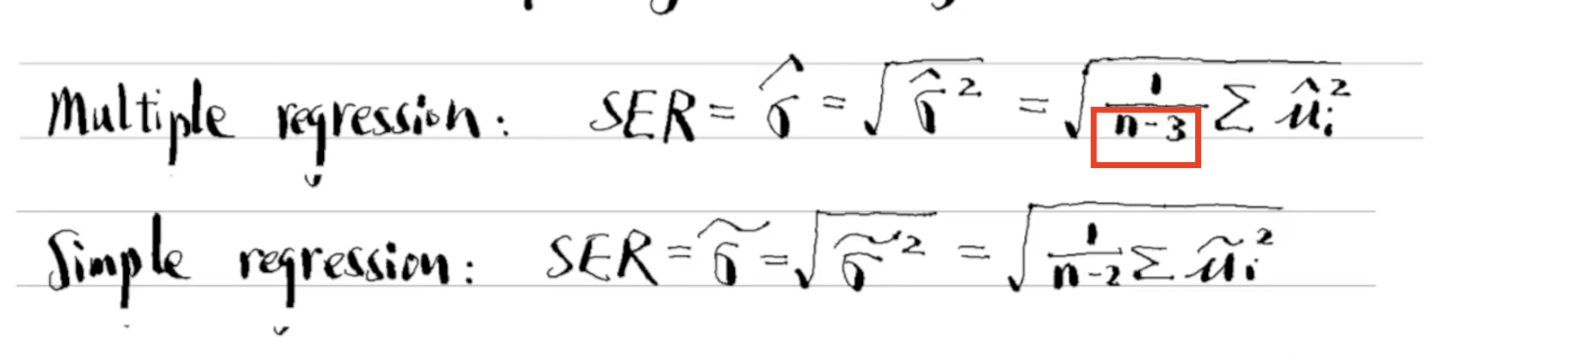
SER/RMSE formula
SER means standard error for the regression.
= sqrt(SSR/n-df)
NOTE: The red highlighted should be n-df
ALSO: SSR=sum(u-hat)²
HAC / Newey West standard errors
????
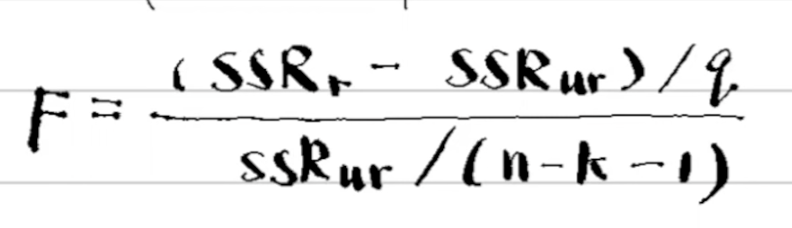
F-statistic formula (there are three forms)
where q=number of restrictions (n-k-1) is the df
R² form of the formula
F = (R²UR - R²R)/q all divided by 1-R²UR/df
and finally the joint significance of an unrestricted model can be tested if the R² is known. But the test must be on ALL the included variables.
F = R²/q / (1-R²)/df
consistency formula (how do we know if b1-hat is consistent)
show that plim(b1-hat) = b1
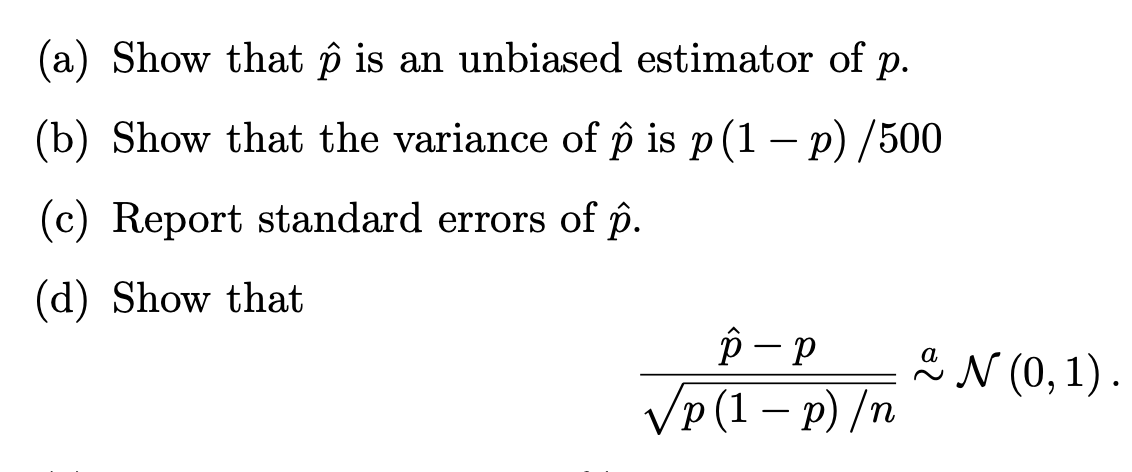
how to prove the asymptotic normal distribution?
show that the estimator is unbiased
show that the variance of the estimator is = …
then the numerator of the expression is ok (by 1) and the denominator of the expression is just 2. so it converges asymptotically to the normal dist (0,1)
What is the overidentification test for?
Write the steps.
It is to check the validity of an instrument, namely, that the IVs are exogenous
REQUIRED: more instruments than endogenous variables
H0: all IVs are exogenous
HA: H0 is false
Regress ui-hat (from 2nd stage of TSLS) on all instruments and eqn exogenous variables (x2, x3, …)
Look at the generated R²
The test statistic is nR²~X²#endog minus #instr. Reject H0 if it has a low p value
q = number of overidentified
IV Estimator (TSLS) steps
regress x on z and all other exogenous variables (in THE equation you’re trying to estimate)
regress y on x-bar and all other exogenous variables in THE equation you’re trying to estimate)
the b1 obtained from the 2nd stage regression is the iv estimator
relevance test (what t statistic/f statistic do we require?)
for iv estimation, see if the instrument is weak or if it actually works with the endogenous variable
run 1st stage of TSLS (regress x on z and other exog vars)
test the coefficient on z using t-test
t > sqrt(10)
f > 10!!!