income inequality
1/15
There's no tags or description
Looks like no tags are added yet.
Name | Mastery | Learn | Test | Matching | Spaced |
|---|
No study sessions yet.
16 Terms
Lorenz curve
graph each income quintile on the x-axis
graph the % income on the y-axis

Gini coefficient
area of space between perfect equality and Lorenz curve (blue)
over
area between perfect equality and perfect inequality (blue + grey)
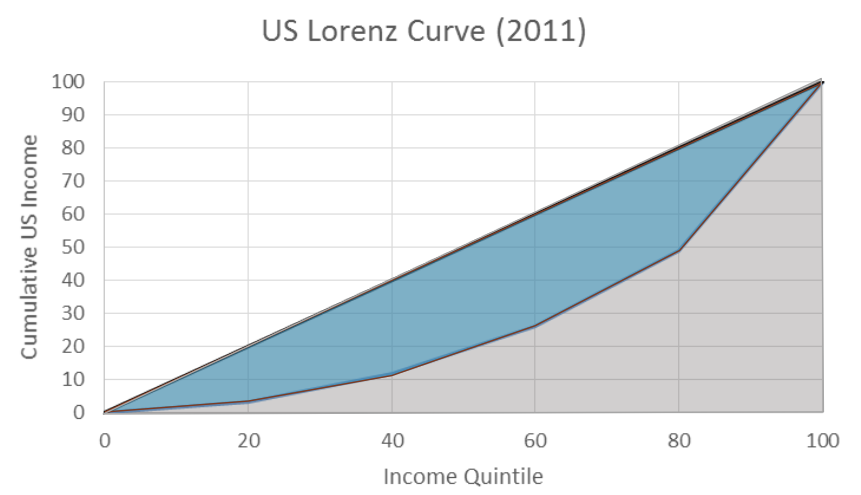
mini coefficient meanings
ratio of 1 = perfect inequality
ratio of 0 = perfect equality
poverty line
estimated income for a family to avoid hardship
poverty rate
percentage of people below the poverty line
what ways is wealth redistributed in the US?
SNAP
Medicare/medicaid
housing subsidies or public housing
unemployment aid
for a lot of these, they are means-tested, meaning you only qualify if your income is below a certain threshold
can potentially create a poverty trap, as earning more means losing benefits
does redistribution distort incentives?
it may affect how the poor choose to act & depends on labour supply elasticities- may choose to work less
taxing to sponsor these programs creates DWL in the markets that are taxed- can reduce incentives for the rich to produce
example of how redistributive programs distort incentives
on this graph, the optimal consumption bundle is 48 hours
people below income G get additional income to push them up to G (people with income G or above do not get any benefits)
benefit B = max[0, G - (w x h)]
say you work 48 hrs/wk with a wage of $10/hr and G = $680, 680 - (48 × 10) = $200 in benefits
now say you increase your hours to 52 hrs/wk → 680 - (52 × 10) = $160 in benefits
even though you have increased your weekly earnings by $40, you lose $40 in benefits, meaning your total earnings remain at G even though you’re working more
if you get benefits up until $680, you would just choose to work 0 hours!!
![<ul><li><p>on this graph, the optimal consumption bundle is 48 hours </p></li><li><p>people below income G get additional income to push them up to G (people with income G or above do not get any benefits) </p></li><li><p>benefit B = max[0, G - (w x h)] </p></li><li><p>say you work 48 hrs/wk with a wage of $10/hr and G = $680, 680 - (48 × 10) = $200 in benefits </p></li><li><p>now say you increase your hours to 52 hrs/wk → 680 - (52 × 10) = $160 in benefits </p></li><li><p>even though you have increased your weekly earnings by $40, you lose $40 in benefits, meaning your total earnings remain at G even though you’re working more </p></li><li><p>if you get benefits up until $680, you would just choose to work 0 hours!!</p></li></ul>](https://knowt-user-attachments.s3.amazonaws.com/4a660f00-ae0e-4aba-a41f-2dfa4baafea7.png)
how can we avoid this poverty trap?
reduce the marginal tax rate!
before, B = G - (w x h)
same as B = G - (t x w x h) where t = 1 (each additional hour of work was taxed at 100%)
change t to 0.5 (50% tax rate)
this means B = max[0, G - (0.5 x w x h)], meaning you earn benefits up until wages > 2G
this way you earn benefits even when you work a high number of hours per week
the highest indifference curve may still be less work than when without benefits
there is still a distortion of incentives but it is considerably less than before
there remains 2 major problems:
1. the program is now more expensive; those earning more than G will also get benefits
2. more people will therefore have distorted incentives
![<p>reduce the marginal tax rate!</p><ul><li><p>before, B = G - (w x h)</p></li><li><p>same as B = G - (t x w x h) where t = 1 (each additional hour of work was taxed at 100%)</p></li><li><p>change t to 0.5 (50% tax rate) </p></li><li><p>this means B = max[0, G - (0.5 x w x h)], meaning you earn benefits up until wages > 2G </p></li><li><p>this way you earn benefits even when you work a high number of hours per week </p></li><li><p>the highest indifference curve may still be less work than when without benefits </p></li><li><p>there is still a distortion of incentives but it is considerably less than before </p></li><li><p>there remains 2 major problems: </p><p>1. the program is now more expensive; those earning more than G will also get benefits </p><p>2. more people will therefore have distorted incentives </p></li></ul>](https://knowt-user-attachments.s3.amazonaws.com/13f6ecba-a3bf-408b-8d71-aa6fd5872ff4.png)
the “iron triangle” of welfare problems
given G and t as tools, there is no way to do all three of the following:
Encourage work
Redistribute income
Reduce costs
this hinges on the assumption that the majority of workers will be very responsive (in terms of hours worked) to changes in benefits- are they??
are the majority very responsive to changes in benefits? (are their hours worked elastic in response to benefits)
for the poor, they are not near enough to the point where they see much DMU (only really starts to occur when money is in large increments)
many people derive utility from working- they would not choose to work 0 hours as its part of their identity/how they spend their time
it is also a social norm that it is important to work a full-time job
possible causes of increasing inequality and/or poverty rate
globalisation and technological advancements reduce demand and wages for low-skilled labourers
an increase in double income households
changes in governmental policies on poverty/taxation
reasons for the welfare state
fairness/equity
efficiency arguments (poverty incurs a high negative externality on society- healthcare, crime, unemployment)
risk and uncertainty arguments (is income inequality due to luck? a welfare state helps protect individuals against unpredictable financial distress)
efficiency argument for redistribution
all individuals have DMU over consumption
therefore, maximising total surplus means redistributing wealth ($1,000 won’t mean much to a billionaire, but would mean everything to a homeless person)
utilitarian arguments
the government should maximise the overall utility for the majority and maximise total utility overall
complete equality would maximise total utility
however, under complete equality, we have no incentive to earn more money/work more/harder
John Rawls
veil of ignorance
set the system up in a way that the least advantaged groups in society are prioritised (maximising your minimum possible outcome)