BRAE 345 Midterm 2
1/31
There's no tags or description
Looks like no tags are added yet.
Name | Mastery | Learn | Test | Matching | Spaced | Call with Kai | Chat |
|---|
No analytics yet
Send a link to your students to track their progress
32 Terms
T/F: Satellites have an orbital inclination near…
Undetermined. A satellite’s orbital inclination is the angle between a satellite’s orbital plane and the Earth’s equatorial plane. It describes the “tilt” of the orbit in degrees.
0 degrees = orbits directly above equator
90 degrees = passes directly above the equator
0-90 degrees = satellite travels in the same direciton as the Earth’s rotation
90-180 degrees = the satellite travels westward, opposite to the Earth’s rotation
T/F: All remote sensing satellites are limited to viewing imagery at…
Undetermined. Remote sensing satellites are not limited to a single fixed area and can gather imagery globally, but, their viewing capability is limited by its orbit. The most Earth observation satellites are constrained to the swath (strip of the Earth’s surface a sensor can see) and revisit time (how often they pass over the same spot) dictated by their trajectory.
T/F: Satellites with band 4 represent what part of the electromagnetic spectrum?
Band 4 on satellites generally represent the NIR (Near-Infrared) part of the electromagnetic spectrum
T/F: What will a low pass filter do to an image?
Low Pass Filter:
Emphasizes smooth features and de-emphasizes rough features
Smoothes image if gray levels chage slowly over large number of pixels (low spatial frequency)
T/F: What frequency pixel information does a high pass filter retain from an image?
A high pass filter retains high-spatial-frequency information while blocking low frequencies. This means the filter removes broad, smooth gradients (low frequencies) and isolated only the rapid, localized pixel-to-pixel transitions (high frequencies)
T/F: What is isodata clustering?
ISODATA (Iterative Self Organized Data) Clustering
Type of unsupervised clustering
Clusters image pixels with similar spectral values into groups based entirely on natural data patterns, without requiring pre-defined training samples
Compute N-dimensional vector, cluster centers are evenly spaced
T/F: What can a Band Ratio do?
Band Ratioing:
Band ratioing may be applied to reduce effects caused by topographic conditions, shadows, or seasonal changes in sunlight illumination angle and intensity
It is a form of spectral enhancement
Taking information from a couple of bands of information and appling basic division
A band ratio enhances spectral differences between surface materials and minimizes shadow effects by dividing the pixel values of one spectral band by another
This isolatesunique material properties to highlight features
T/F: When LiDAR is applied to a forest setting for remote sensing, what would you expect?
When applying LiDAR in a forest setting, you would expect to get a highly precise, 3D “point cloud” model of the entire ecosystem. The laser pulses penetrate foliage, so it can capture the physical structure from the canopy down to the forest floor.
Accurately measures individual tree heights, vertical canopy complexity (understory vs upper canopy), and crown shape
Generate “bare earth” topographic maps by filtering out vegetation, exposing hidden deatures like streams, gullies, or old forest roads
What is the process of expanding the narrow range of brightness values (digital numbers) typically present in a remotely sensed image over the full range of available gray values is called:
Contrast stretching
Which of the following remote sensing satellites utilizes an active remote sensing system?
RADAR
Transmits high-frequency radio waves or microwaves to the Earth and measure the returned signal
LiDAR
Shoot laser pulses (usually in the IR or VIS spectrum) at the ground and measure the exact time it takes for the light to bounce back
SAR:
Transmits pulses and use the satellite’s motion to create high-resolution imagery used for geology, terrain mapping, disaster tracking, and measuring minute surface deformations
Which of the following contrast enhancement methods focuses the stretch on the part of the histogram containing the majority of the image data?
Histogram (equalized) stretch
What type of orbit would you choose for a sensor used for monitoring global forest health?
To monitor the global forest health effectively, the best choice is a Sun-Synchronous Orbit (SSO), typically at a Low Earth Orbit (LEO)
Consistent lighting
the satellite crosses the equator at the same local solar time on every pass
shadows remain consistent across images taken weeks or months apart - allows scientists to accurately track changes in forest canopy density and health without seasonal or hourly sun angles distorting the data
High resolution from low orbit
capture detailed imagery
Global coverage
over a few days it will pass over every point
Ikonos imagery is referred to as 11-bit data, what is the range of data brightness values associated with this radiometric resolution?
For 11-bit Ikonos imagery, the radiometric resolution yields a range of discrete digital numbers (brightness values) from 0-2047
11-bit (Ikonos): 211 = 2048 levels (0-2047)
8-bit (Standard): 28 = 256 levels (0-255)
You are developing a table of emissivity values based on laboratory observation. You measure the temperature of the test material as (using a contact thermometer). With a radiometer, you measure the material’s temperature as ___. What is the emissivity of the material?
ε = (Trad / Tkin)4
ε = (508.65/523.15)4
ε = 0.8937
You are planning a thermal scanning mission using an instrument with an IFOV of ___ and an AFOV of ___. If your planned flying height is ___ feet AGL, what is the best ground resolution and where it occurs, the worst ground resolution and where it occurs, and the swath width?
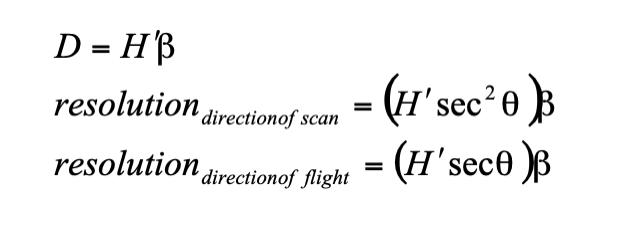
LiDAR
List and describe the three components of a typical LiDAR system
Laser Rangefinding System:
Laser emits rapid pulses of light at a target object or surface. Receiver captures the light that reflects or bounces back from the object.
Global Positioning System:
Provides the precise X, Y, and Z coordinates of the LiDAR sensor in space
Inertial Measurement Units
Tracks the exact orientation, tilt, and acceleration of the LiDAR system
Describe how LiDAR “works”
Emission: the LiDAR sensor emits a pulse of laser light toward the ground or surrounding objects
Timing: a photodetector and internal clock measure the exact time it takes for that pulse of light to hit the object and bounce back to the sensor
Calculation: the system calculates the distance to the object
Data Aggregation: the distance measurements are combined with the spatial tracking data from the GPS and IMU
Point Cloud Generation: by firing hundreds to thousands of the pulses per second across a scanning field of view, the system aggregates the returns into a massive 3D dataset known as a point cloud. Every point has a specific XYZ coordinate of a surface.
What nomial part of the spectrum (red, green, blue, NIR, SWIR, thermal, radar) is most LiDAR collected in?
Most LiDAR is collected in the Near Infrared (NIR), SWIR, and visible spectrum BLUE and GREEN, from wavelengths from 0.9-1.1 and 0.45-0.60
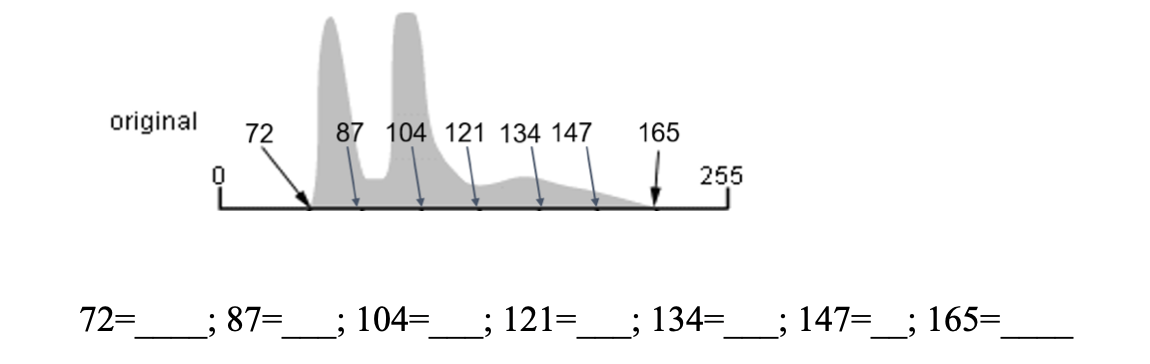
Given the following equation for a linear contrast stretch and the associated histogram, calculate the new values given the original values shown for the histogram below
DNnew = (DNold - Min) / (Max - Min)
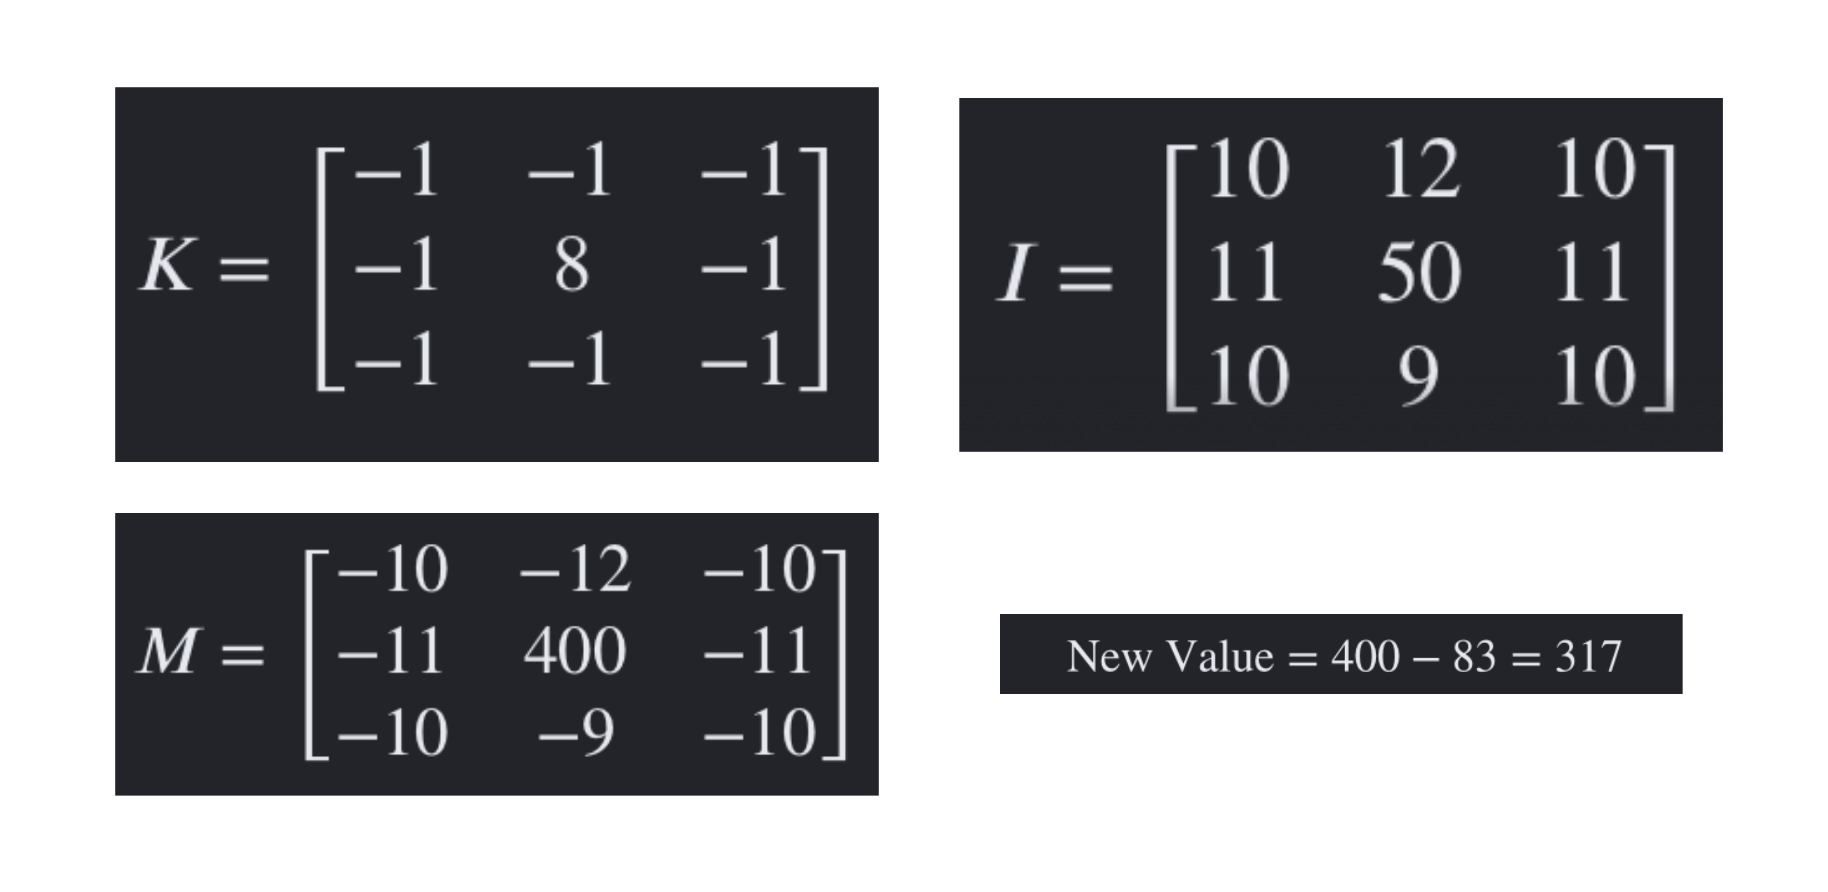
Given the following cell values for a high-pass filter, calculate the new value for the pixel value that changes, an intermediate block of 9 cells is provided for you to show your work. You must show what the intermediate values become and what the calculate of those values become for the cell that changes.
Below are examples of the most common resampling methods. In the space provided below the example, name the method.
Nearest Neighbor:
use the digital value from the pixel in the original image which is nearest to the new pixel location in the corrected image
Bilinear Interpolation
takes a weighted average of four pixels in the original image nearest to the new pixel location
Cubic Convolution
calculated a distance weighted average of a block of a number (user determined, ex: 4×4) pixels from the original image that surrounds the new output location
In the space provided below, decribe what resampling is and why it is necessary. Feel free to use the graphics above to help answer the question.
Resampling is used to determine the digital values to place in the new pixel locations of the corrected output image
the process calculatesthe new pixel values from the original digital pixel values in the uncorrected image
The original uncorrected grid and the new corrected grid do not align perfectly, software cannot simply copy and paste the old piuxels, so it must look at the original pixel values surrounding a specific spot to compute what the new pixel should look like
Below is an example of an image processing algorithm discussed in class. Name the general and specific type of image processing used to categorize image pixels into groups used typically for mapping.
Supervised Classification:
Minimum Distance to Means Classifier
Parallelepiped Classifier
Maximum Likelihood Classifer
Unsupervised Classification:
Random Clustering
ISODATA Clustering
Supervised Classification: Minimum Distance to Means Classifer
Centroid of each class is computed
Distances from pixels to centroid are computed
Pixel assigned to the class it is closest to
Analyst can set a max distance, past which the pixel classified as unknown
Supervised Classification: Parallelepiped Classifer
Minimum and maximum valued for each class defined an N-dimensional parallelepiped
Considers range
Pixel assigned to a class if it is wihtin the parallelepiped
Nested parallelepipeds arbitrarily places or resolved in favor of the smallest
Supervised Classification: Maximum Likelihood Classifer
Gaussian probability function computed for each pixel for each class
Assumption of normality
Pixel assigned to class for which its probibility of membership is the greatest
Can be limited to some number of standard variations
Based on statistical probability
Variance and Covariance
Unsupervised Classification: Random Clustering
Choose random cluster centers in N-dimensional space
Assign each pixel to closest cluster center
Compute new mean cluster centers based on assigned pixels
Repeat until process stabilizes (few pixels are reclassified between iterations) or preset numer of iterations have occured
Unsupervised Classification: ISODATA Clustering
Compute N-dimensional vector from each band’s mean value +- one standard deviations and evenly space starting cluster centroids along vector
Assign each pixel to closest cluster center
Compute new cluster centers based on assigned pixels
Repeat until process stabilizes (few pixels are reclassified between iterations) or present number of iterations have occured
In the space provided, describe what image classification is and how the computer and analyst work together to create the end-product. In your description, include the main differences between supervised and unsupervised classification, and differentiate (describe) the two algorithms shown in 3 above.
Supervised Classification
Select Training Areas
Subjective human influence selects “representative samples” of all land cover types required for the analysis <5% of the pixels used for training
Edit/Avaluate Signatures
Subjective human judgement resolves problems: spectral signatures not separable, or spectral signatures redundant
Two materials reflect the exact wavelengths or there are too many variations of the same material
Classify Image
unbiased machine determines the class into which the unknown pixels are assigned
Evaluate Classification
Again subjective humans evaluate results and define new classes to change things as they desire
Supervised Classification
Training stage: analyst determines source identity
Classification stage
Output stage
Unsupervised Classification
Clustering algorithm: defines the spectral classes automatically, analyst determines land cover for some spectral signature shapes developed
Classification stage: machine determines the class into which the unknown pixels are assigned
Analyst determines land cover through comparative visual interpretation and reference data
Name and describe how you would apply image classification in your major or in the Air Force.
Image classification is highly impactful for my major, as it can be used to identify a fire early on while it is still small by training the computer to recognize smoke and fire patterns. Using this, you can submit photos of large areas and the machinery will be able to classify any smoke/fire found in an image. You can also use image classification to show the impacts post fire, but teaching and using an algorithm to identify where in the image there are dead and burned trees vs alive trees.
Describe in detail what a remotely sensed digital image is. In your description use and clearly describe the following terms: PIXEL, digital number (DN), band, color-gun, spatial resolution and ground sampling distance, spectral resolution, radiometric resolution.
Remotely sensed digital image: a picture of the earth’s surface captured by sensors on satellites, aircraft or drone
Pixels: the smallest, fundamental unit of programmable information that makes up a digital image. In digital photography and remote sensing, images are structured as a grid or matrix of these tiny square cells, much like a mosaic
Digital Number (DN): a raw, unitless integer assigned to a pixel in a remotely sensed image. It represents the intensity of electromagnetic radiation recorded by the sensor for that specific ground area. Digital numbers are the foundational data from which all visual and analytical satellite imagery is built.
range of DN values depends on the bit-depth; lower DNs = dark areas, higher DNs = bright areas
Band: specific, narrow range of wavelengths within the electromagnetic spectrum that a sensor is degined to record
A digital image is composed of multiple bands, which are staked/layered datasets of the same geographic area
Color gun: an electronic mechanism within digital display screens that emits varying intensities of red, green, and blue (RGB) light to form colors on a screen
Remote sensing satellites capture data across mutliple sections of the electromagnetic spectrum, known as bands. Because computer monitors and display screens function on the RGB additive color model, image processors use three individual “color guns” to display this data
Spatial Resolution: describes the real-world area represented by a single pixel in a digital image
Ground Sampling Distance (GSD): the physical measurement of this resolution on the ground
Spectral resolution: the ability of a remote sensor to distinguish between different wavelengths of light across the electromagnetic spectrum
defined by number of spectral bands and their width
Radiometric resolution: a sensor’s sensitivity to detect subtle variations in reflected or emitted electromagnetic energy
this dictates the number of possible brightness levels each pixel can store, typically expressed as bit depth
Description Paragraph
A remotely sensed digital image is a picture of the earth’s surface captured by sensors on a type of aircraft. The picture is composed of a grid of pixels, or the smallest unit in a digital image. These units represent a specific area on the ground and are given a digital number or numerical value that represents the intensity of energy measured by the sensor. The amount of pixels in an image dictates the spatial resolution, as the level of detail is determined by the size of the area that each pixel represents. The actual measurement of this area, for example 10m x 10m, is known as the ground sampling distance (GSD). More and smaller pixels per image means more detail, and less and larger pixels per image means less detail. An image’s resolution can also be measured in two more ways. Spectral resolution refers to number and width of the wavelengths the sensor can record and the radiometric resolution refers to the ability of the sensor to detect small differences in brightness or reflectance (determines how many levels of brightness there is in an image). The image is also made up of bands, or layers of data representing a portion of the electromagnetic spectrum. A color-gun projects beams of colored light (red, green, and blue) at varying levels of brightness in order to create the image and produce many distinct colors within the image.
During the course we have talked specifically about four different types of resolution. Describe the following types of resolution.
Spatial resolution: measures the size of the smallest detail
The physical size of a single pixel on the ground, referred to as GSD (Ground Sampling Distance)
High spatial resolution = smaller pixels, show small features
Lower spatial resolution = larger pixels, represent broad average
Best for identifying individual features
Temporal resolution: measures the frequency of the captures
The amount of time it takes for a sensor or satellite to fly over and capture an image of the exact same geographic location
High temporal resolution = frequent visits
Low temporal resolution = infrequent visits
Best for monitoring dynamic events like wildfires, flooding, or agricultural growth
Radiometric resolution: measures the depth of brightness levels
The sensitivity of a sensor to differentiate between slight variations in reflected or emitted energy (brightness); it is determined by “bit depth”.
High radiometric resolution = high bit depth (16-bit images have 65,536 possible grayscale values) - has the ability to distinguish between subtle gradients
Low radiometric resolution = low bit depth (8-bit images have only 256 possible grayscale values)
Best for detecting subtle changes in temperature
Spectral resolution: measures the wavelengths of light
the number and width (or narrowness) of the specific wavelength bands an instrument can record across the electromagnetic spectrum
High spectral resolution = many narrow wavelength bands
Low spectral resolution = a few, broad wavelengths
Best for differentiating materials, determining crop health, and identifying mineral compositions