sustainable energy chp. 3
1/51
There's no tags or description
Looks like no tags are added yet.
Name | Mastery | Learn | Test | Matching | Spaced | Call with Kai |
|---|
No analytics yet
Send a link to your students to track their progress
52 Terms
goal of energy systems analysis methodologies
understand energy production and supply systems and relationships to consumer energy and economy
analysis
identify and evaluate sustainability issues and potentially beneficial developments
constraints
money is not subject to physical constraints
energy is subject to technological and resource restraints
energy systems must deliver energy that is
economical for consumer and profitable for investors
conceptualization of an energy system
flow of energy measured in mass (tons of coal, barrels of oil
flow of capital for buying and selling can be measured in dollars or embedded energy or resources
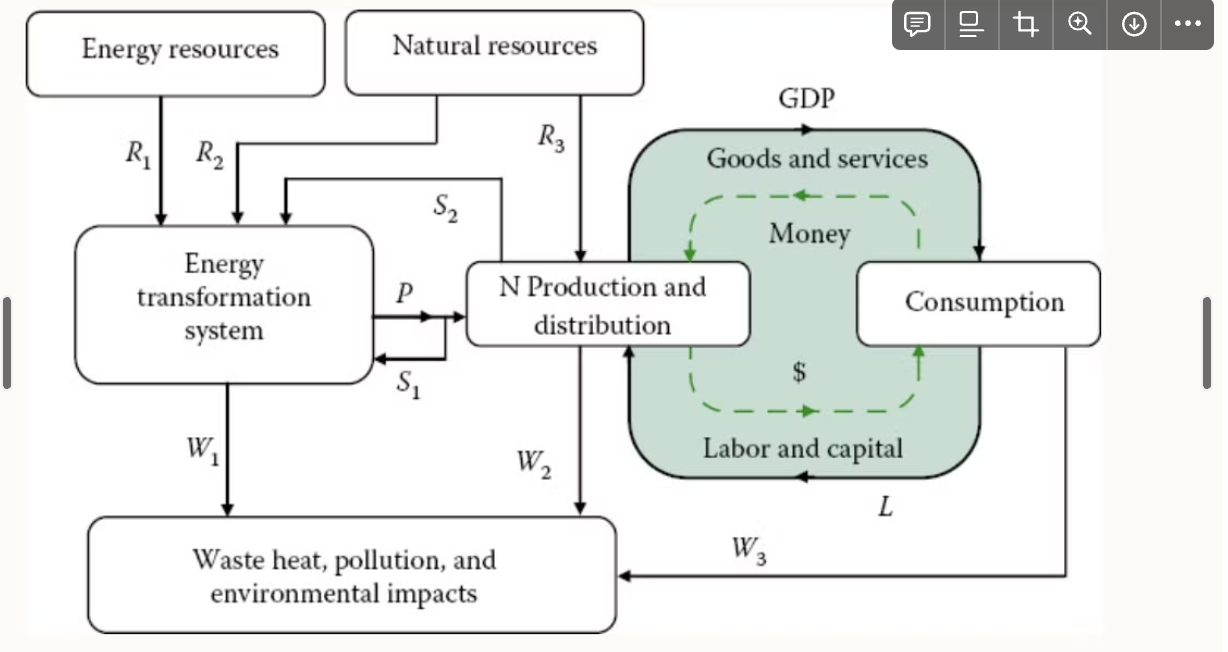
common characteristics of energy and resource flows
flow of energy consumed by transformation plant (S1)
flow of capital equipment (S2)
production (GDP)
indciators of energy and resource characteristics of the economy
energy conversion efficiency
energy resource intensity
energy intensity of the economy
energy return on energy invested
net energy to the economy
embedded energy
externality loading of conversion
lifecycle assessment
external costs
levelized cost of energy
energy prosperity
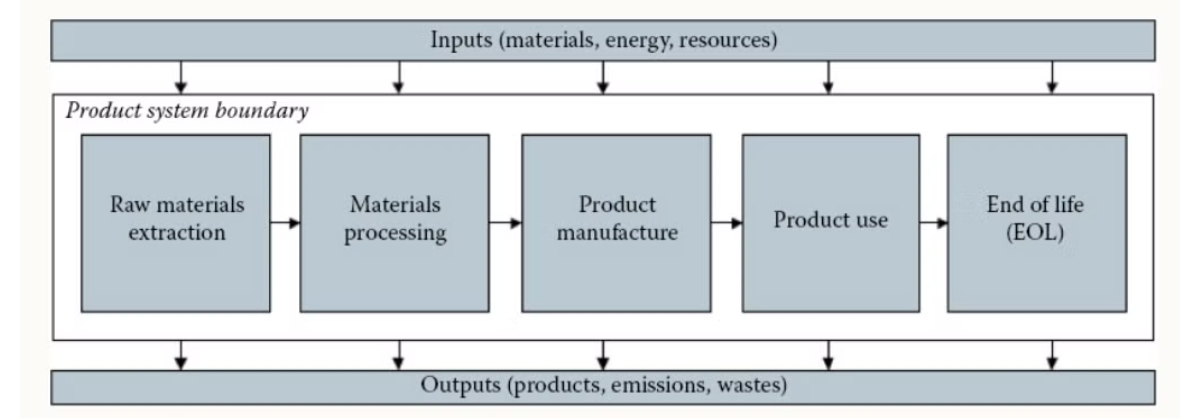
life cycle approach (LCA)
considers full life cycle of a product or service, starting from raw material extraction and processing through to disposal, reuse or recycling (cradle to grave)
useful for comparing costs of competing energy tech
must set clear scope and boundaries
environmental LCA
inventory energy and material requirements that go into producing a product along with environmental discharges and waste
may even assess impacts on resource use, air and water quality, climate, etc.
consequential LCAs
examine how a new product or tech might alter energy resource flows beyond direct use
4 keys steps to LCA
goal definition and scoping
conducting life cycle inventory of energy and material inputs and outputs
assessment of impacts associated with energy and material flows
interpretation
*must choose functional unit for assessment
international organization for standardization (ISO)
independent development organization of representatives from national standards organizations of member countries
make international standards- some for environmental LCA
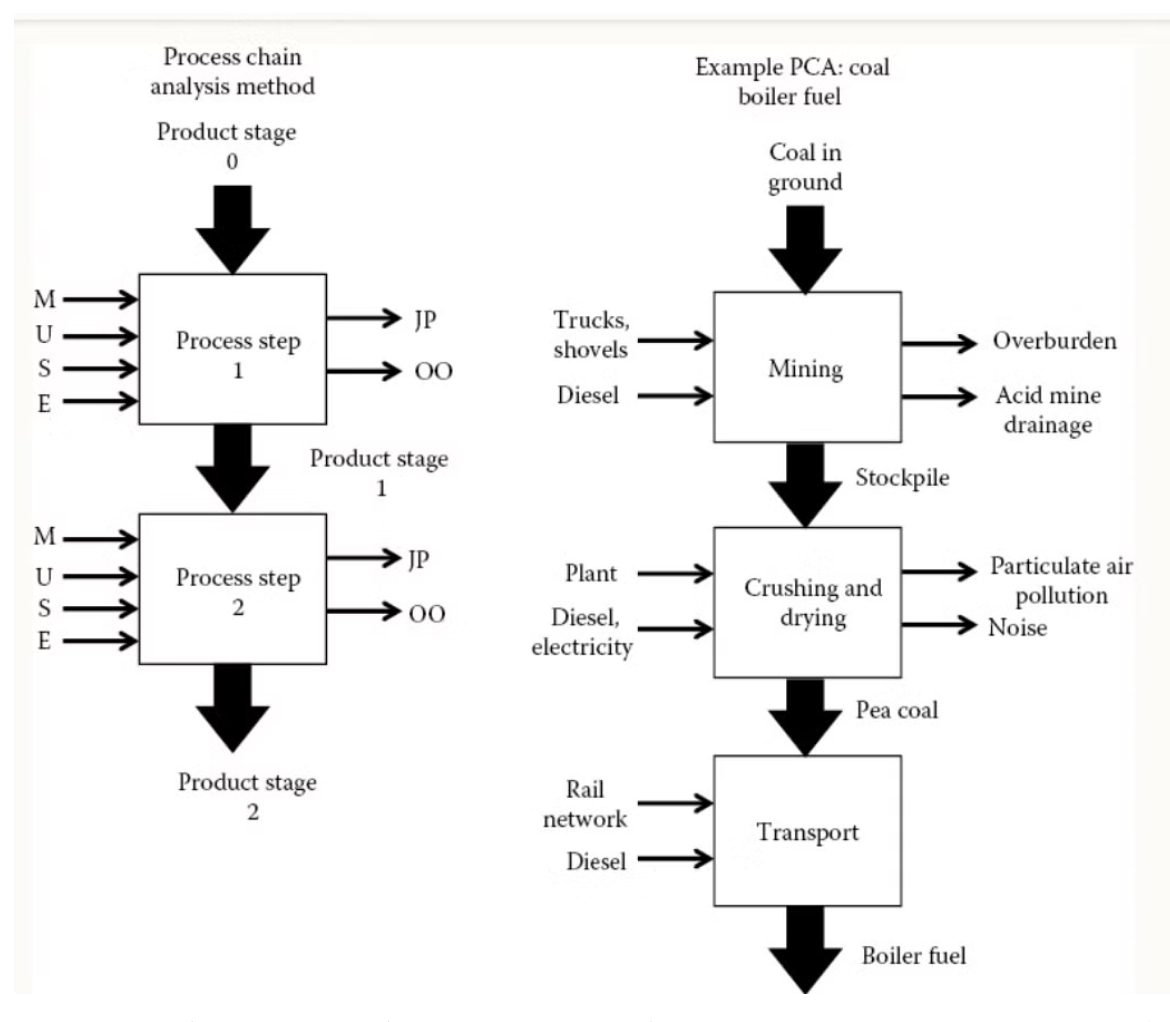
process chain analysis
tool used for auditing any system of a production process or product life cycle
take account of energy and resources needed and waste produced over different production steps
used in another analyses
production steps are separated and inputs and outputs identified at every step
process chain inputs and outputs
utilities (U)
services (S)
materials (M)
equipment (E)
joint products (JP) and other outputs (OO)
elementary inputs
material or energy entering a system that has been drawn from the environment without previous human transformation (coal or groundwater)
elementary outputs
wastes released into the environment that will not undergo subsequent human transformation (CO2 emissions)
input-output (I/O) analysis
used by economists to characterize the effect of production in one section of the economy on other sectors of the economy
I/O example
2 sector economy- not common
corn and biofuel, casual loops
complete transactions tables
show requirements from each sector needed to produce unit output for each industry- found by dividing entries by total input for each commodity
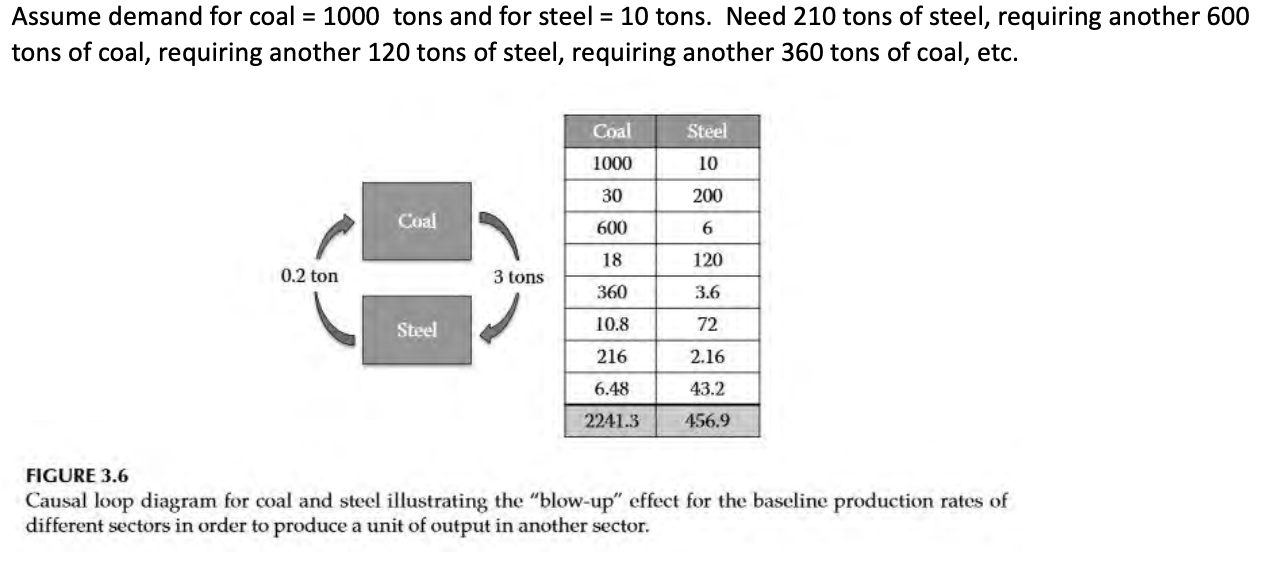
benefit of input-output analysis
requirements matrix can be used calculate not only direct purchases required to produce given product but also indirect purchases
can be conducted in terms of material flows or money
I/O analysis in terms of energy
E= RX
E- vector of energy or environmental effects
R- square matrix with diagonal elements that represent energy use or environmental burden per dollar
X- vector of required production (dollars)
embedded energy (EE)
calculated through PCA or I/O analysis
measures cost associated with extraction, processing and supply chain
calculated for 1977 and adjusted to 2008 using consumer price index (CPI) of 3.51 due to inflation
consumer price index (CPI)
measure of price of consumer goods and services
lower kWh does not mean production is more efficient, mostly due to inflation
energy intensity
ratio of all such energies to dollar value of product produced
energy intensity values have
decreased significantly for all listed materials and commodities
energy return on energy invested (EROI)
measure of energy profitability of an energy transformation system and
indicates availability of energy to meet demand and provide a surplus
can be evaluated for whole energy system in given year or assessed for particular technology over useful life of the planta
EROI formula
EROI= P/(S1+S2)
P- rate of energy production
S1- conversion energy input
S2- embodied energy in various items used by production system
EROI example
18th century farming
S1- food for animals and workers + wood for heat
S2- capital equipment, plough, harnesses
p- produce taken to market
EROI values
large EROI farm- prosperous, well fed
low EROI farm- poor, hungry
negative EROI farm- no farm
strongly positive EROI is the underlying factor for prosperity
payback period
point at which cumulative net energy return reaches zero
in an energy system, profit is
the net energy
net energy yield “N”
can be assessed on yearly basis or lifetime of plant
-may be negative yield at early stages
for primary production
prosperity is more determined by ability to return positive net product to economy than by the prices attached
measure of prosperity
N/P= 1-1/EROI
N/P= 95% implies that all of the energy sector were returned to the economy as useful energy production with 95% rate of return
once N/P < 5, eroi decreases rapidly
highest EROI of any power generation platform
hydroelectricity
-40-100
-can be built at natural outlet of lake
-areas where hydro generation was built developed prosperous economies because of plentiful on demand electricity
second highest EROI
coal
~10
today energy intensity is increasing
and EROI of fuels and electricity is declining
calculating EROI
complicated especially for renewables, depend on a source that varies with time of day, year, location, conventional energy is constant
use embedded standard energy values
use dollar costs for each item, then multiply by energy intensity factor
energy budgets
key for planning a sustainable energy future
budgets include:
energy required to maintain the energy infrastructure
energy required to drill for oil, mine coal, obtain materials for PV cells and wind turbines
energy needed to find more resources
remaining energy, comparing budgets
basic needs to suppport standard of living- health, shelter
discretionary uses associated with lifestyle- entertainment, the arts
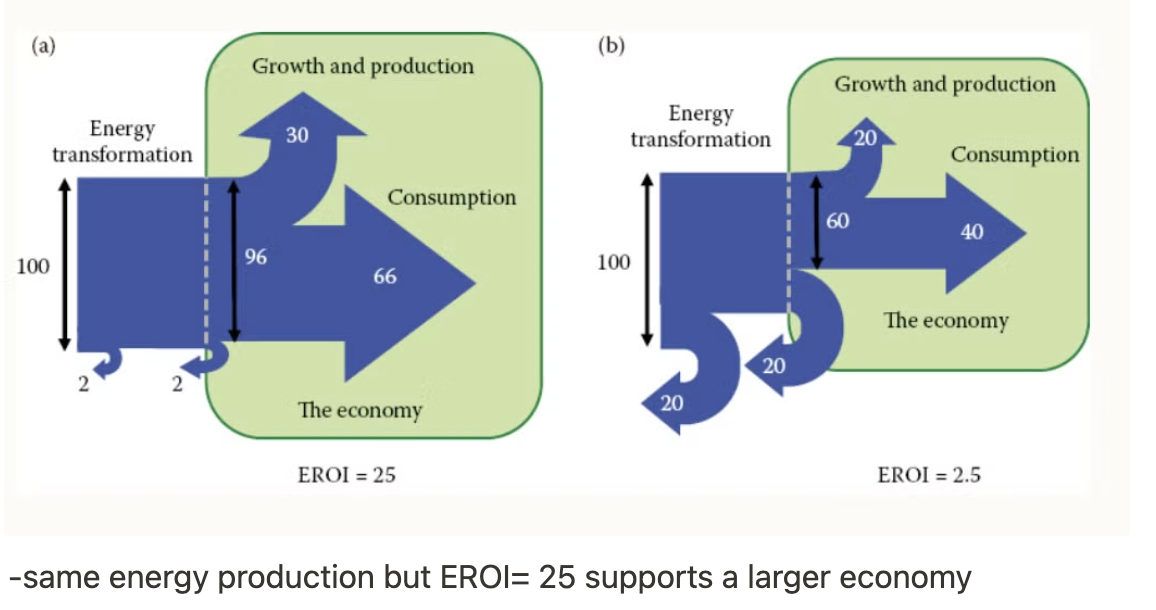
*higher EROI supports a larger economy
changing EROI of hydrocarbons
EROI has declined over last 70 years because companies have to drill deeper, higher failure rate, and find smaller fields
1970 EROI ~25
today EROI 3-4
tar sand <5, harmful to environment, oil shale ~2
EROI of renewables
wind- ~30-60
EROI math
total power output x lifetime of system
or total output/total input
convert to kWh, multiply 365 day/yr times 24hr/day
maximizing EROI for renewables
they depend on the lifetime of the system, important to engineer these to maximize lifetimes
greenhouse gas accounting
in the 90s, need for standard protocol for businesses to perform greenhouse gas accounting
corporate accounting and reporting standard- published 2001, revised 2004, used to track and report emissions
companies use GHG accounting to
identify opportunities to reduce emissions
fulfill requirements of voluntary or mandatory reporting programs
support participation in carbon trading markets
report to the public
GHG protocol requires reporting of emission of 7 GHG
carbon dioxide (CO2)
methane (CH4)
nitrous oxide (N2O)
perfluorocarbons (PFCs)
hydrofluorocarbons (HFCs)
sulfur hexfaluoride (SF6)
nitrogen trifluoride (NF3)
scope of reporting GHGs (3 tiers)
direct GHG from sources owned or controlled by the company
indirect emissions from generation of purchase electricity used in operations owned or controlled by the company
other indirect emissions that occur as a consequence of the company’s activities but not from direct sources
*companies required to report tier 1 and 2
emissions can be determined through
direct measurements of concentrations and flow rates
engineering estimates
using corporate records of operational activities combined with published emissions factors
measuring combustion emissions- mass balance
required to report emissions of 7 GHGs separately and report combined emissions using
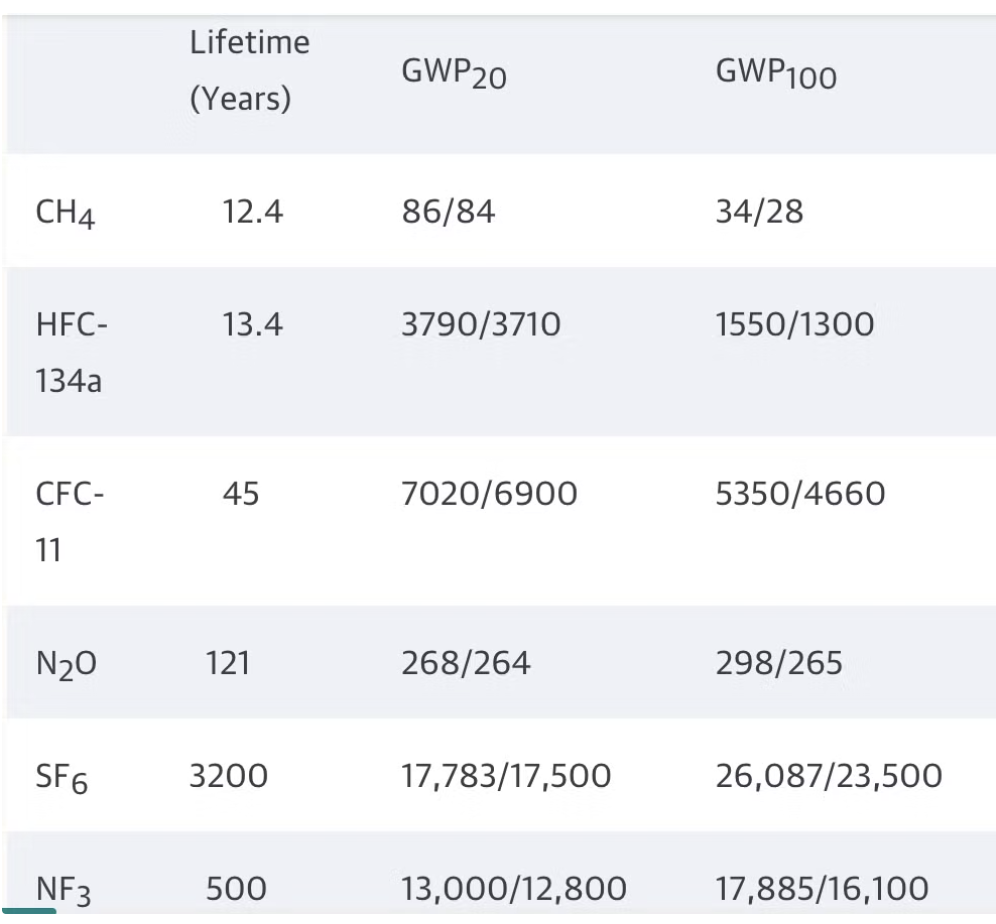
global warming potentials (GWP)
global warming potential (GWP)
amount of energy unit mass of gas will absorb over a given time, relative to amount of energy absorbed by same time period by mass of CO2
reflect differences in IR absorption efficiency
reflect differences in gases’ direct effects
highest and lowest GWP values highest
highest- SF6
lowest- CH4