psych 218 midterm 2 - correlation
1/18
There's no tags or description
Looks like no tags are added yet.
Name | Mastery | Learn | Test | Matching | Spaced |
|---|
No study sessions yet.
19 Terms
correlation coefficient exceptions ®
If you have a curvilinear relationship, the correlation coefficient will be zero.
This is bc r can only handle linear relationships
This does not mean there is no relationships between the variables.
There may be a non-linear relationships between the variables
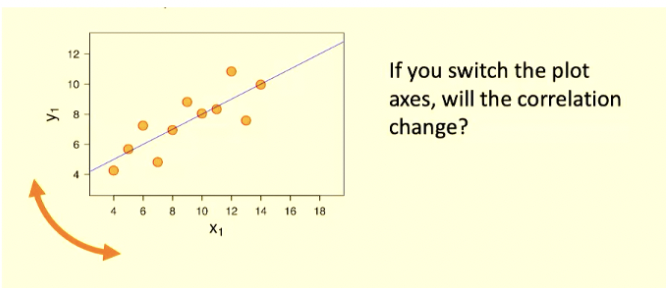
Direction will not change. If it was positive b4 it will stay positive and vise versa
Magnitude will not change
Form will not change
Changing the visualization will not change the relationship between the variables
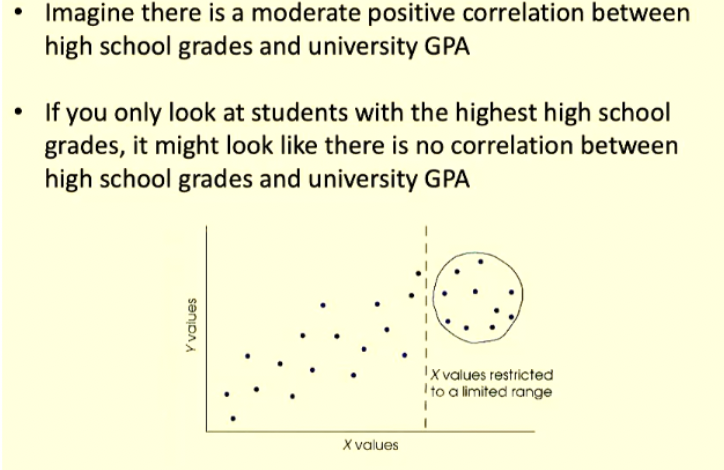
Range restriction
When you have access to only a small slice of the total data
can impact your interpretation of correlations as there could be a correlation when looking at the overall data but when you are range restricted you may be told there is a different correlation/interpretation
3 ways to calculate the pearson correlation coefficient ®
Z score method (dont care about this one)
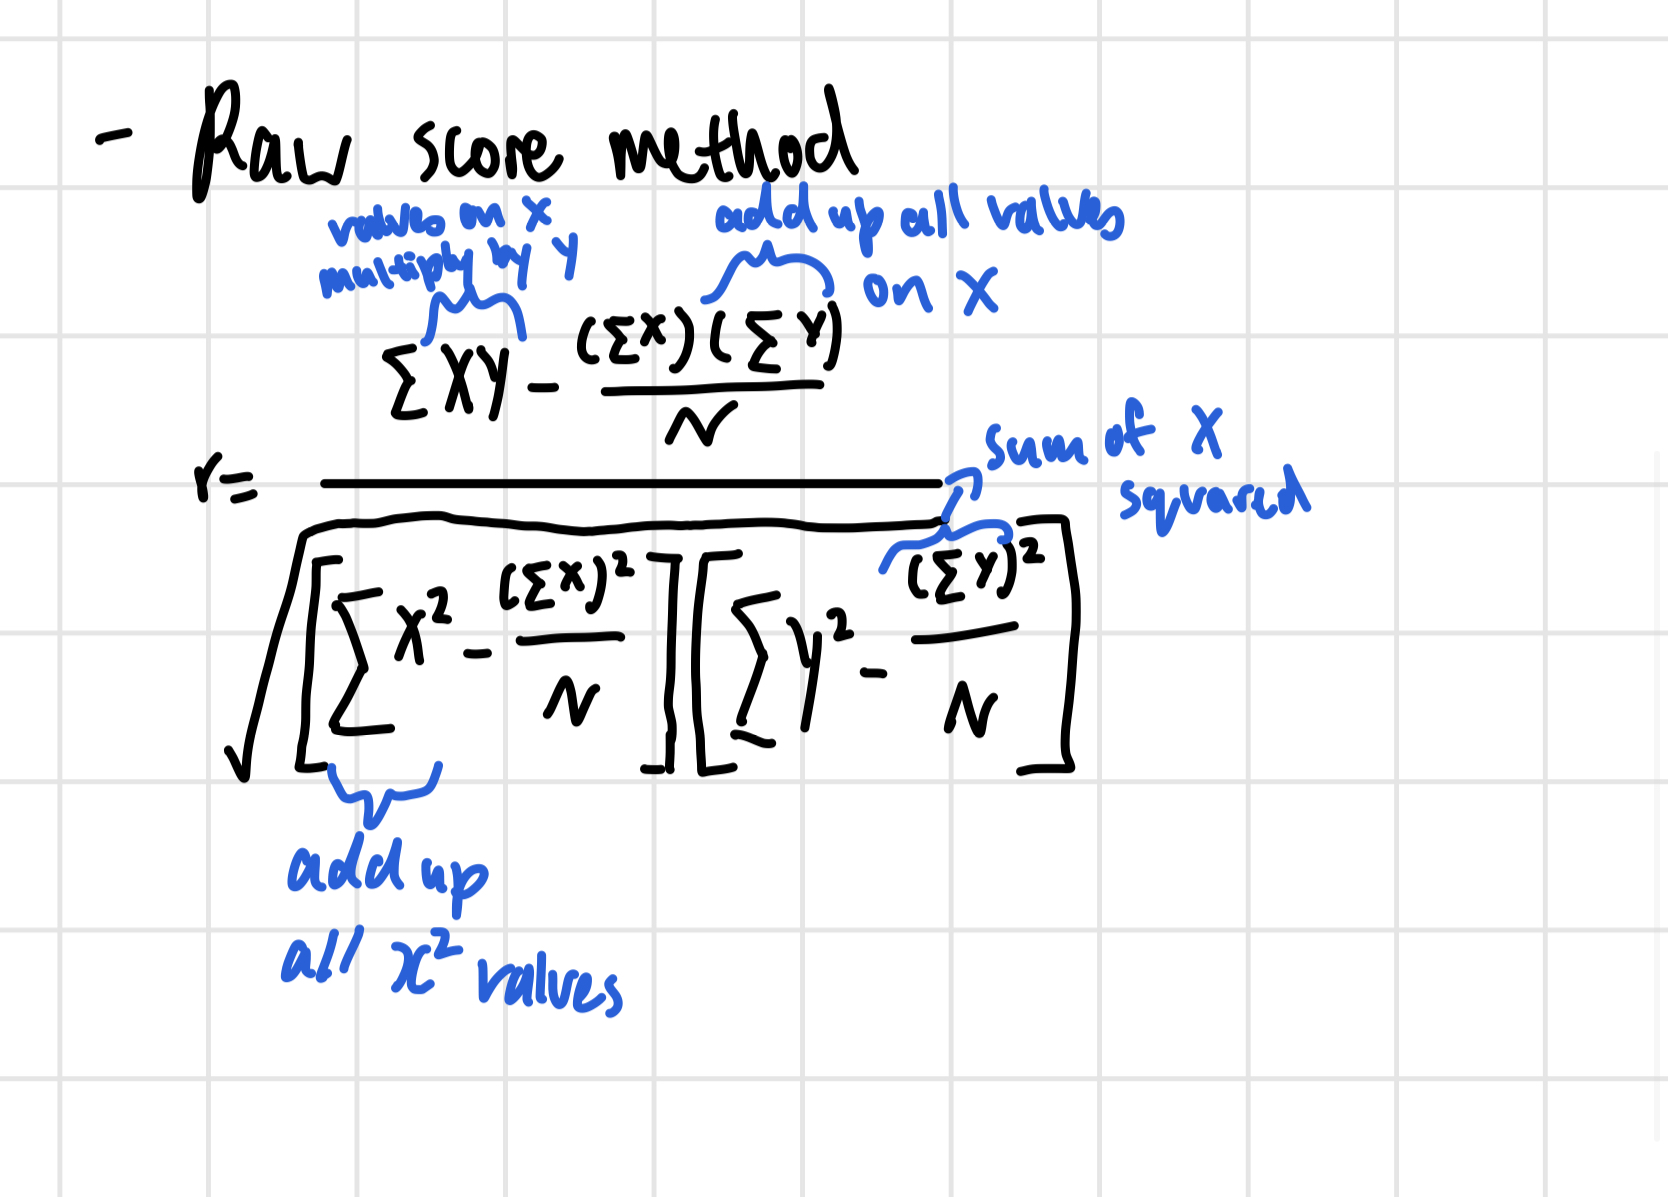
Raw score method
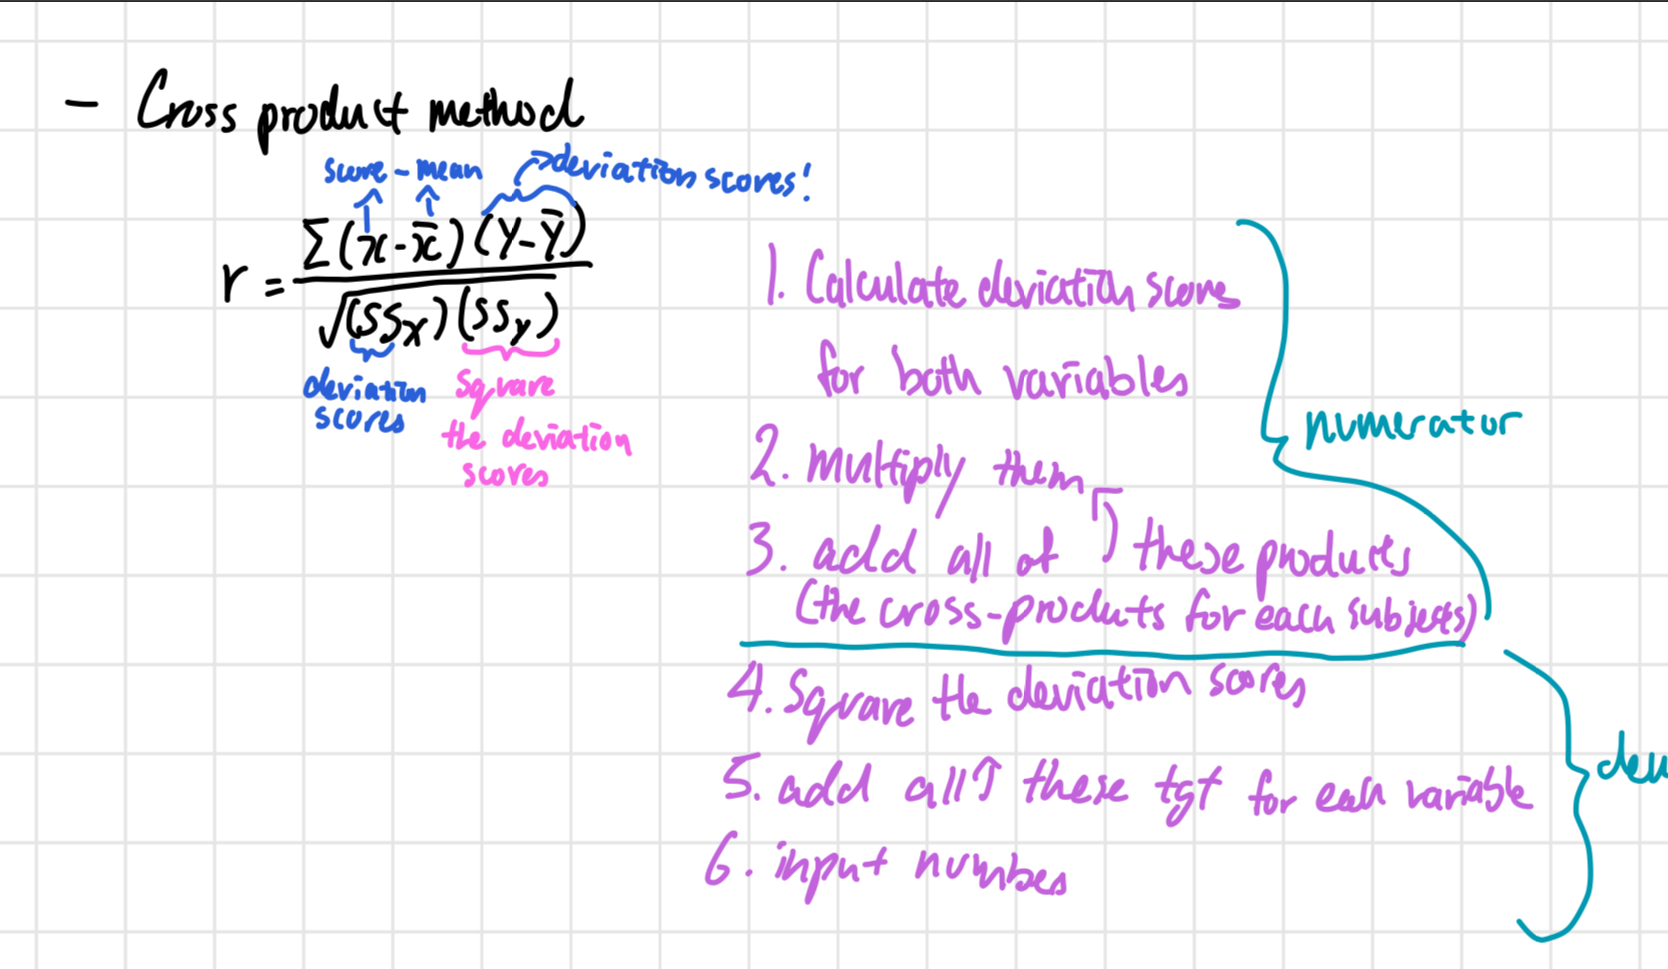
Cross product method
how to do cross product method way of calculation
how to do raw score method way of calculation
How big is the correlation
If r is 0 → no relationship
If r is between 0 and 0.10 → trivial relationship
If r is between 0.10 and 0.30 → small to medium relationship
If r is between 0.30 and 0.50 → medium to large relationship
If r is greater than 0.50 → there is a large to very large relationship
If relationship is curvilinear, the correlation coefficient ———-, can be used to describe the strength of the relationship

(eta → ‘ey-tah’)
What can you conclude from correlations?
A correlation can tell you about the relationship between 2 variables but it cannot tell you about causality
It can be exploratory → be a starting point for more research
Correlations can help when there are ethical constraints. → there are certain variables that are unethical to manipulate so its better to use correlational designs
regression
using correlations to predict and account for differences in scores
How much can we explain (in terms of accounting for variability)
If a correlation is perfect, all of the points line up perfectly —> We can say ‘all of the variability in Y can be accounted for by variability in X’
If the correlation is less than perfect, some variability in Y cannot be accounted for by variability in X
r² expresses the proportion of variability that CAN be explained
r²
To compute r^2, square the correlation (r x r)
Ranges from 0 to 1 (can multiply this number by 100 to get a percentage)
Also called the ‘coefficient of determination’
Measure of effect size

explain the concept behind this visual
Blue square is the variability we can explain, and the remaining area is the area we cannot; we can explain 42% of the variability
Partial correlation

The numbers 123 are all different variables when you are given variables
The correlation between 2 variables when the effect of a third (or fourth, etc) variable has been eliminated (or held constant)
how to calculate partial correlation
First calculate correlation for education and life expectancy
then control partial correlation between education and life expectancy, controlling for IQ
then compare the regular correlation to the partial correlation and note any differences between the two values
If there is a difference when the 3rd variable is accounted for, thats telling you that the 3rd variable accounts for at least some of the relationship between the original pair of variables

what are correlations with binary variables
Variables that have 2 cateogies/values
Can be qualitative or quantitative variables
yes/no, self/other, pass/fail, Mac/PC
You need to apply numbers to each category (0/1, ½, etc)

How to interpret correlation when there are binary variables
Line of best fit would slope upwards, suggesting a positive correlation
High on X is associated with high on Y (and low X with low Y)
Mac = high, PC = low
Thus, having a mac (compared to having a PC) is associated with higher grades
Linear transforms in terms of r²
Linear transforms only ‘shift’ or ‘stretch’ the data but does not affect the correlation coefficient
Exception: multiplying one (but not both) variables by a negative number (you change it to be either positive or negative)
Disparate subgroups
Presence of distinct subgroups (age, gender, class, etc)
Can artificially increase or decrease correlation coefficient
e.g.
When you look at 1 subgroup, theres no correlation. But when you look at the entire picture, there is a positive correlation
