Categorical Data Visualizations F
5.0(1)
Studied by 1 personCard Sorting
1/19
Earn XP
Description and Tags
Pls Andrew pls
Last updated 10:24 PM on 5/30/23
Name | Mastery | Learn | Test | Matching | Spaced | Call with Kai |
|---|
No analytics yet
Send a link to your students to track their progress
20 Terms
1
New cards
What is this?
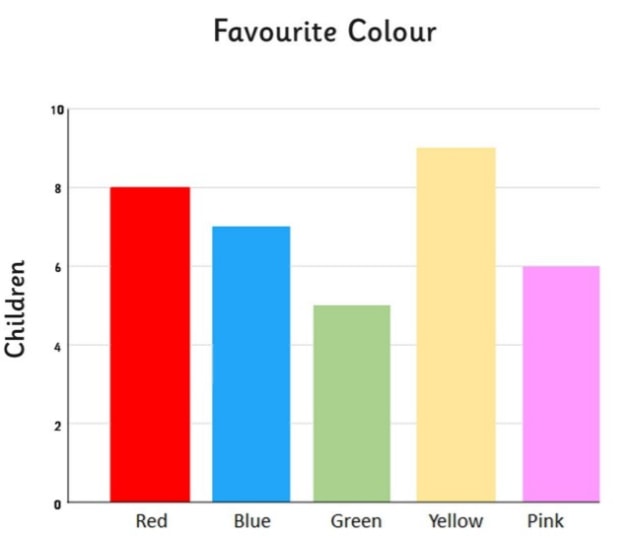
simple bar chart
2
New cards
What is this?
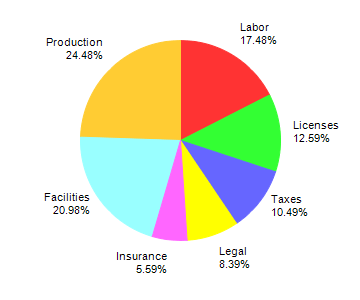
simple pie charts
3
New cards
What is this?
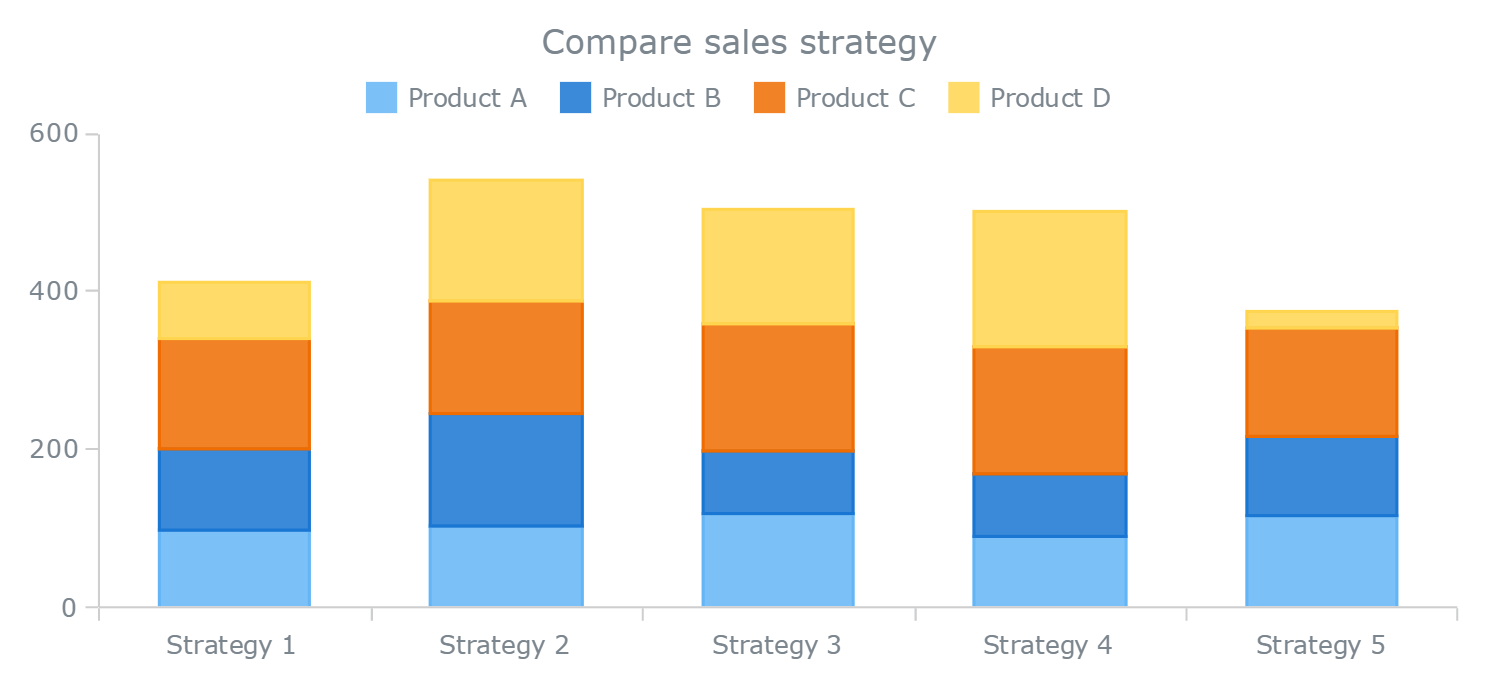
stacked bar chart
4
New cards
What is this?
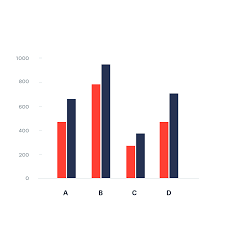
grouped bar chart
5
New cards
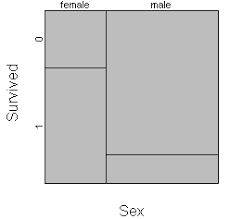
What is this?
mosaic plot
6
New cards
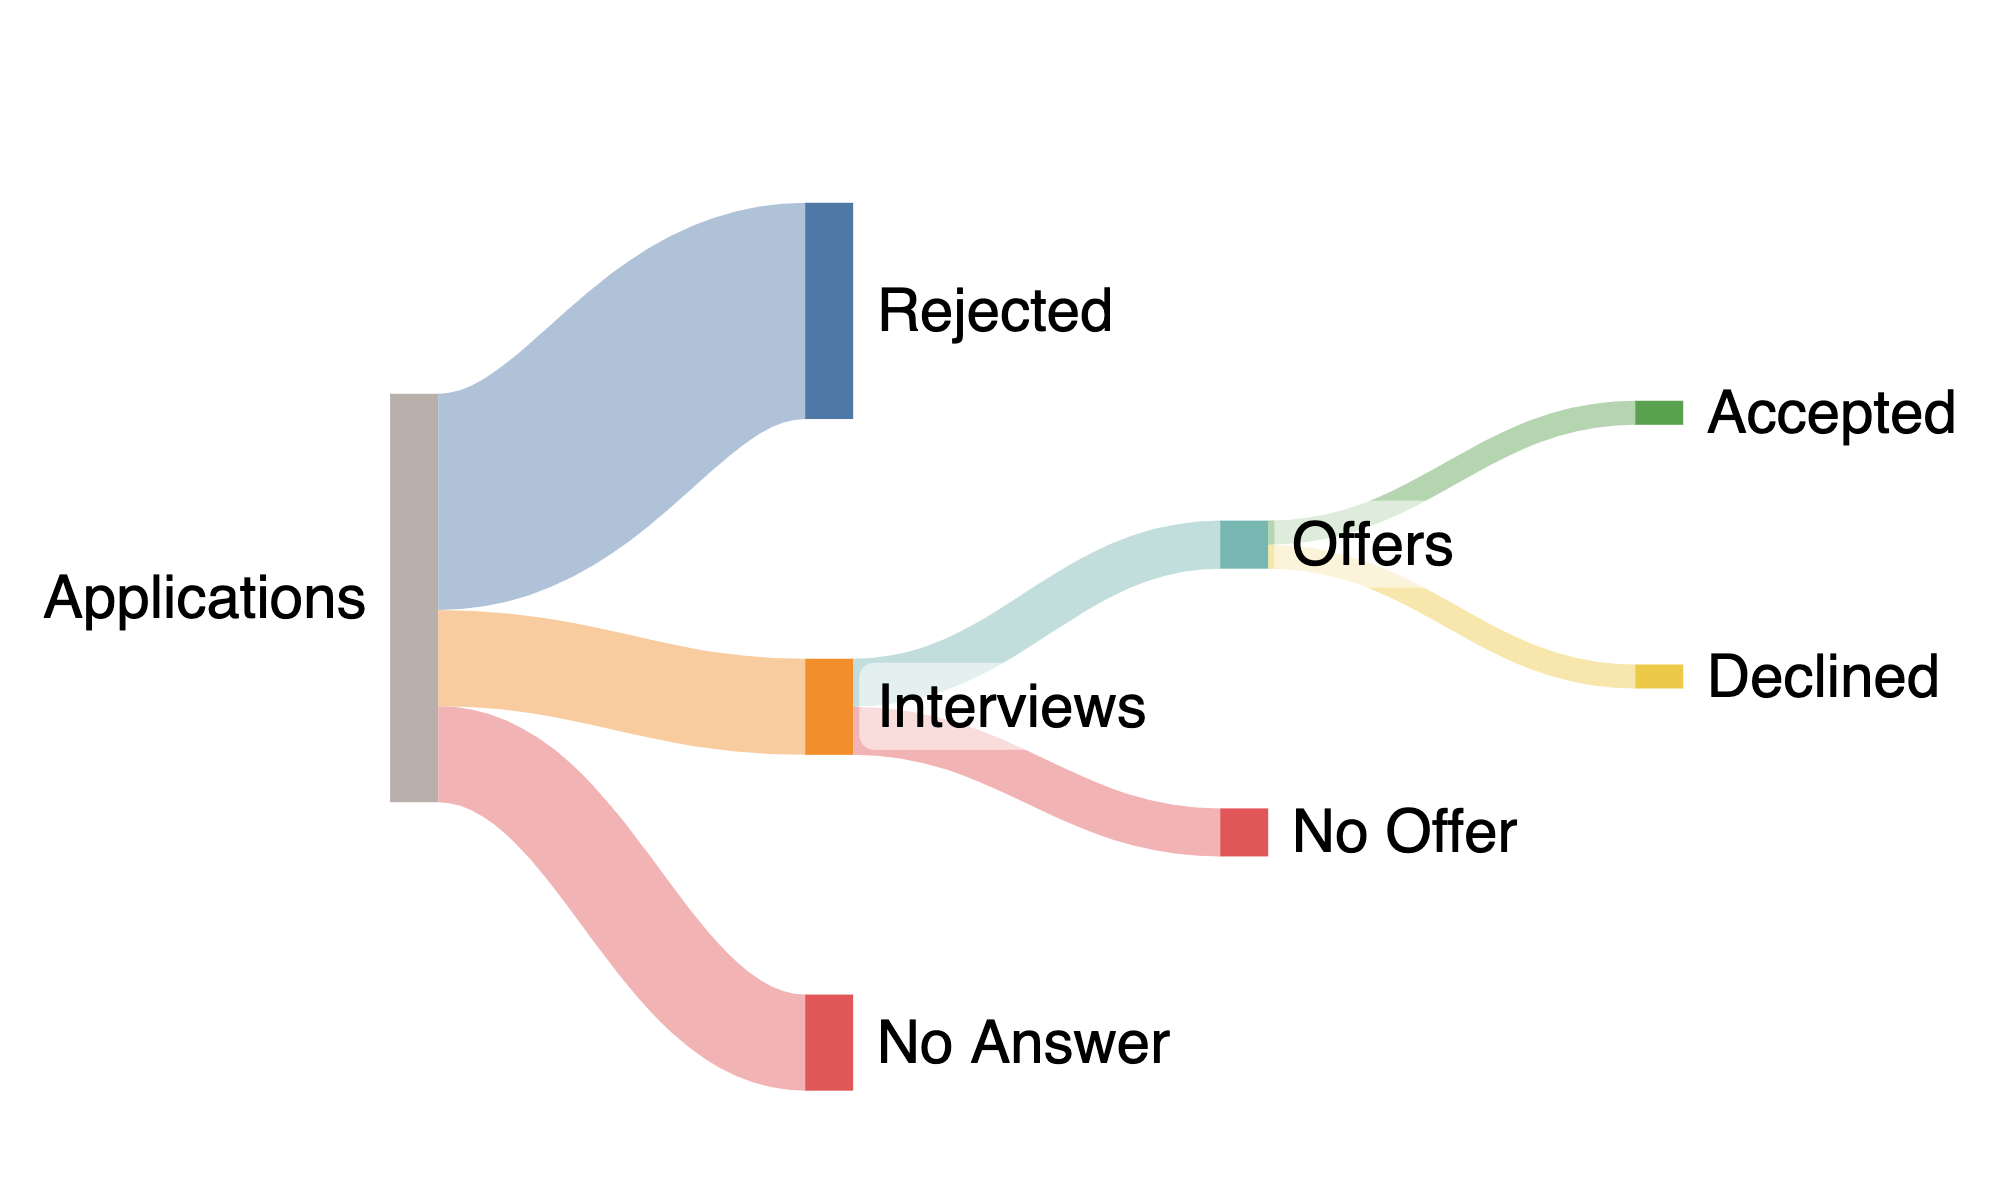
What is this?
sankey diagram
7
New cards
Definition of a simple bar chart
Helps visualize the magnitude for a single set of categories
8
New cards
Features of a simple pie chart
\-circle split into slices that represent values within a category
\-slices are sized accordingly to the proportion out of the whole the value represents
\-numbers are used to label each slice
\-each of the values are distinct to the case
\-slices are sized accordingly to the proportion out of the whole the value represents
\-numbers are used to label each slice
\-each of the values are distinct to the case
9
New cards
When to use a stacked bar chart?
Useful when the sum of the bars represents a meaningful amount or count. Also nice for illustrating the relative sizes in a given category
10
New cards
When to use a bar chart?
\-when there are a lot of values within a category
\-the proportions in the categories are similar
\-we want to compare the proportions of a category across multiple sets
\-the proportions in the categories are similar
\-we want to compare the proportions of a category across multiple sets
11
New cards
When to use a grouped bar chart?
Easier to see differences between categories. Use when emphasizing differences
12
New cards
When to use Mosaic Plots?
Helps show relationships and provide a visual way to compare independence between groups.
13
New cards
Definition of Sankey Diagrams
Illustrates the “flow” from one set of categories to another
14
New cards
Marginal Probability
Has to do with one**;** ex, the probability of randomly selecting a passenger from first class or survival status __**overall**__
15
New cards
Joint Probability
Multiple (2 max); ex, the probability that a randomly selected passenger survived __**and**__ was first class
16
New cards
What graph to use in joint probability
grouped bar chart
17
New cards
What graph to use in marginal probability
pie chart
18
New cards
Conditional Probability
the total amount (something like only first class); ex, the probability that a passenger survived __**given**__ that they were in first class
19
New cards
What graph to use in conditional probability
stacked bar chart
20
New cards
How to asses independence between two categorical variable via a stacked bar chart or mosaic plot?
Putting two bars next to each other that are different categories; the areas are proportionals to the joint probability of each category