applied maths
1/16
There's no tags or description
Looks like no tags are added yet.
Name | Mastery | Learn | Test | Matching | Spaced |
|---|
No study sessions yet.
17 Terms
mutually exclusive rule
P(A) + P(B) = P(A∪B), P(A∩B) = 0
Generalised addition law
P(A∪B) = P(A) + P(B) - P(A∩B)
Independent events
P(A∩B) = P(A) x P(B)
Binomial conditions
fixed number of trials
event is a success or a fail
constant probability of success
trials are independant
binomial notation
X ~ B(n,p)
Poisson conditions
singly in space or time (e.g telephone calls in an hour)
at random
independently
at a constant rate - the mean number of occurrences in the interval is proportional to the length of the interval
opportunity sampling
take a sample from members of the population you have access to until you have a sample of desired size
advantages: doesn’t require size of population
disadvantages: unrepresentative
systematic sampling
divide population by sample size then go up by this number
advantages: easy to select
disadvantages: less random, predetermined
random sampling
generate sets of numbers, number the population, pick numbers ignoring repeats and numbers outside the region
advantages: equal chance
disadvantages: requires a list
stratified sampling
proportional to the size of group: sample size/population x group size
advantages: fairly representative
disadvantages: requires a list
outliers formula
lowest outlier:
Q1 - 1.5 x IQR
biggest outlier:
Q3 + 1.5 x IQR
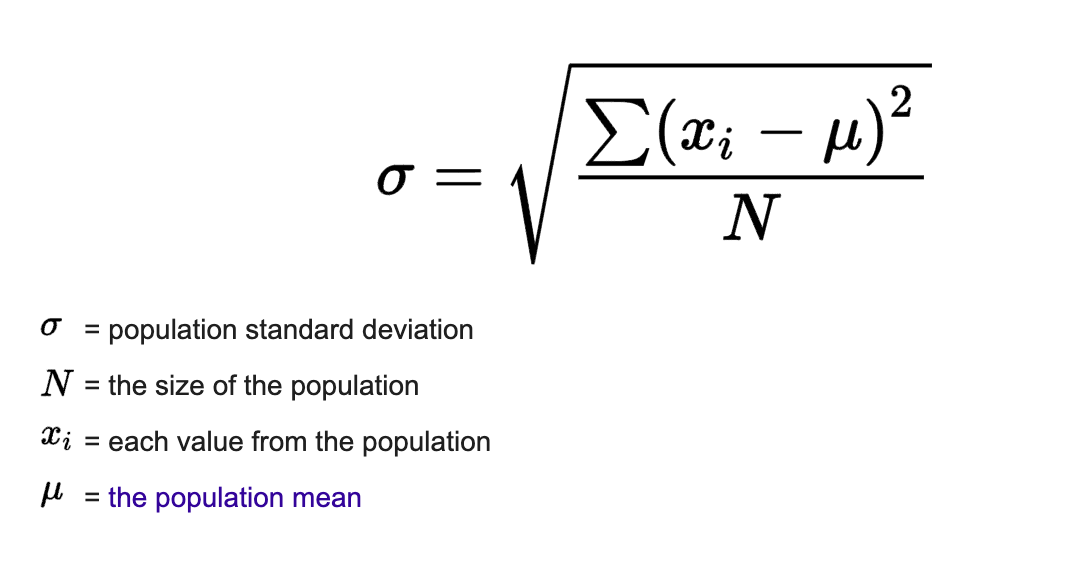
standard deviation
find the mean of the numbers
take the mean away from each number
square new column
total up new column and divide by how many numbers there are
square root to get the standard deviation (without square rooting you get the variance instead of standard deviation)
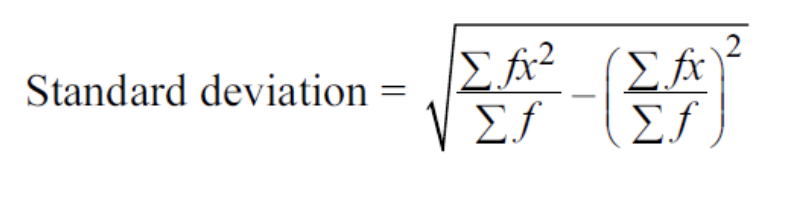
standard deviation using frequency
Σf = the sum of the frequency column
Σfx² = f x x² or fx x x² added up
takeaway the mean²
square root
correlation
correlation does not imply causation
1 = perfect positive, 0 = no correlation, -1 = perfect negative
regression lines
interpolation - generally reliable if variables show a strong correlation
extrapolation - not reliable as there is not evidence that the pattern continues beyond the observed range
interpreting gradient
as the (x variable) increases by 1 (unit) the (y variable) (increases/decreases) by (gradient) on average
interpreting y intercept
it suggests the (y variable) will be (y intercept) when the (x variable) is 0