✅🌸 Unit Zero - Research Methods
1/79
There's no tags or description
Looks like no tags are added yet.
Name | Mastery | Learn | Test | Matching | Spaced |
|---|
No study sessions yet.
80 Terms
Define and give an example of a hypothesis
statement that serves as a tentative explanation; always presented so that it is FALSIFIABLE (can be supported or rejected)
ex: being around trusted friends and family members leads to increased levels of happiness (can be tested - an argument)
What is meant by falsifiable
term meaning that a hypothesis: can be supported or rejected
- able to be proven false
Define operational definition and give an example
a precise description of your variable(s); and how you will numerically measure it
ex: SAT score for intelligence
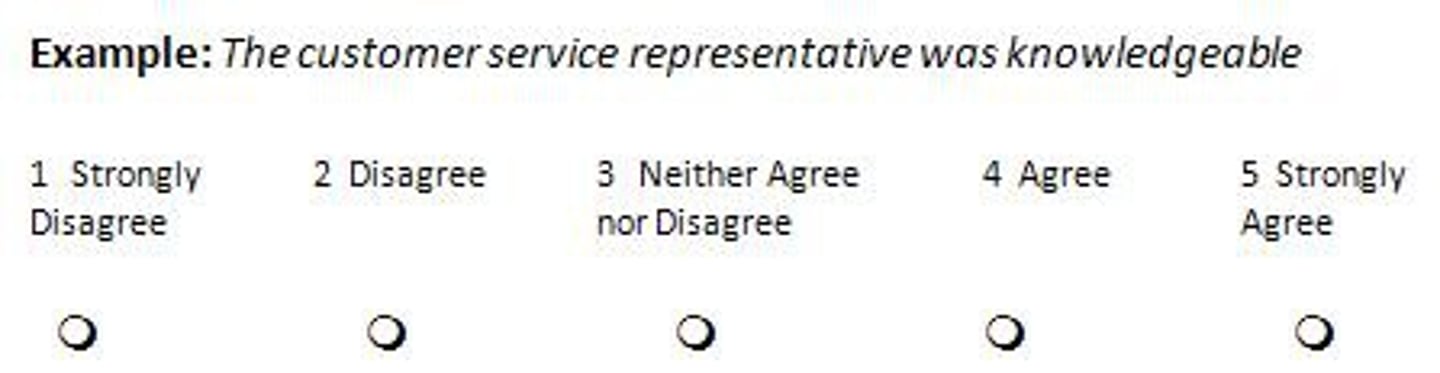
Define and give an example of each quantitative and qualitative data
quantitative: numerical measures + LIKERT SCALEEEE
> ex: how many times a person performs acts of service for helping behavior
qualitative: info that cannot be counted/measured/numerically represented
> ex: peoples reaction to a certain food
Why are operational definitions necessary (3 reasons)
1. allow multiple researchers working on a study to collect accurate and reliable (CONSISTENT) data
2. allows a study to be replicated: exactly repeated in the future
3. helps the peer review process
What is descriptive research? What does it include? What is its purpose?
to describe and gather info based on observing behaviors
includes: naturalistic observation + case studies
purpose: observe and record behaviors
Describe and give an example of and list the advantages and disadvantages: naturalistic observation
observe behaviors in their natural environment WITHOUT interaction
ex: monkeys in natural environment OR how kids play on a playground to study aggressive behaviors
---
pros: looks at situations that cannot be done in a lab (ppl would change their behavior if so)
cons: doesn't reveal cause/effect (why a behavior happens) + might be UNETHICAL to conduct
Describe and give an example of and list the advantages and disadvantages: case studies
a single case (1 person like Kitty, or a group of people who are the same and extremely unique like a cult)
STUDIES IN DETAIL
pros: can obtain vast amount of info about a unique situation (allows you to study things that are impossible to study)
cons: self-report bias from SURVEYS AND INTERVIEWS due to social desirability + wording effects
ALSO cannot generalize the result to the rest of the world -- just that one specific case
What is self-report bias?
(errors due to) asking people to describe their thought, feelings, or behaviors INSTEAD of measuring these directly and objectively
> can result in incorrect answers due to social desirability or wording effect
What is meant by social desirability?
people lie bc they want to look "good"
What are wording effects?
the way a question is phrased -- can alter the answers you get
What is a correlation?
the relationship between two variables
What letter is used to represent correlation?
r
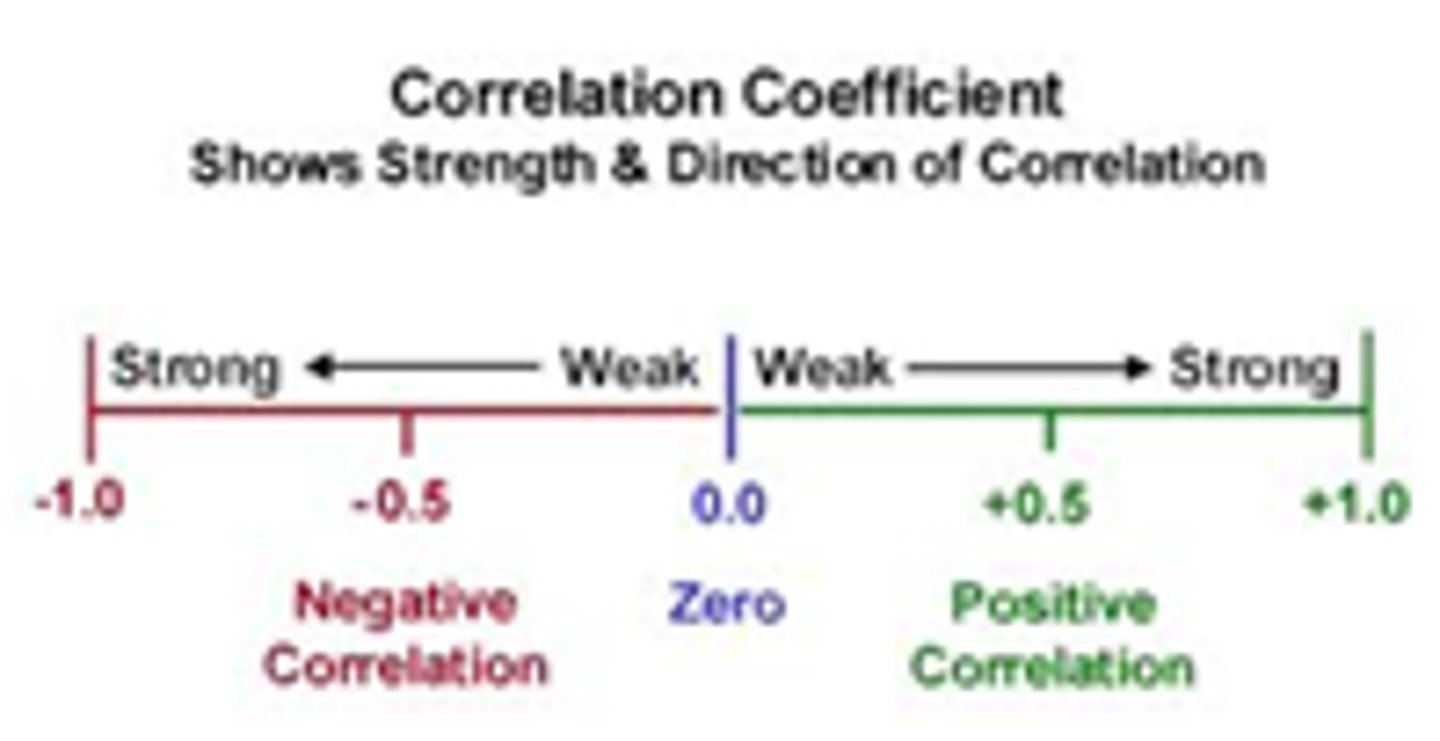
What is the range of correlation coefficients
-1.00 to +1.00
Draw 3 scatterplots and assign a numerical value to: negative correlation, positive correlation, no correlation
pos: r = 0.99 (factors move in same direction)
neg: r = -0.62 (factors move in opposite direction
none: r = 0
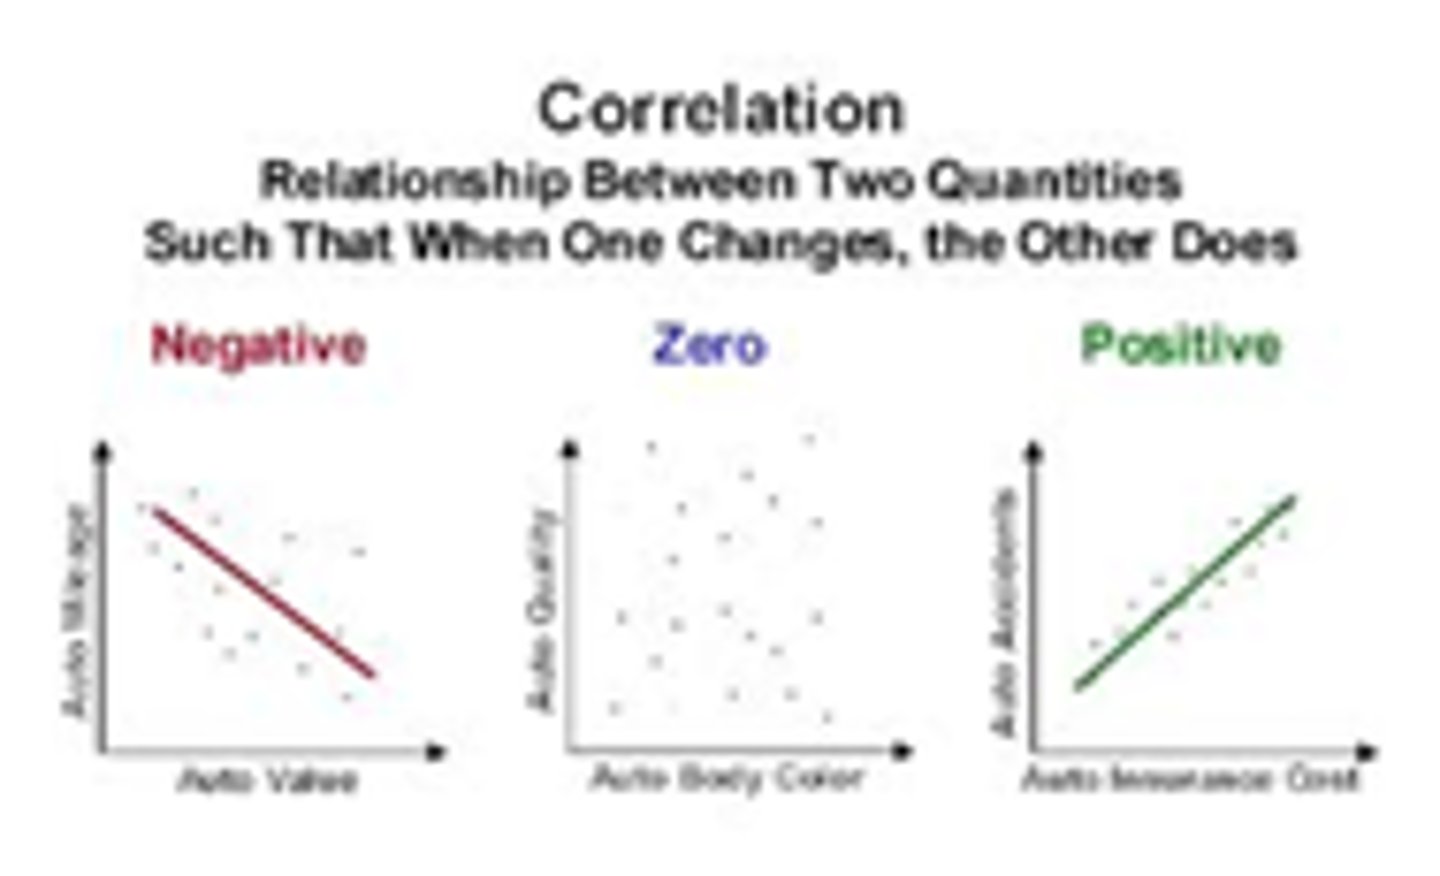
How does the clustering of the dots on a scatterplot indicate strength
if the dots are closer together, it means that the 2 variables have a stronger correlation/relationship
if they are farther apart, they have a weaker relationship
What indicates the strength of the relationship? What indicates the direction of the relationship?
1. the NUMBER VALUE indicates STRENGTH of the relationship
2. the + or - indicates the DIRECTION of the correlation between the two relationships
Miles has discovered that his dog pees on the floor less often when he his home. What kind of correlation is this and why? Bob tries less hard on his homework when he has less motivation. What kind of correlation is this and why?
1. Negative correlation because he is more at home, the dog pees less
2. Positive correlation because variables will both increase in the same direction together
How are correlational studies done
1. take 2 existing data sets
2. collect QUANTITATIVE survey data
then compare the data sets to see how well they predict each other
Why do we use correlational data?
1. to predict outcomes (ex: GPA predicts college successes)
2. look at data that cannot be ethically manipulated in a lab (Ex; depression)
3. can lead to further experimentation (ex: smoking to lung cancer)
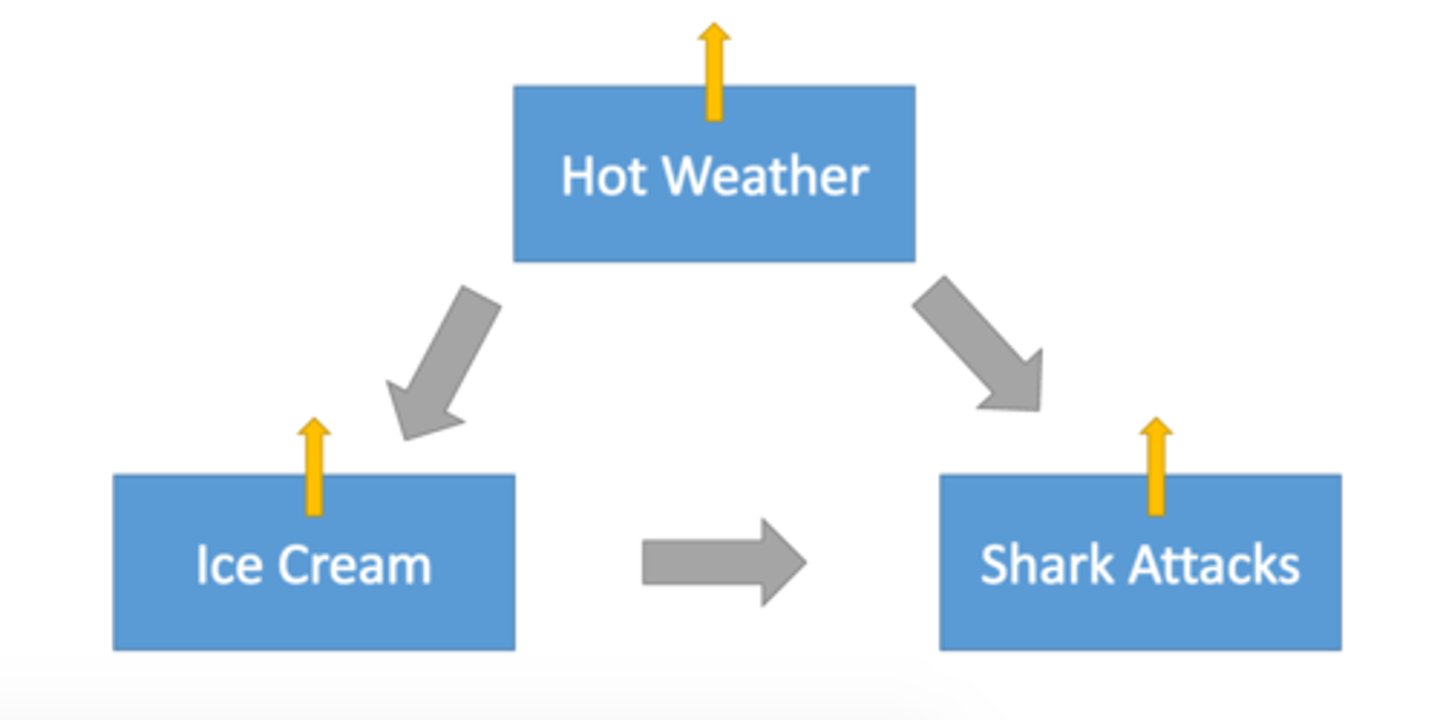
What is meant by correlation does not equal causation?
because we don't control the variables of the relationship, there could be another thing affecting the relationship or the relationship could be by chance
THEREFORE we cannot say its a cause and effect relationship -- only predication
What is the directionality problem?
we don't know which variable is responsible for the relationship
ex: low self esteem could cause depression or vice versa
Define and give an example of third-variable problem
a 3rd intervening variable that causes the relationship between two variables
ex: distressing events/biological predisposition COULD cause the relationship between low self esteem and depression
What is an experiment and why is it best?
a scientific procedure to determine something or test a hypothesis
in experiments: we purposefully manipulate a condition in order to determine a CAUSE and EFFECT relationship -- correlations only show possibility
Define and give an example of: independent variable
variable that is purposefully manipulated/changed (typically in groups)
ex: studying with a type of music -- rap music, country music, pop music, no music
Define and give an example of: dependent variable
variable that is being measured/directly influenced by the independent variable
ALWAYS NUMERICAL
ex: the focus level during a study session
Define and give an example of: experimental group
the group(s) that receive treatment/is manipulated in some way
ex: the rap, country, pop music groups
Define and give an example of: control group
the group that does not receive treatment or is not manipulated/changed in any way
ex: the no music group
Define and give an example of a confederate. When are confederates used?
someone who is acting as another participant in the study (a fake or STOOGE)
ex: 2 calm people n a smoke situation to act as a participant
- used when the researchers need to see what the real participants will do in complex SOCIAL settings
> will help/report back to the researcher
How many experimental and control groups can/should you have?
experimental: several but ideally no more than 4
control group: ONLY 1
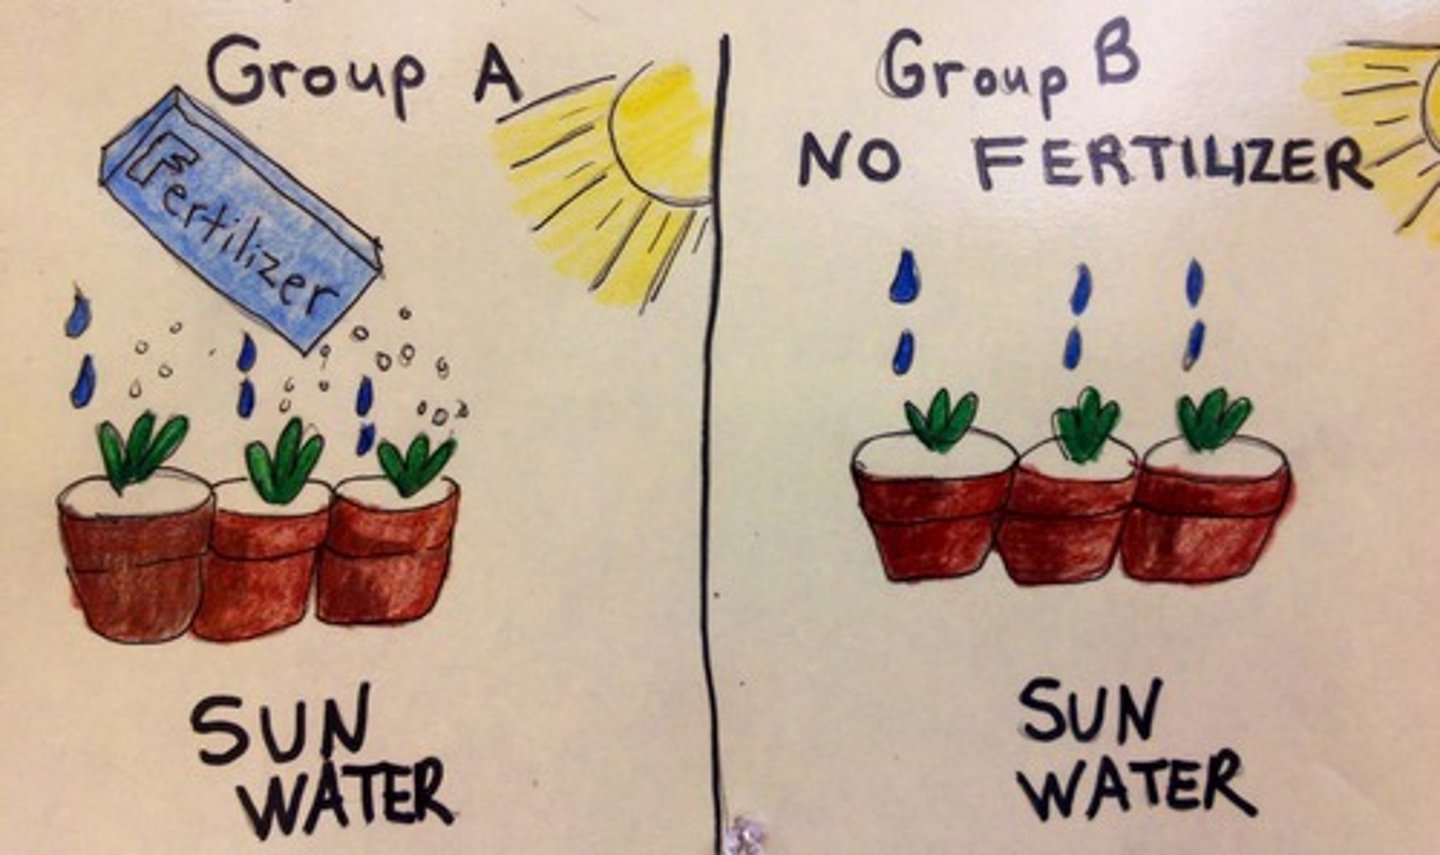
Why is the control group treated identical to the experimental group minus the treatment
to give an accurate representative of what they are testing and see the difference between the experimental group
What is a confounding variable? Give an example
also known as confound
-- anything that could alter your data (known or unknown)
> gives erroneous/wrong results in your analysis
ex: age (in medicine, etc), amount of sleep
Define and give an example of: experimenter bias and participant bias
occurs when the experimenter (consciously or not) has certain expectations about an outcome -- alters their behavior and impacts the results
ex: a researcher having participants act/respond in a certain way
----
occurs when the participant (consciously or not) has certain expectations about an outcome -- alters their behavior and impacts the results
ex: someone taking a drug that makes them sick, then experience as a result
Define and give an example of: double blind experiment
neither the participants nor the researcher are aware of which condition participants are in (i.e. experimental or control)
ex: 5 people take a placebo, 5 other people take a pill to help with insomnia (but don't know if they took the "real" pill, neither does the researcher)
What is a placebo? What is the placebo effect
a drug w no active/real ingredients
can cause the placebo effect: any observed effect on behavior/health that is caused by a placebo
Define and give an example of: single blind design
when the participants don't know which condition they are in but the searcher does
Ex: researcher knows which medicine is real and which is the placebo but the participants don't
Why is double blind preferred to single blind
to eliminate experimenter + participant bias
Define and give an example of: random assignment
assigning participants to the experimental/control group through randomization procedure
each participant has an EQUAL chance being placed in either control or experimental group
ex: a mix of smart + dumb kids, golfers, etc, in a group & not all smart kids, golfers in their own group
What is random assignment -- HOW do we randomly assign
Why do we use random assignment? Give an example
ensures one group doesn't accidentally introduce an extra independent variable (minimize individual differences) by spreading them out in each group
- typically done with a random # generator
ex: not putting all girls in one group
Name two advantages and two disadvantages to experimental research
pros: allows cause/effect + can control/manipulate outside variables
cons: somethings are unethical to experiment on, may have bias (researcher and participant)
Why are experiments the ONLY design type we can use cause/effect statements with
experiments allow for researchers to control the independent variable, allowing them to see the difference between the results of the treatment
Define and give an example of: population and sample
population: entire group of interest
> ex: all the students from a school
sample: subset of a population
> ex: 50 students of the school
Why do we use the sample and not the population
because including everyone (a population) would take too long
Define and give an example of: random sampling
also known as random selection
each member has an equal chance of inclusion in the study
ex: choosing names of 25 employees out of hat from a company of 250 employees
Define and give an example of: representative sample
a sample that matches your population in the demographics/what you trying to compare to
ex: gamers of all ages
Define and give an example of: convenience sampling
selecting participants based on availability/accessibility to the researcher
ex: participants selected based on their willingness to participate
Why do we need random sampling and representative sample?
we need random sampling so researchers can make conclusions, and generalizations about a specific population without bias
we need representative samples so generalization of a specific population can be made
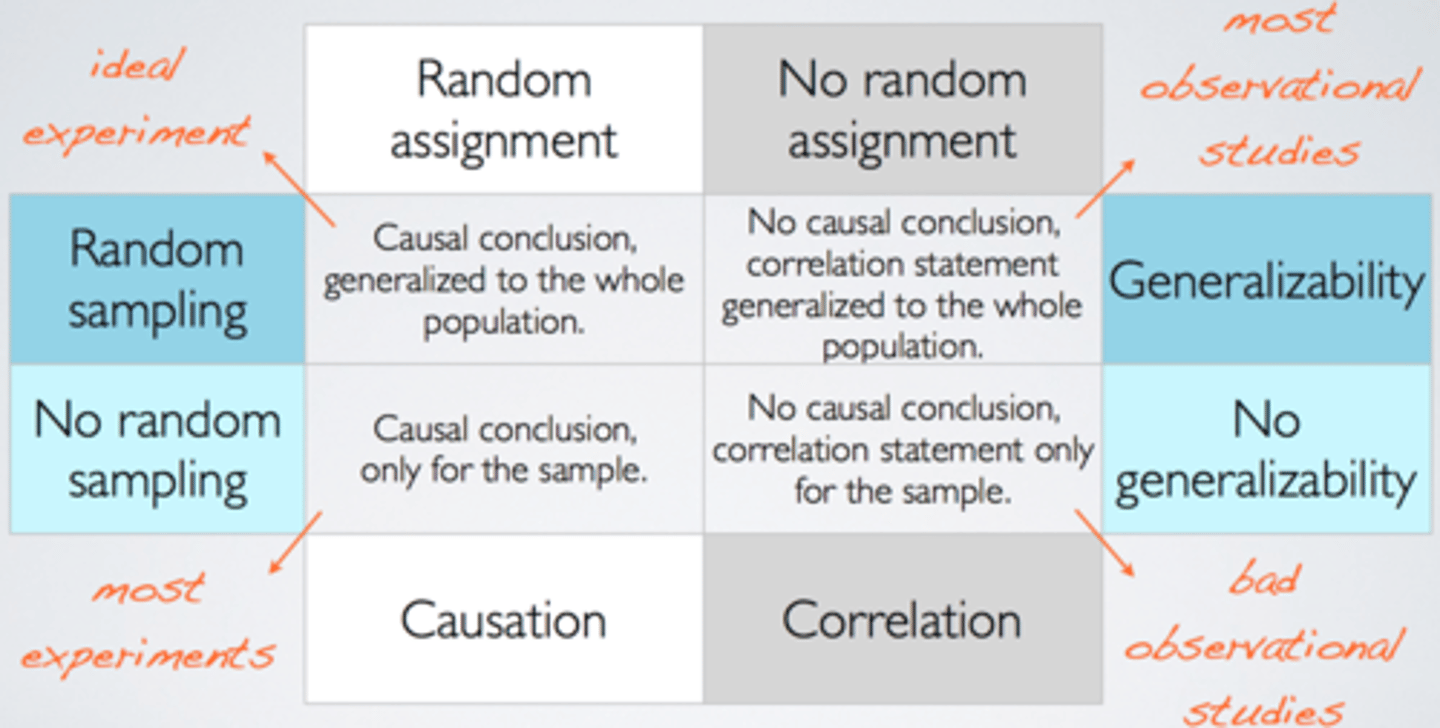
What is meant by GENERALIZABILITY
the conclusions from a study based on a sample population to the full population
What does random sampling allow you to say? What does random assignment allow you to say?
random sampling allows for generalization for a population
random assignment allows for cause and effect conclusions (groups)
What is the IRB? Why was it established
the Institutional Review Board
- protects safety/welfare/rights of human participants in studies
What are the FIVE (5) Considerations of ethical research on humans
What is meant by informed consent, debriefing and informed assent
1. informed consent (agree to be in study, can leave any time)
> informed assents: minors and their parents consent
2. confidentiality/anonymity
3. debriefing (Explain what happened in the study when done)
4. use of deception must be justified must be followed by a full debriefing)
5. do no harm (physical or mental)
nonmalficence - no harm
What is the IACUC
Institutional Animal Care and Use Committee
(Equivalent to the IRB but for ANIMALS)
- use of animals must be justified and minimized
How do animal ethics differ from human ethics
animal ethics focus on minimizing harm done the animal while human ethics focus on informing them (human) what is happening/happened in the study
What is the purpose of descriptive stats
describe + summarize data
- allows researchers to gain insights + understand patterns, trends, etc
HOWEVER doesn't tell us anything about the population -- only what we saw in the sample
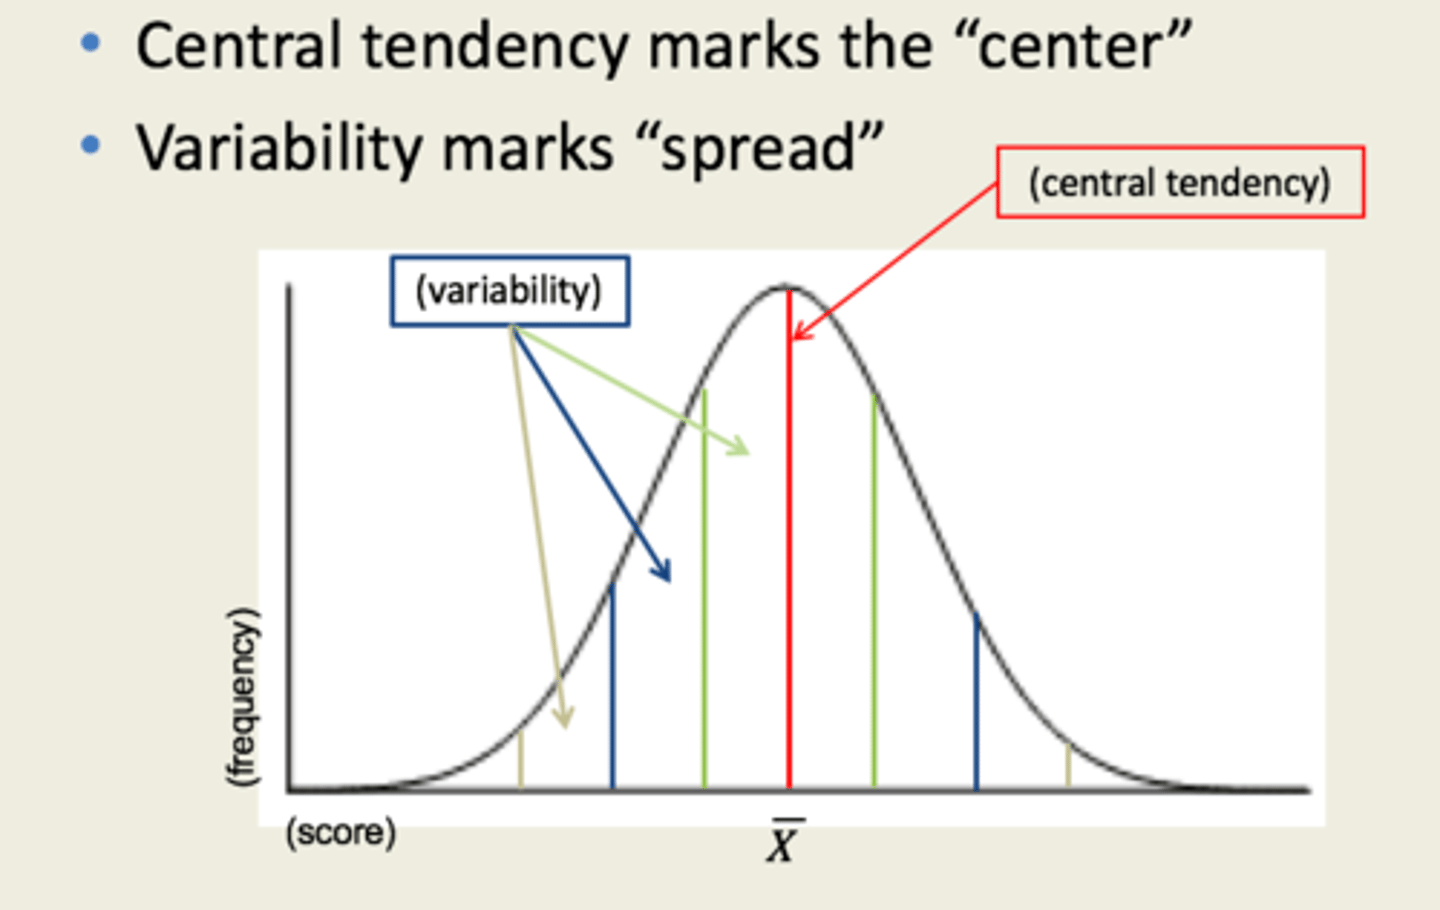
What is the difference between central tendency and variation of the distribution
central tendency: where most of the data is found (mean, median, mode)
- VERTICAL
variation of the distribution: spread and how far the data points lie from each other on the range (range, standard deviation)
- HORIZONTAL
What are the three measure of central tendency -- define each. When do you use each and how do you calculate each
mean: average (most used measure in research) -- used to determine the general value of a data, best for symmetrical data + large data sets - USED IN NORMAL DISTRIBUTION
> add all numbers, then divide by the sum of the number of values in the set
median: # in middle -- used when data is skewed/has outliers, best for asymmetrical data
> order the numbers from least to greatest, the number in the middle is the median - USED IN SKEWED DISTRIBUTION
( if there are an event amount of numbers, add the middle ones and divide by 2)
mode: # that occurs in the MOST often -- used to determine the most frequent value of the data)
> find the numbers that appear the most often
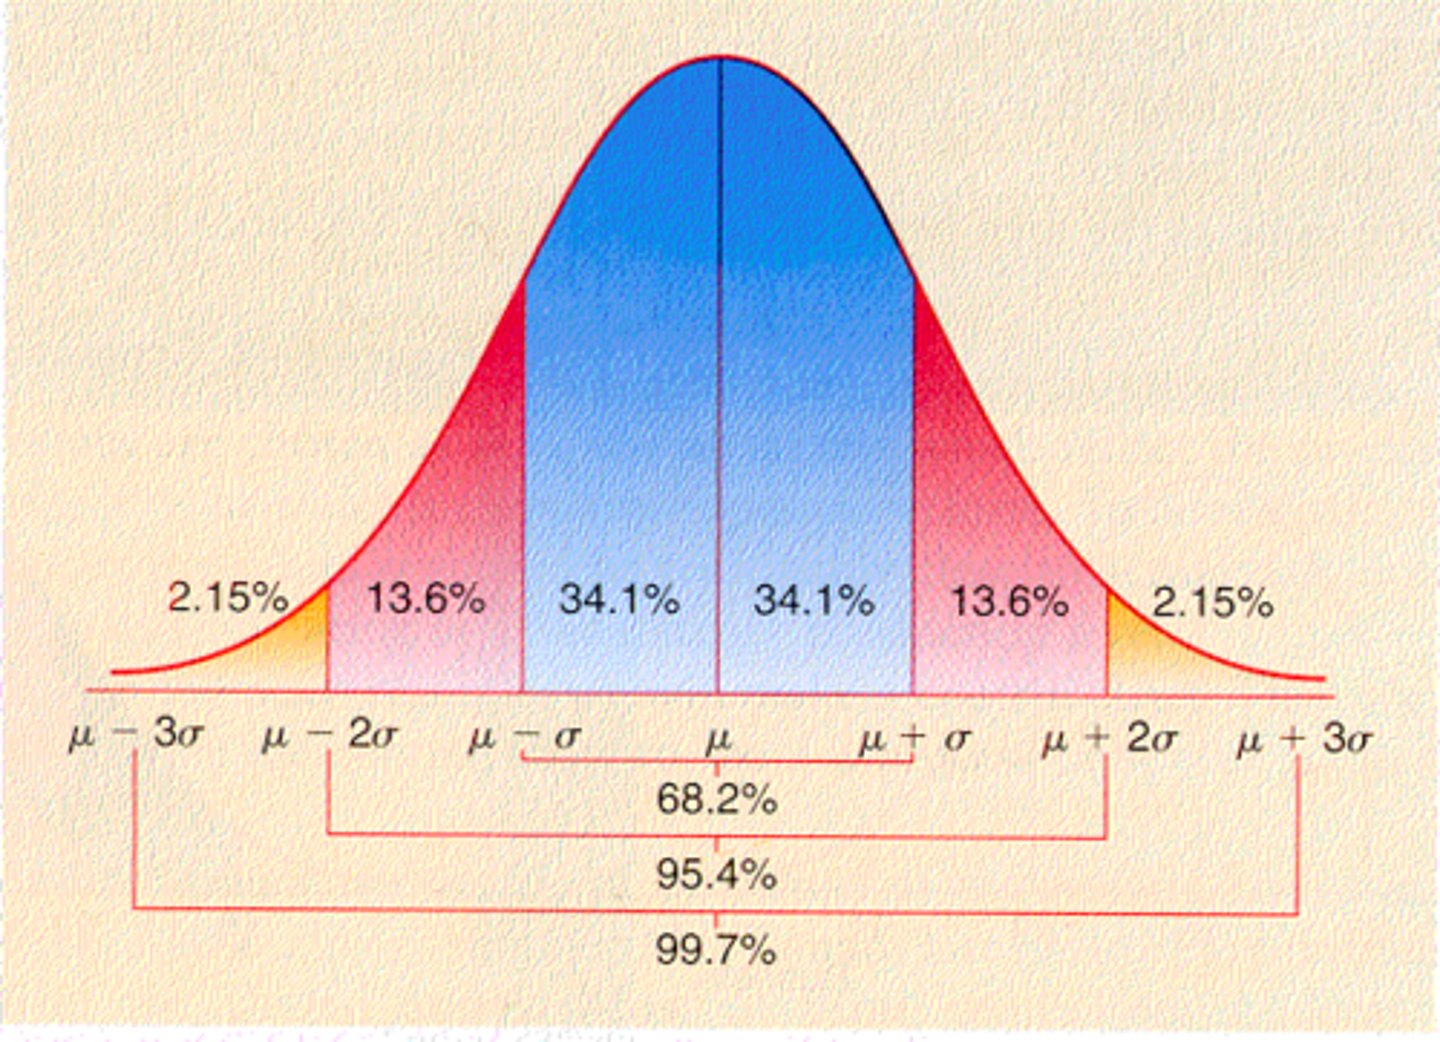
Describe a normal distribution. Label the mean, median, and mode on it
data is symmetrical distributed - no skew
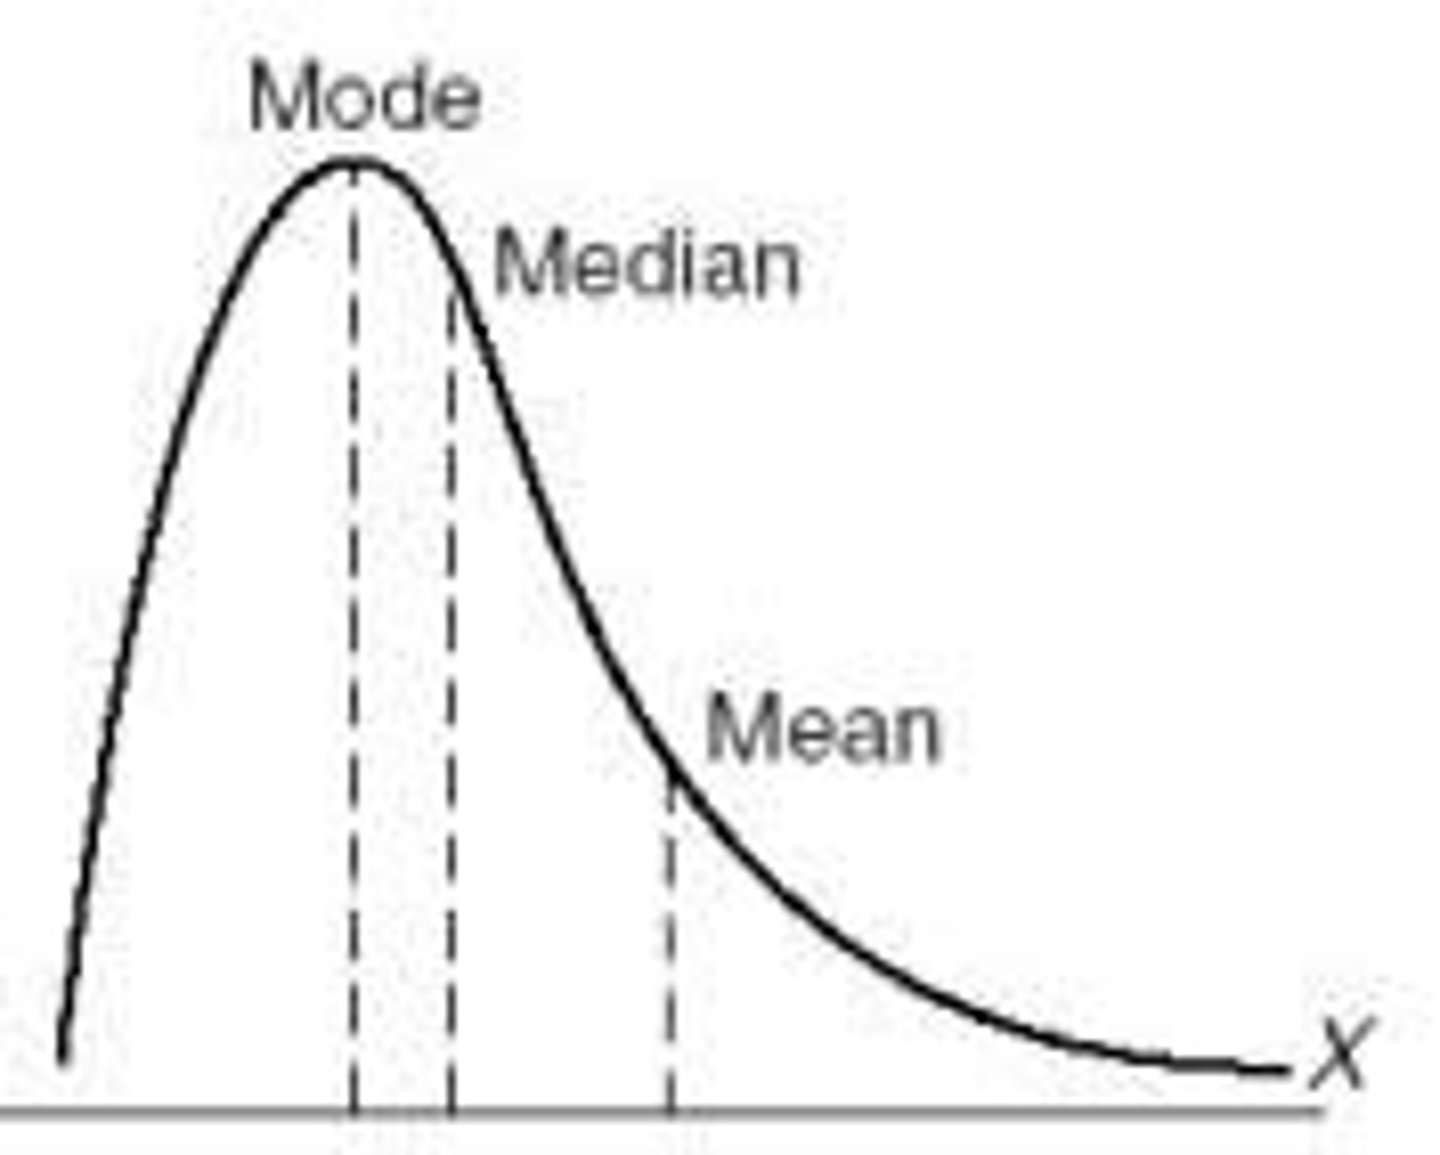
Describe a positive skew. Label the mean, median, mode
the tail on the right is longer (higher mean values)
(mode highest, median, mean lower as in a graph sense)
What is an outlier and what impact does it have on data
data point that varies significantly from the majority of the data
impacts data by distorting the mean, leading to a lower rep. of the sample + distributing skews w/ distribution
What's the range? What the disadvantage to the range -- why do we not use it
difference between lowest and highest scores in the distribution
- doesn't take account of where most of the data is (central tendency) and is impacted by outliers
How do you find the range
subtract biggest value from lowest value to find range
ex: 1,2,3,4,5 -> 5-1 = 4 (Range)
What is standard deviation -- what does it tell you
the average distance scores are spread from the mean/dispersion in a data set
tells us how spread out our data is
ex: bigger SD = more spread (more variability), low SD = less spread from mean
What is the percentile rank and how do we interpret it
the % of the scores in a distribution that are equal or less than a given score
1st percentile (low, better than 1% of group)
99th percentile (high, better than 99% of the group)
ex: student scores in 75th percentile on a test, higher than 75% of test takers
What are inferential statistics
allows you to take data and generalize to the population
What is meant by statistical significance
means your results from the data is NOT due to chance
What does p < .05 mean
your data is statistically significant n data is not due by chance
What is regression towards the mean
means the bigger the sample size, the closer you get to a true avg/greater the effect size
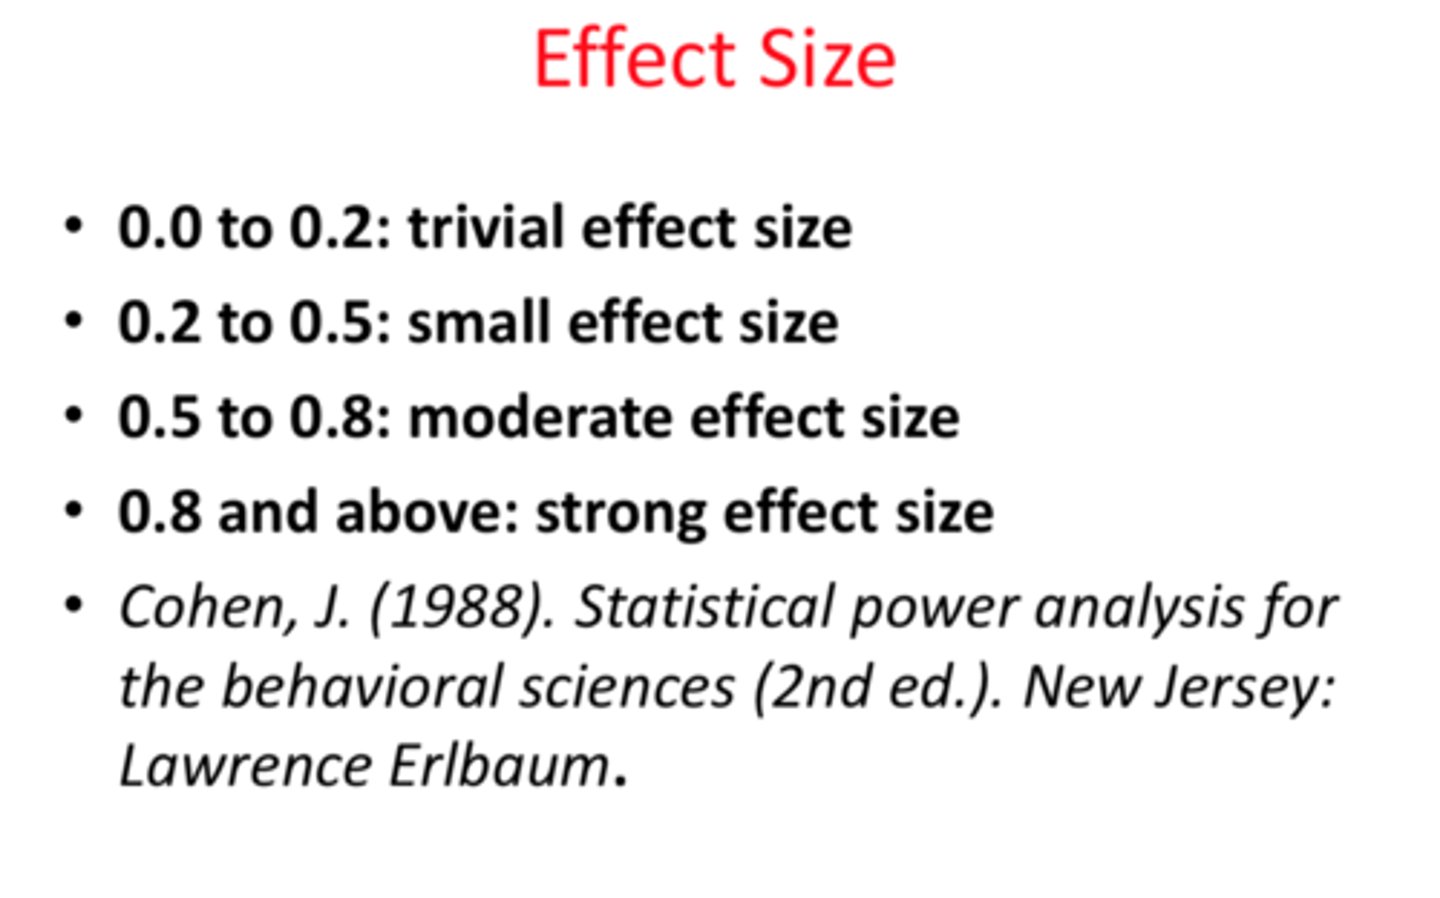
What is effect size
measures the meaningfulness of a magnitude of a relationship between 2 variables -- "practical significance"
closer to 1 = larger the effect size
Define and give an example of: confirmation bias
tendency to search for info that supports our preconceptions and ignore contradictory evidence
ex: asking ppl if they felt the test was hard then finding someone that says it was hard
Define and give an example of: hindsight bias
cognitive bias - people overestimate their ability to predict outcomes after they have occurred
ex: "i knew it was going to rain cause my bones hurt today"
Define and give an example of: overconfidence
tendency to overestimate our knowledge and abilities in a certain area
ex: when a student doesn't study but thinks he's going to get a 100 on the test
Define and give an example of: Hawthorne effect
people modify their behavior when they know they're being watched
ex: a group of students changing what assignment they're working on bc their teacher came to their table
What impact does sample size have on research
larger sample size = more likely there will be statistical significance
What is peer review necessary
other researchers have to check validity and add/question content within the data to ensure it is a well executed study before being published
What is sampling bias? What's an example
when the chosen sample does not represent general population
ex: research done in only male rats (gender bias)
What are cultural norms? How do they impact research
behaviors + thoughts/characteristics of a particular cultural group
impact research bc a particular individual expresses feelings differently which can affect the study
What is the replication crisis - why does it matter
concerns about credibility and reproducibility of social science
- it matters because earlier studies tend to be inaccurate due to false representation, manipulation of statistics, lack of peer review etc
What is meta-analysis and what's it purpose
combining the results of individual studies with statistical techniques to verify findings
purpose: able to combine several studies with small sample sizes in order to make a bigger sample size to make conclusions w more reliability
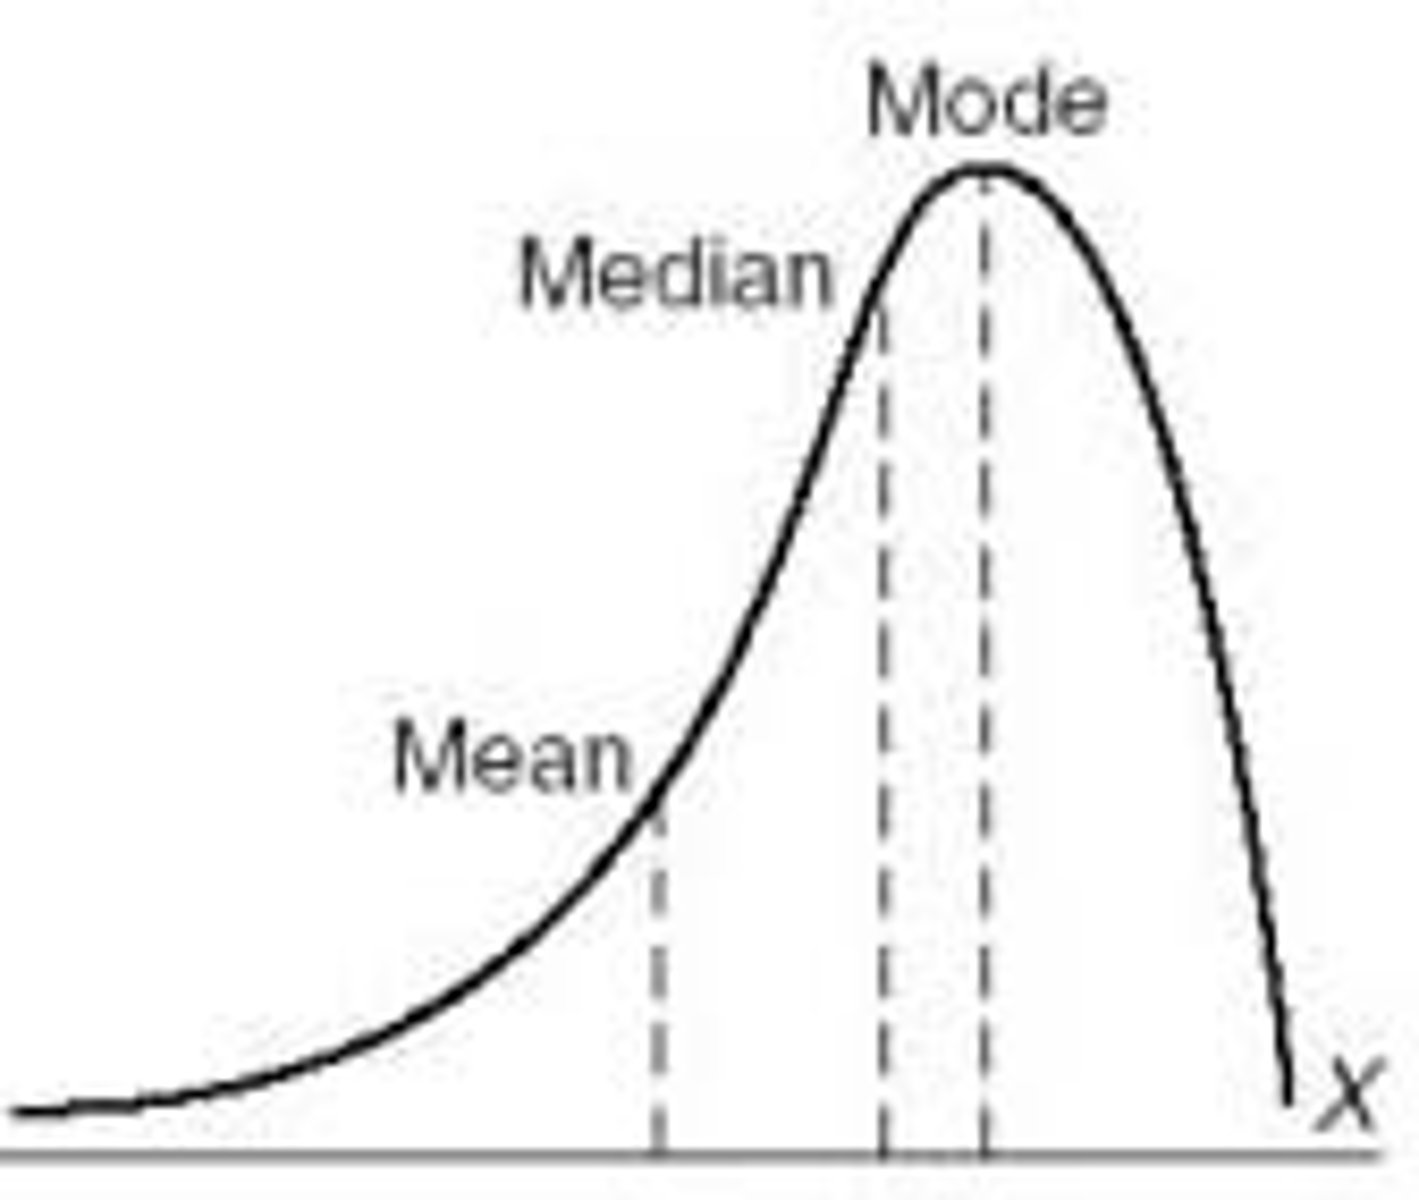
Describe a negative skew. Label the mean, median, mode
data where the tail is longer on the left (lower values)
better cause mode is higher for test scores
Extra info
"Significant" - P value
Median: less affected by extreme scores/outliers
Positively skewed distribution: mean is higher than median
"Sample is too small" - if it takes about generalizability, LOOK AT SAMPLE SIZE
Most commonly reported measure of central tendency: mean
Most appropriate in determining house values (central tendency): median
Consistency of bowling scores in a season: standard deviation
RANDOM ASSIGNMENT ELIMINATES CONFOUNDING VARIABLES