Groundwater Hydrology
1/29
There's no tags or description
Looks like no tags are added yet.
Name | Mastery | Learn | Test | Matching | Spaced |
|---|
No study sessions yet.
30 Terms
Calculating recurrence interval (T)
(T) = (n+1)/m
n = number of records (annual flood)
m = the rank of the particular event, 1 being the largest.
Where do we get annual flood data?
Network of measuring stations
Stream Gage
tracks surface height of river (stage), measured relationship of stage to streamflow.
Flood prediction:
Gather maximum annual streamflow or water level.
Calculate recurrence interval (T)
Use relationship to predict gage height or flood dischage.
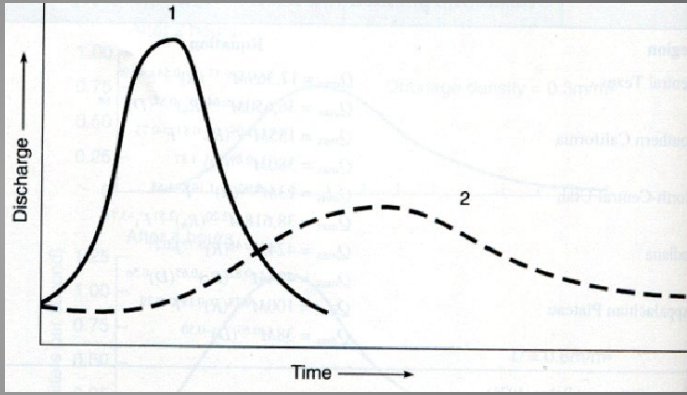
Hydrographs
a graph that plots the rate of water flow (discharge) or water level (stage) over time in a river or stream.
Flood behavior
Permeable surface
Vegetation
Drainage density
Storm path
Rainfall intensity
Prior saturation of soil/rocks

Reduce flooding
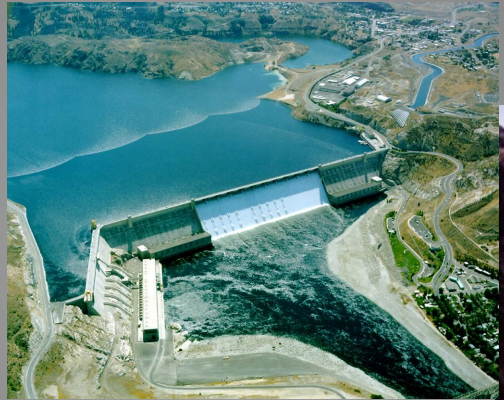
Dam construction
Pros - mostly works
Low GHG emissions energy
water supply and recreation
Cons - failure is catastropic
construction displace people
Geopolitical concerns
River erosion changed significantly
Can trigger (earthquakes)
Artificial levees
Problems with levees
increase flooding somewhere else in stream
They break
Isolate natural floodplains
1. reduce groundwater recharge
2. pollutants deposited stay in river
3. change riverine habitats
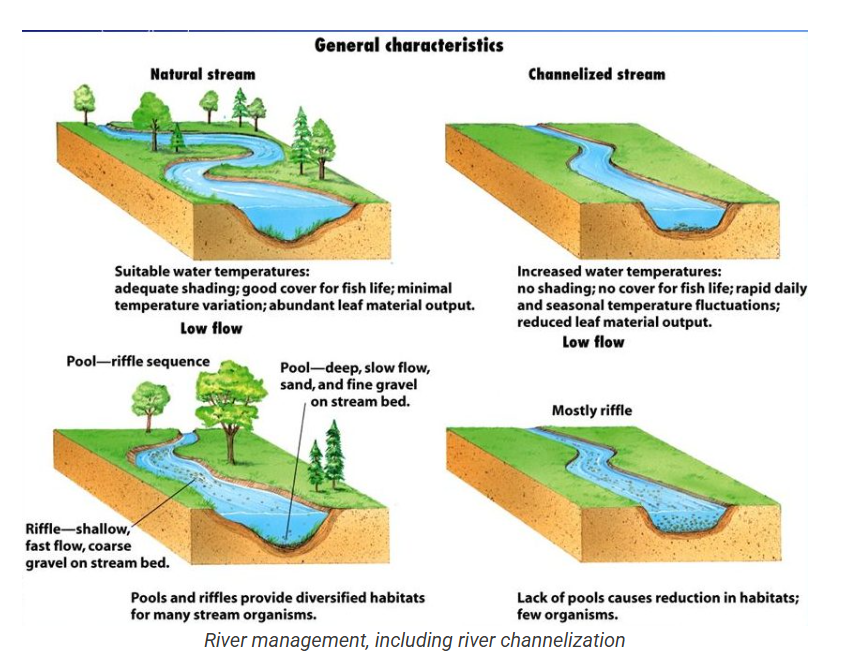
Channelization
Friction slows water flow
Reduce friction, straighten the path.
Increase stormwater infiltration
improves retention by allowing rainwater to seep into the ground.
Where does groundwater come from?
30% Earth’s freshwater
68% glaciers
2% rivers and lakes
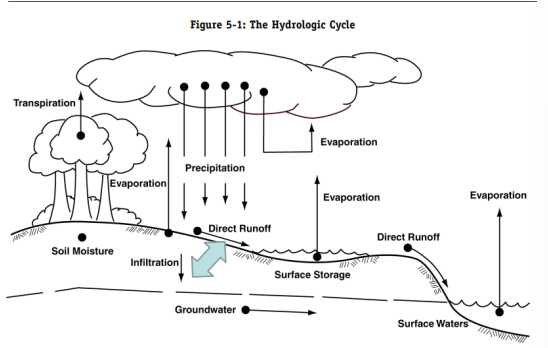
Water Cycle
Properties influencing infiltration
Porosity and Permeability
Porosity
fraction of the rock volume that is open space
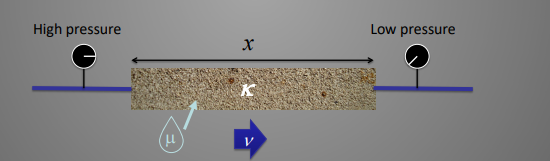
Permeability
ease with which fludis can pass through a porous material.
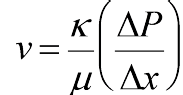
Permeability depends on
v = velocity of fluids
u = viscosity of fluids
change in pressure = change in pressure across given distance x
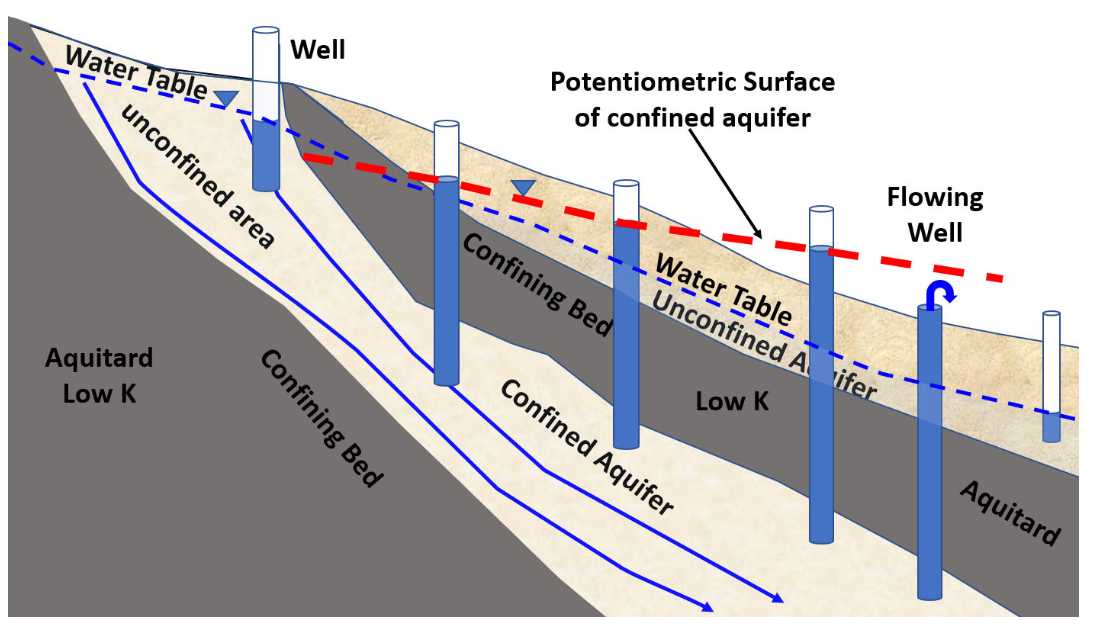
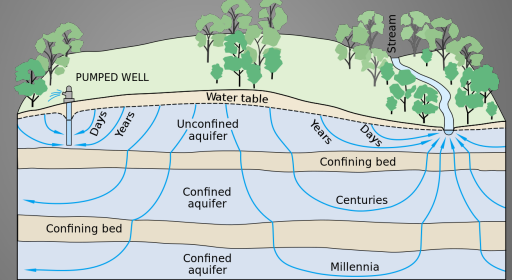
Water table / unconfined aquifer
surface
below which all available pore spaces in soil/rock
Aquifers
rock layers that store and transport water “easily” (slowly)
Recharge area
Wherever water enters the aquifer
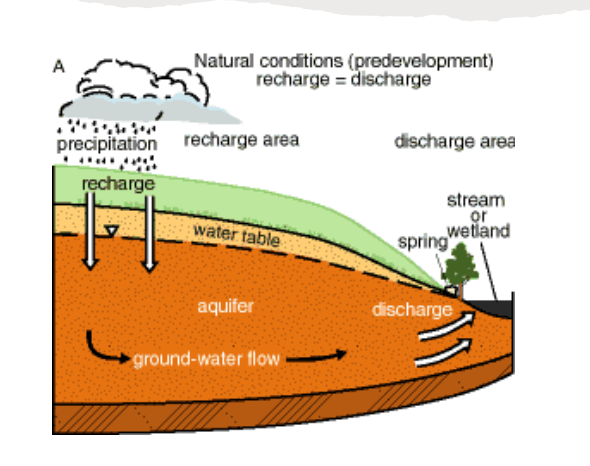
Discharge area
where water leaves the aquifer

Contribute to increased flow of velocity
Direction and rate of flow matter.
Steeper gradient and higher discharge
Cone of Depression
the conical-shaped drop in groundwater levels around a well that is being pumped faster than the aquaifer can naturally replenish.
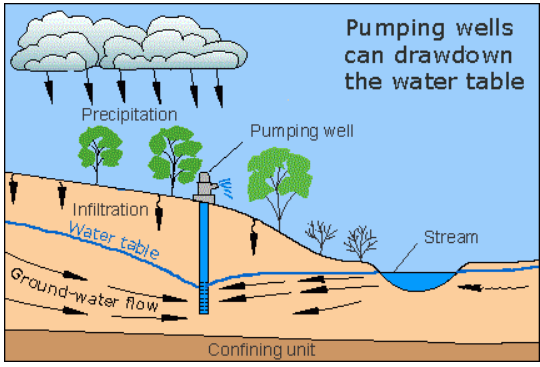
Overpumping
lowers the cone of depression
dries up the stream
If extraction > recharge
Causes overdraft
water table lowers
Where? Arid areas supporting agriculture, industry
Consequences of overdraft
reduce water supply, land subsidence, and increased pumping cost.
Subsidence—typically irreversible in long-term decline in the water table.
Subsidence
The sinking of land elevation due to excessive grundwater extraction.
Watershed
a land area that drains water from all streams and rianfall to a common outlet, sich as river mouth, lake, or reservoir.
Aquitard (Confining Bed)
A layer of rock or sediment with low permeability (like dense clay or shale) that restricts the flow of ground water.
Potentiometric Surface
surface that represents the pressure level to which water would rise in a well drilled into a confined aquifer.