Correlation and regression analysis
1/9
There's no tags or description
Looks like no tags are added yet.
Name | Mastery | Learn | Test | Matching | Spaced |
|---|
No study sessions yet.
10 Terms
Correlations and regression analysis
Correlation analysis what is it, hypothesis, correlation strength

Parametric vs nonparametric correlation
•If numerical variables and big sample -> parametric approach (Pearson correlation)
•If ordinal variables and/or small sample -> nonparametric approach (Spearman, Kendall correlation) Small sample always nonparametric approach
Sometimes Likert scale+big enough sample → parametric approach
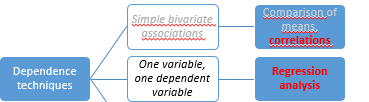
Linear regression model
•A relationship between two variables
•Dependent variable (Y) – output
•Independend variable (X) - input
•Dependent variable is numeric in case of linear regression model
•If only one input variable, then simple regression, if more than two independent variables, then multiple regression
•Sample size is very important (at least 10 observations per variable)
•Y=β0+β1X+u
•Y – dependent variable
•X – independent variable
•u – error term (the only source of randomness in Y)
•β0 – Y intercept
•β1 – the slope
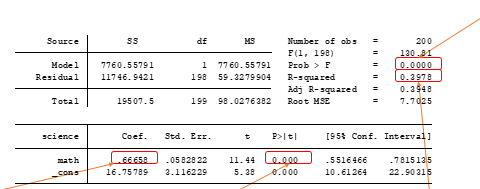
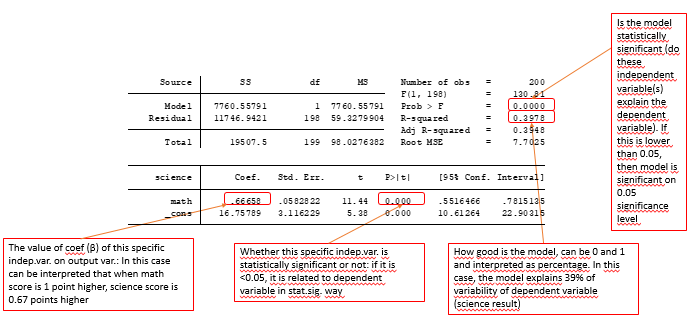
Linear regression model results
Diagnostics of regression model
•Normality of residuals
•Outliers
•Heteroscedasticity
•Multicollinearity
•Model specification
Logistic regression models
•Basically the same as linear regression, but dependent (output) variable is binary, not numeric
•For example, dependent variable can be:
•Unemployed (yes or no)
•Has started a company (yes or no)
•Bad loan (yes or no)
•Drives car daily (yes or no)
•Logit model
•Probit model
•Multinomial logistic model (if more than 2 categories)
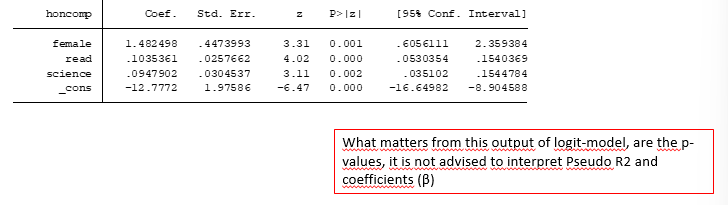
Logit model coefficients
for coefficients - interpret only the direction positive or negative
Instead is better to interpret the odds ratio
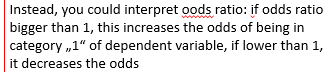
Logit model odds ratio
for odds ratio - easier to interpret for categorical variables
if it is bigger than 1, the effect is positive, if less negative
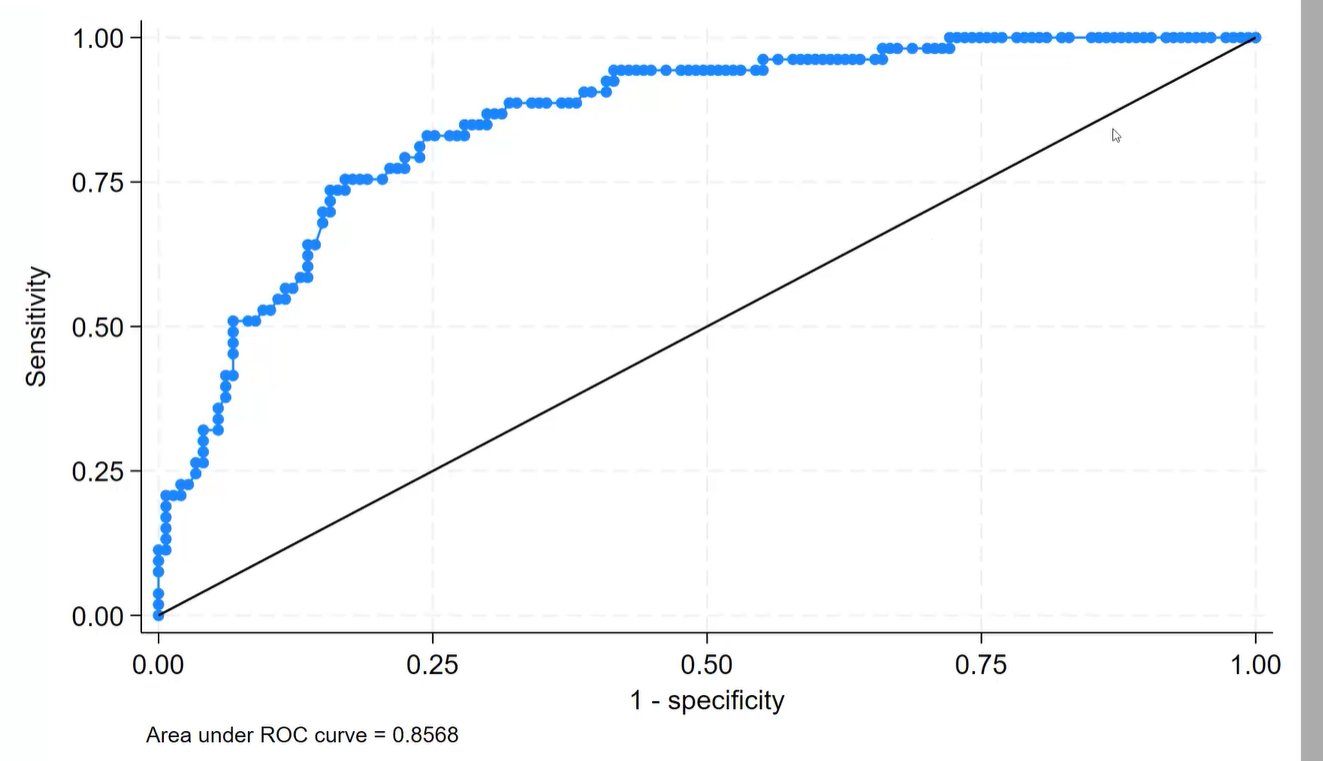
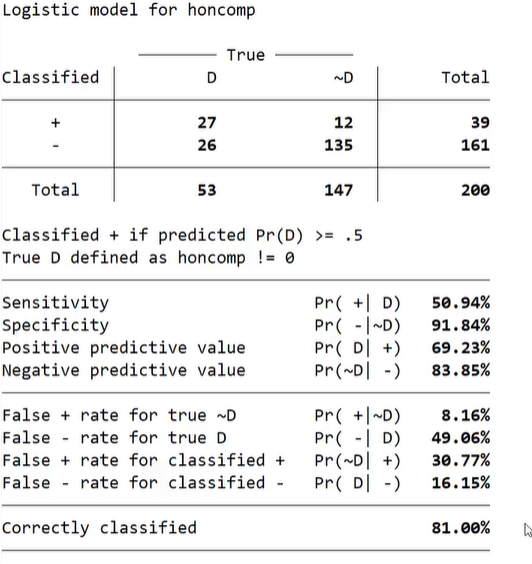
Diagnostics of logistic regression model
•How well our model classifies (predicts) the output variable - focusing on correctly classified - 81% of correctly classidied cases
•ROC curve (illustrates the diagnostic ability) - the better the model predicts the higher would be the area under ROC curve