2.1 Measures of economic performance
1/169
There's no tags or description
Looks like no tags are added yet.
Name | Mastery | Learn | Test | Matching | Spaced |
|---|
No study sessions yet.
170 Terms
MEPO meaning
Macroeconomic performance objectives
Main MEPOs for the UK government
Steady and sustainable economic growth
Low and stable inflation
Low unemployment
balance of payments
Equation for index number
Index number = (value in year X / value in base year) x 100
Percentage change for indices
Percentage change = ((N- O) / O ) x 100 = change in index number / original index number x 100
Equation for Real GDP
Real GDP = nominal GDP / price level x 100
(Real) GDP
Total value of goods and services produced in the economy
Nominal GDP
Money value of goods and services produced in the economy
Real GDP growth
Increase in the volume of goods and services produced, taking inflation into account
Nominal GDP growth
Increase in money value of goods and services produced in the economy
Actual growth on a PPF
Movement from a point within the PPF to a new point nearer the PPF
Potential growth on a PPF
Outward shift of the PPF
Short run economic growth
Increase in an economy’s real GDP
Axis on a PPF in macro
Y axis- capital gods
X axis- consumer goods
What does GDP not take into account
-equality
-happiness
-environment
-population
Other methods of measuring happiness
GNI (includes income, important for developing countries
HDI (included GDP per capita, mean years of schooling, life expectancy)
Ease of living index
Defenition of economic wellbeing
Standard of living and quality of life of individuals or societies, including income, employment, housing, health, and access to services
Defenition of subjective happiness
Self- reported measure of how individuals perceive their overall happiness and satisfaction with life, influenced by personal and economic facotrs
Importance of economic wellbeing
Indicates quality of life
Influence policy decisions
Derived economic growth
Reduces poverty and inequality
Importance of subjective happiness
Reflects overall life satisfaction
Guides public policy
Improves health outcomes
Enhances social cohesion
Easterlin paradox
As income increases, happiness increase, up to a certain point
PPP
Purchasing power parity
Purchasing power parity
A measure of the price of specific goods in different countries
Makes the purchasing power of one country equal to that of a different country with a different currency
Why is it useful
-makes it easier to make inter-country comparisons
-can gain in sighting into standard of living in different countries
Example of a way of measuring PPP
Big Mac index
What is a form of data that economist adjust to PPP
GDP
Governments target for unemployment
2-3% of people to be unemployed
Define unemployment
When someone of a working age who is willing, able, and actively seeking to work is unable to find a job
Who is not included in unemployment rate
-retired
-under 16
-incapactited
Why does the government want to achieve full employments
-increases tax revenue
-increase growth
-decreases mental health issues
-decreases welfare spending
Does full employment mean 0% unemployment
No, due to frictional unemployment
Where is full employment on a PPF graph
A point on the PPC
Why is labour derived demand
The demand for goods and services has a derived demand for labour
Two methods of measuring unemployment
-rate of unemployment
-level of unemployment
Rate of unemployment
Proportion of labour force out of work (labour force survey method)
Level of unemployment
Number of people willing and able to work unable to find a job (claimant count method)
Labour force survey method
40,000 people are randomly surveyed in the UK and asked about their employment status
LFS pros
More accurate than claimant count method
International standard, and easier to make inter-country comparisons
Cons of LFS method
-expensive
-sampling issues
-may be less up to date than claimant count
Claimant count method
Measure number of people claiming unemployment benefits
Pros of claimant count method
-easy to collect data
-up to date
Cons of claimant count method
-only measures this claiming specific unemployment benefits, but many unemployed people are eligible
-groups like under 18s, and those living with a partner aren’t eligible
-some people don’t claim due to stigma
Would LFS or claimant count usually be higher
LFS
Types of unemployment
-structural
-cyclical/ demand deficiency
-seasonal
-frictional
-long term
-real wage / classical
Defenition of structural unemployment
Long lasting unemployment that comes about due to shifts in an economy
Example of structural
UK steel industry- Chinese steel is cheaper so is used instead
Defenition of cyclical/ demand deficient unemployment
Unemployment due to changes in the economic cycle like a recession, as there is lower demand so less derived demand for labour
Example of cyclical unemployment
An automobile worker laid of in a recession
Defenition of seasonal unemployment
When people are unemployed at certain points of the year when demand is low for the product or service they sell
Example of seasonal unemployment
A ski instructor will be in low demand in summer
Defenition of frictional unemployment
Unemployment that occurs when people are moving from one job to another, which is not necessary in small amounts
Example of frictional unemployment
University graduate looking for a job
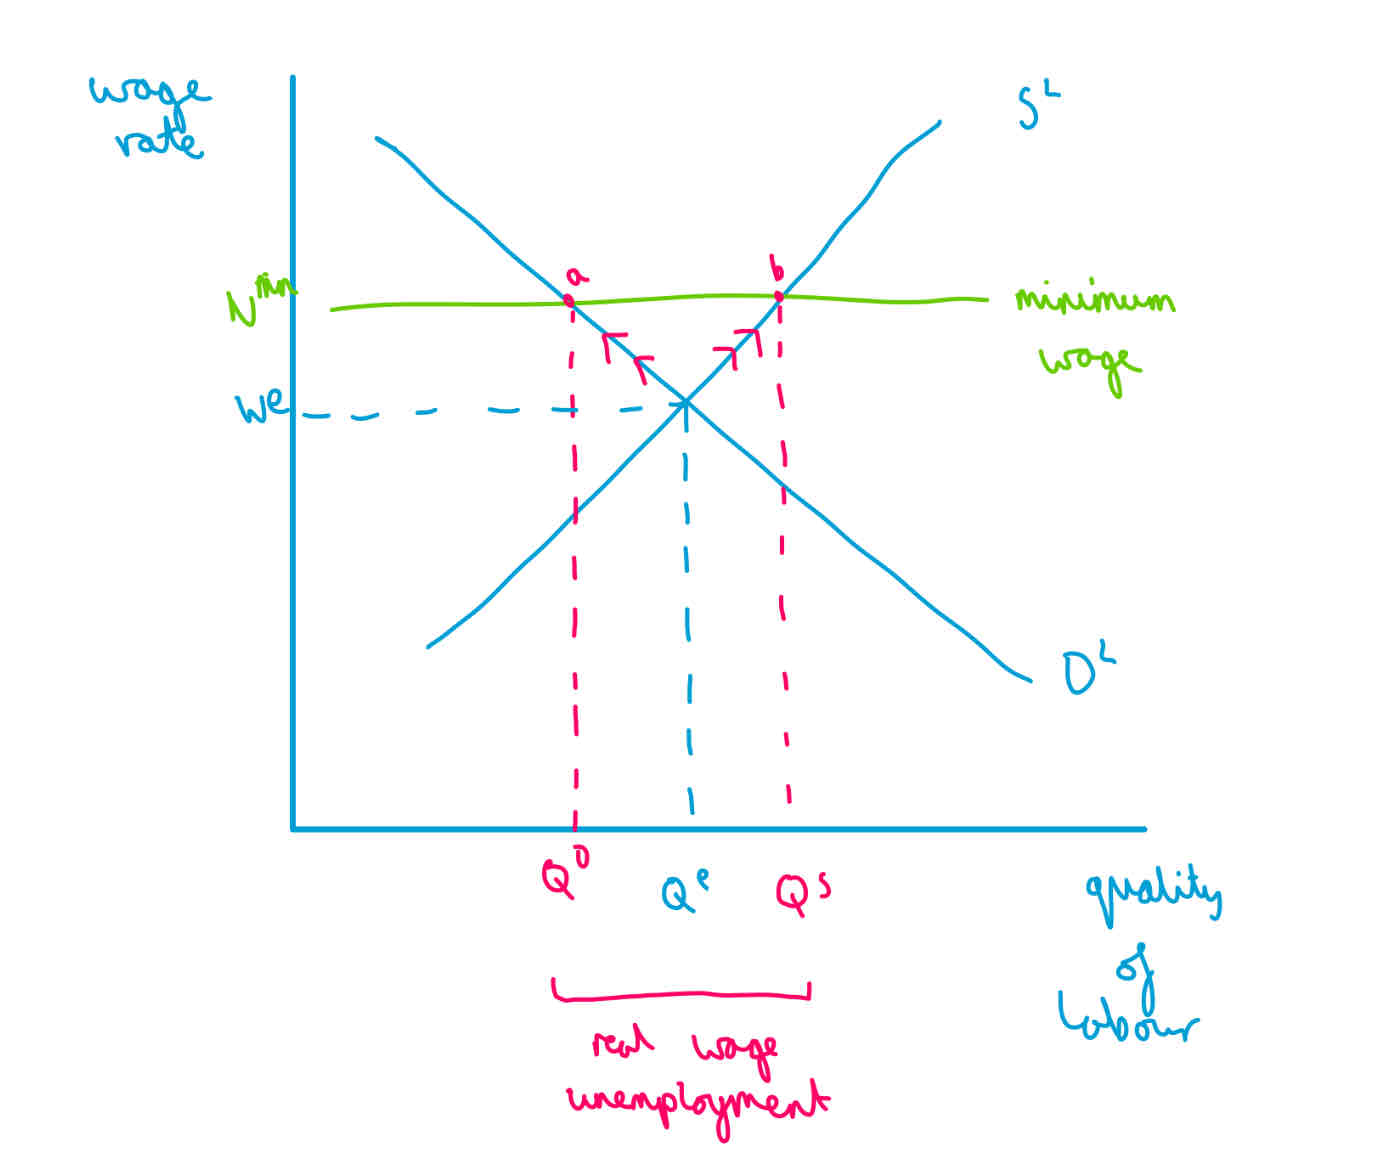
Defenition of real wage/ classical
Effect of a sustained increase in real wages above the free market equilibrium wage rate, resulting in excess supply of labour, therefore unemployment
Example of classical unemployment
Minimum wage sometimes
What factors might affect the length of frictional unemployment
Job websites, like LinkedIn
Factors affecting structural unemployment
Geographical immobility
Immobility of labour
Multiplier effect for structural unemployment
Negative multiplier effect
Diagram of real wage unemployment
Consequences of unemployment for individuals
-loss of income
-fall in living standards
-increased health risks: stress, reduction in quality of diet, social exclusion
-loss of marketable skills : hysteresis
Negative consequences of unemployment for firms
-fall in demand for goods and services
-fall in derived demand
-negative multiplier effects
Positive consequences of unemployment for firms
-larger pools of available workers
-less pressure for higher wages
-less risk of unionisation, strikes
Consequences of unemployment for the government
-increased spending on benefits
-fall in tax revenue
Consequences of unemployment for the economy
-lost output, decrease in GDP
-labour market failure, inefficient way of allocating resources
-increase in inequality
-fall in potential GDP due to long term unemployment
Impact of falling unemployment on GDP
-income for households will increase
-demand for goods and services will increase
-positive multiplier effect
Impact of falling unemployment on BoPs
-increase in demand for imports
-trade balance in goods and services will worsen
-growth in AD is reduced
Impact of falling unemployment on Government finances
-increase in tax revenue
-reduction in welfare payments
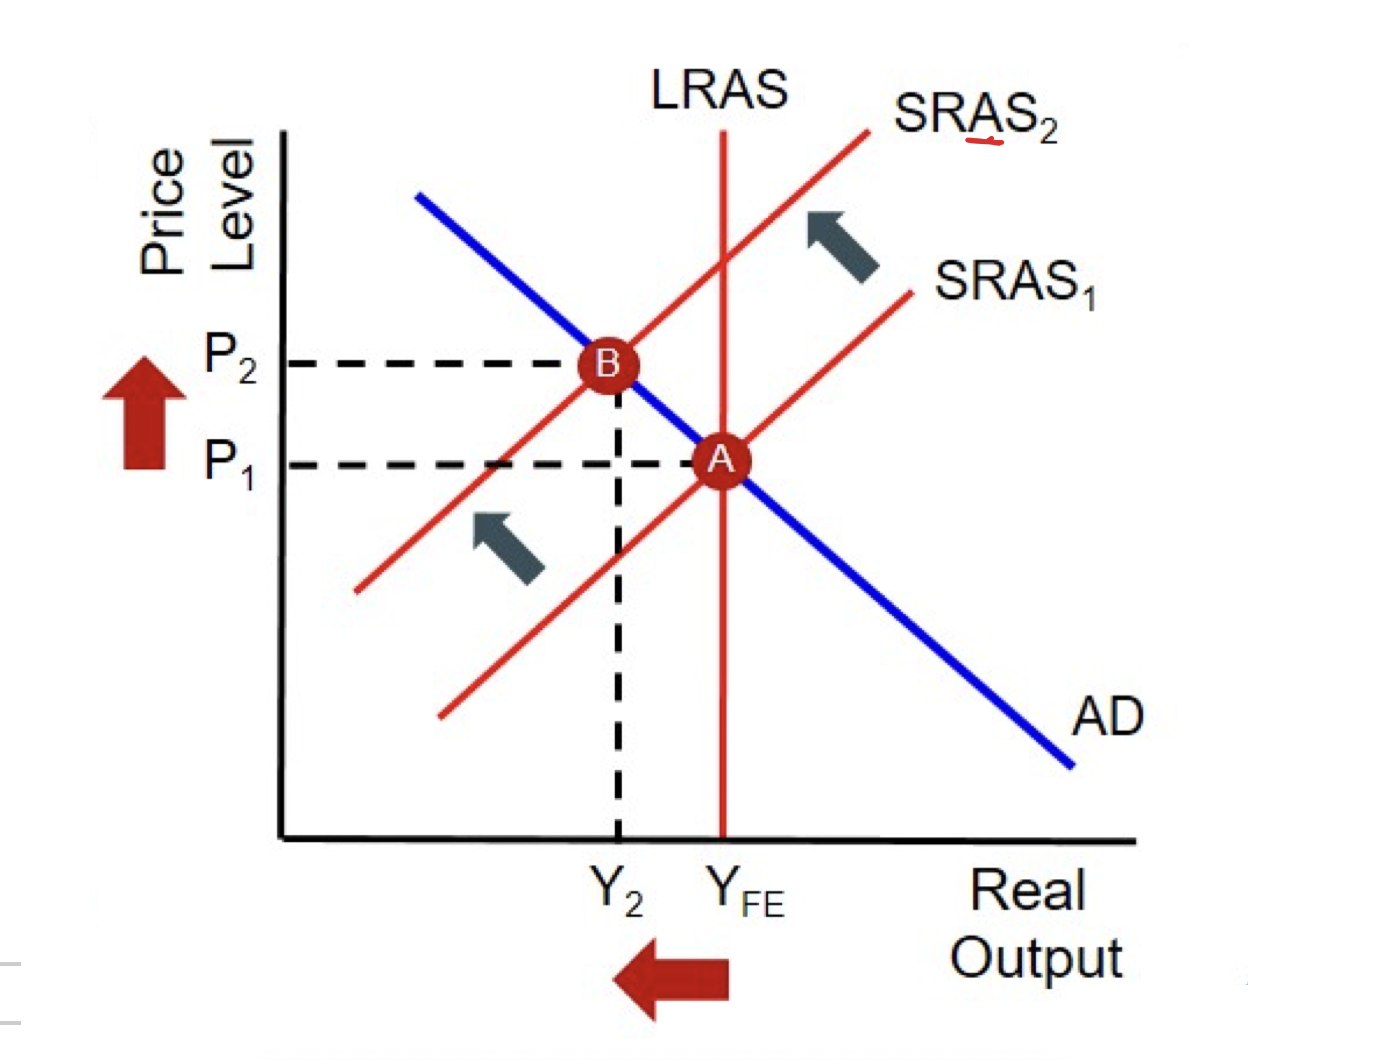
Impact of falling unemployment on Inflation
-demand pull inflation, as demand increases
-cost push inflation as the economy nears its full potential, however this is not a risk coming out of a recession
Unemployment rate formula
unemployed workers/ economically active population x 100
define inflation
a sustained increase in the general price level of an economy over a period of time
define deflation
negative inflation
disinflation
when the rate of inflation decreases but remains positive
how does inflation impact purchasing power
decrease in purchasing power
how does deflation impact purchasing power
increases purchasing power, but can discourage spending and investment
how does disinflation affect prices
prices are still rising but at a slower rate than before
how is inflation measured in the UK
CPI index: basket of goods, weighted, surveying prices, calculating the index
basket of goods
7000 households are surveyed to find the 650 most popular goods, and % of income spent on them, by the ONS
results represent a ‘basket of goods’ showing typical household consumption
weighting
goods are weighted according to amount of income spent on the item
surveying prices
the ONS conducts a price survey to find average prices of the goods
calculating CPI
uses the weights to calculate a weighted average
what does CPI not include
morgages
alternative to CPI
RPI
RPI
retail price index
what is RPI
CPI but with mortgage payments
which is more commonly used
CPI
which gives a higher rate of inflation
RPI
limitations of CPI
substitution bias
quality changes
substitution bias
CPI assumes constant consumption patterns whereas consumers often adjust purchases in response to changing prices
quality changes
CPI might not adequately account for quality improvement in goods or services over time and may overestimate price increases
BoEs target for inflation
2% ± 1%
two types of inflation
cost push
demand pull
cost push inflation
when an increase in the costs of factors of production means that firms must raise their prices in order to protect profit margins
causes of cost push
wage rises
increase in cost of raw materials
rise in indirect taxes
wage rises
-unions and strikes demand higher wages
-increase in minimum wage
increase in cost of raw materials
-supply shocks such as higher energy and food prices, which impacts businesses
rise in indirect taxes
taxes on goods and spending: VAT, sugar tax, cigarette duty, alcohol duty, fuel duty, ULEZ
cost push inflation on a diagram
demand pull inflation
when total demand for goods and services grows rapidly and outstrips total supply, thus causing prices across the economy to be bid up
causes of demand pull
high levels of consumption
more demand for UK exports
rapidly growing money supply relative to output
bottleneck shortages
high levels of consumption
-high wages, high real income
-low interest rates, people borrow and spend more
-high confidence in the economy, spending more and not saving
more demand for UK exports
quality of British goods increases
depreciation of currency, so British goods are more price competitive
rapidly growing money supply relative to output
quantitative easing