RMIN5110 Quiz 3 Study Guide
1/77
There's no tags or description
Looks like no tags are added yet.
Name | Mastery | Learn | Test | Matching | Spaced |
|---|
No study sessions yet.
78 Terms
Jack Bone’s life insurance policy
Policy was issued in 1931
$1,000 coverage (face amount)
Insurer: John Hancock
CEO: Marianne Harrison
Premium: $26.65 per year for 20 years, starting at age 21
What’s $1,000 in today’s $?
Group Life Insurance
Insurer pays upon death of insured
About ½ of life insurance in force
90% of group life insurance is TERM
Term life insurance is similar to auto, home, etc. (no “savings account” added in)
Premium increases with age, over time and covers a group of people under a single contract, typically offered by employers or organizations. It provides a simplified underwriting process and lower premiums compared to individual policies.
Term Life Insurance
Type of life insurance policy that provides coverage for a specific period, or “term” of years. If the insured person passes away during the term, the policy pays out a death benefit to the designated beneficiaries. Key features:
Coverage Duration: Typically ranges from 10, 20, or 30 years, but policies can be customized depending on the insurer.
Cost effective: Often more affordable than permanent life insurance because it does not accumulate cash value and only provides a death benefit
No Cash Value: Unlike whole or universal life insurance, term life does not include a savings or investment component
Renewability and Convertibility: Some term policies allow you to renew after the term expires or convert to a permanent policy, often without a medical exam
Unlike permanent life insurance, a term life insurance does not include a portion of the premiums that are set aside to grow as a cash asset
Term Life Insurance (continued)
Essentially, similar to auto / home insurance
Probability of loss * amount of coverage
.001 for 20-year olds (about 1/1000)
If $1,000,000 of coverage, then Annual Premium equals $1,000
Contract very straightforward
“Voluntary” Benefit: Group Life Insurance Riders
Optional add-ons to group life insurance policies that provide additional coverage or benefits, often chosen by employees for enhanced protection.
Why These Riders Matter:
Flexibility: Employees can customize their life insurance coverage based on their needs.
Affordability: Group rates are generally lower than individual policies due to the pooling of risks across all employees
Convenience: Premiums are deducted directly from paychecks, simplifying the payment process
“Voluntary” Benefit: Group Life Insurance: Supplemental Life insurance
Supplemental Life Insurance
What it is: Provides extra life insurance beyond the employer-paid basic coverage
Coverage multiples: Employees can usually opt for multiples of their annual salary, such as 1x, 2x, or 3x their salary.
Cost: Premiums are often age-banded (increase with age) and calculated based on the amount of additional coverage
Ex: At a rate of ~$5 per $1,000 of coverage annually, for $100,000 of supplemental life insurance, the cost would be approximately $500 per year.
“Voluntary” Benefit: Group Life Insurance: AD&D
Accidental Death and Dismemberment (AD&D)
What it is: Provides a payout if the insured dies or suffers a qualifying injury (e.g., loss of a limb, paralysis) due to an accident
Why add it: Adds a layer of financial protection for unexpected and catastrophic events
Cost and example: Often very affordable
Ex: $250,000 of AD&D coverage for ~$100 per year.
Benefit Payout: If the insured dies in an accident, their beneficiaries receive the AD&D payout in addition to any basic or supplemental life insurance coverage
“Voluntary” Benefit: Group Life Insurance: Dependent Life Insurance
Dependent Life Insurance
What it is: Provides life insurance coverage for dependents, such as a spouse or children.
Purpose: Helps cover funeral costs or provide financial support in case of a dependent’s death
Coverage limits: Typically offers smaller benefit amounts (e.g., $10,000 for a spouse, $5,000 for a child)
Cost: Premiums are usually low and deducted from the employee’s paycheck
Code Section 79 Benefits
Highlights the tax treatment of employer-paid group life insurance premiums under IRS Code Section 79, which applies to benefits provided to employees
Premium Paid by Employer for first $50,000 of coverage
Non-taxable benefit:
The value of life insurance premium paid by the employer for the first $50,000 of group life insurance coverage is NOT considered taxable income for the employee
This represents a tax-free benefit, making it an attractive part of employee compensation
Approximate Value: Employees receive roughly $50 worth of value annually from this non-taxable benefit, depending on their tax bracket and the premium cost.
Premium Paid by Employer for Coverage above $50,000
Taxable benefit:
If the employer provides group life insurance coverage exceeding $50,000, the premium cost for the excess coverage is considered taxable income for the employee
This is called imputed income, and it;s added to the employee’s taxable wages
The taxable amount is determined by using a standardized IRS cost table
Code Section 79 Example
Scenario:
Employee is 45 years old.
Employer provides $100,000 in group term life insurance.
First $50,000 is tax-free.
The excess coverage is $50,000.
Calculate the monthly premium cost for the excess coverage:
From the table, the cost for age 45–49 is $0.15 per $1,000 per month.
$0.15 × 50 (thousands) = $7.50 per month.
Annual cost:
$7.50 × 12 months = $90.
Taxable Income:
The employee would include $90 as taxable income for the year.
Code Section 79 Example: From Class Slides
Code Section 79—Example Employee Details:
Name: Sam
Age: 26
Life Insurance Coverage: $300,000
Sam’s Contribution: $0.02 per month for each $1,000 of coverage
Step 1: Calculate Excess Coverage
Sam's total life insurance coverage is $300,000. Under Section 79, the first $50,000 is excluded from taxation.
Excess Coverage=Total Coverage−Exclusion\text{Excess Coverage} = \text{Total Coverage} - \text{Exclusion}Excess Coverage=Total Coverage−Exclusion Excess Coverage = $300,000 - $50,000 = $250,000
Step 2: Monthly Cost for Excess Coverage Using IRS Table
For a 26-year-old, the IRS Table 1 rate is $0.06 per $1,000 of coverage per month. Multiply this rate by the $250,000 of excess coverage:
Monthly Cost=Excess Coverage×Table 1 Rate\text{Monthly Cost} = \text{Excess Coverage} \times \text{Table 1 Rate}Monthly Cost=Excess Coverage×Table 1 Rate Monthly Cost = 250 ($1,000 units) \times $0.06 = $15.00
Step 3: Annual Cost for Excess Coverage
Convert the monthly cost into an annual amount by multiplying by 12 months:
Annual Cost=Monthly Cost×12\text{Annual Cost} = \text{Monthly Cost} \times 12Annual Cost=Monthly Cost×12 Annual Cost = $15.00 \times 12 = $180
Step 4: Calculate Sam’s Annual Contribution
Sam pays $0.02 per month for each $1,000 of coverage. To find the annual contribution:
Multiply the total coverage ($300,000) by $0.02 per $1,000: 300 ($1,000 units) \times $0.02 = $6.00 \text{ per month}
Multiply the monthly contribution by 12 months: $6.00 \times 12 = $72.00
Sam contributes $72 annually.
Step 5: Taxable Income Calculation
To find Sam’s taxable income for the excess coverage:
Taxable Income=Annual Table 1 Cost−Sam’s Annual Contribution\text{Taxable Income} = \text{Annual Table 1 Cost} - \text{Sam's Annual Contribution}Taxable Income=Annual Table 1 Cost−Sam’s Annual Contribution Taxable Income = $180 - $72 = $108
Summary
Life Insurance Coverage: $300,000
Section 79 Exclusion: $50,000
Excess Coverage: $250,000
Annual Cost (Table 1): $180
Sam's Annual Contribution: $72
Taxable Income: $108
This $108 will be reported on Sam’s W-2 as taxable income for the year.
Code Section 79—Example
Employee Details:
Age: 46
Life Insurance Coverage: $250,000
Employee Contribution: $0.05/month per $1,000
Steps:
Excess Coverage: $250,000 (total coverage) - $50,000 (exclusion) = $200,000
Monthly Table 1 Cost:
Rate for age 46: $0.15 per $1,000
$200,000 × $0.15 = $30/month
Annual Table 1 Cost:
$30 × 12 = $360
Employee Contribution:
$250,000 × $0.05/month = $12.50/month
$12.50 × 12 = $150 annually
Taxable Income:
$360 (annual cost) - $150 (contribution) = $210
Summary:
Excess Coverage: $200,000
Annual Table 1 Cost: $360
Employee Contribution: $150
Taxable Income: $210
This $210 is reported as taxable income on the employee's W-2.
Code Section 79: Non-Discrimination Test
Ensures that group term life insurance benefits provided by an employer do NOT favor key employees over other employees
What is allowed?
Employers can provide benefits based on objective criteria, such as a uniform percentage of salary
Ex: Offering life insurance coverage equal to 1x or 2x to an employee’s salary for all employees is acceptable
Offering a flat coverage amount (e.g. $50,000 for everyone) is also compliant
What is not allowed?
Discriminatory coverage amounts or eligibility rules favoring key employees:
Ex: Giving executives 5x their salary while other employees get 1x their salary
Restricting the plan only to higher-level employees
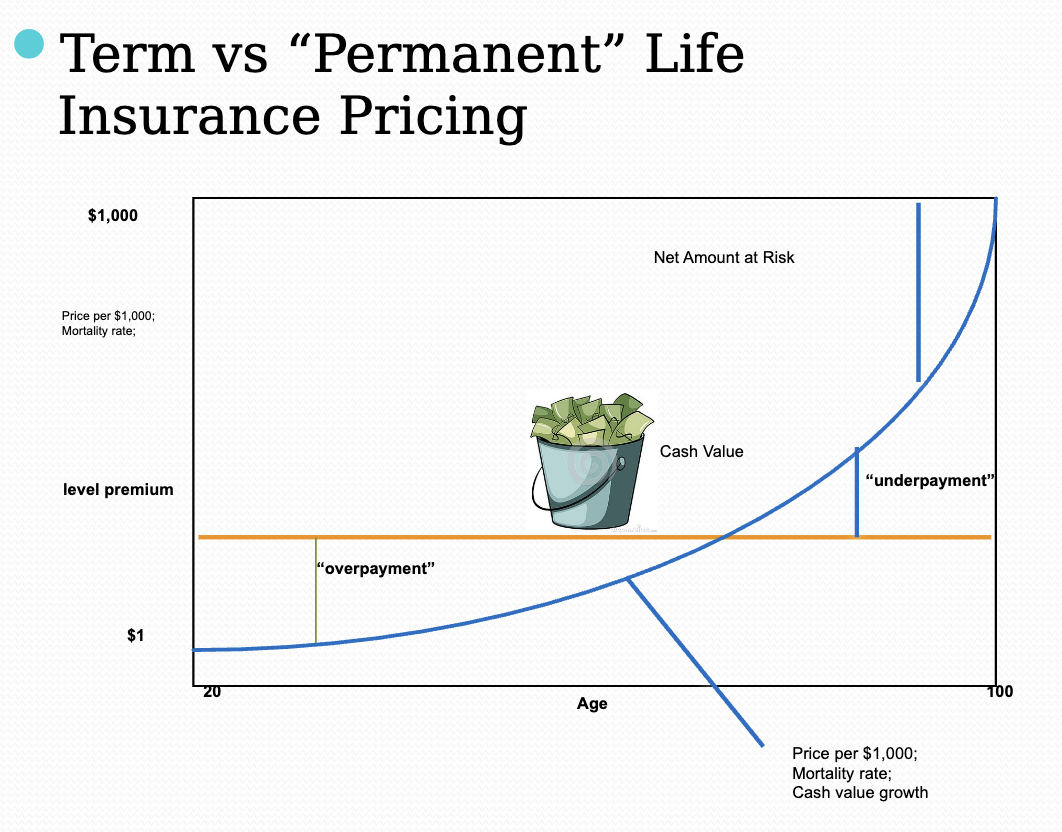
Term vs “Permanent” Life Insurance Pricing
In the early years, the insured is “overpaying” (relative to the actual mortality cost). This overpayment funds the policy’s cash value.
In later years, the insured is “underpaying” because the premiums remain level while the mortality cost has increased. The cash value offsets this rising cost, ensuring the policy remains solvent.
Term insurance follows the blue curve, with premiums increasing as mortality risk grows, making it cheaper for younger individuals but expensive at older ages.
Permanent insurance uses level premiums (orange line) to stabilize costs over the policyholder’s lifetime
Takeaway:
Term Insurance: Affordable for short-term needs but lacks cash value or lifelong coverage
Permanent Insurance: Offers lifelong protection and cash accumulation, but premiums are higher upfront to fund the cash value
Universal Life Insurance
A type of permanent life insurance that offers flexibility and transparency in premiums, death benefits, and cash value growth.
Flexibility in Premiums: Policyholders can adjust their premium payments within certain limits. As long as the cash value of the policy can cover the mortality cost (MC) and any fees, the policy remains active. You can pay minimum premium just enough to cover costs and keep policy in force or pay more to contribute extra to grow the cash value faster.
Flexibility in Death Benefits: Policyholders can increase or decrease death benefit over time, subject to underwriting approval for increases. Flexibility is useful for adapting coverage to changing needs, such as paying off a mortgage or funding college expenses.
Surrender Charge: If the policyholder cancels or withdraws money from the policy during the early years, a surrender charge may apply. Surrender charges decrease over time and typically phase out after 10-15 years
Key Advantages:
Flexibility: Adjust premiums and death benefits as life circumstances change.
Savings Component: Cash value grows tax-deferred and can be accessed for emergencies or retirement needs.
Transparency: Clear view of how money is allocated and how the policy performs.
Universal Life Insurance (Death Benefit Options)
Option A: Level Death Benefit
The death benefit remains constant
As the cash value grows, the insurer’s Net Amount at Risk (NAR) decreases because the cash value offsets part of the death benefit
Advantage: Lower premiums since the insurer’s risk reduces over time
Option B: Increasing Death Benefit
The death benefit equals the policy’s face amount plus the cash value
The total payout to beneficiaries increases as the cash value grows
Advantage: Provides a larger payout, but premiums are higher since insurer’s NAR remains constant.
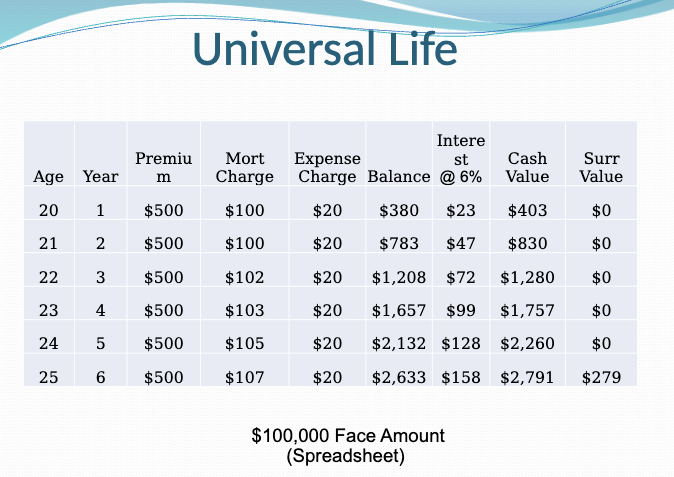
Universal Life Table
Year 1: To calculate a cash value of $403
500 - 100 - 20 = 380
380 × 0.06 = $23
380 + 23 = $403
Takeaway
This table demonstrates the mechanics of Universal Life Insurance:
Premiums fund the death benefit, cover charges, and grow the cash value.
Cash value grows tax-deferred through credited interest, which compounds annually.
Surrender value becomes positive as surrender charges diminish over time, offering liquidity if the policyholder chooses to cancel.
The illustration emphasizes how Universal Life Insurance can serve as both a protection and savings vehicle, with increasing value over time.

Variable Universal Life Insurance (VUL)
Flexibility in Premiums
Flexibility in Death Benefits
Investment Choices
Policyholder directs the investment of the cash value by selecting from a menu of funds offered by the insurer, such as:
Equity funds (stocks)
Index funds
Bond funds
Performance of the chosen investments determines the growth or loss of the cash value (can lead to an opportunity for higher returns)
Guaranteed Death Benefit
While the cash value depends on investment performance, the death benefit is guaranteed, provided that sufficient premiums or cash value are available to cover policy costs.
No Cash Value Guarantee
Unlike traditional UL policies, VUL does not guarantee a minimum cash value
If investments perform poorly, the cash value may decrease, or even be depleted, requiring policyholder to pay additional premiums to keep the policy in force
Advantages and Disadvantages of Variable Universal Life (VUL)
Advantages of Variable Universal Life
Growth Potential: The investment component offers the potential for higher returns compared to traditional permanent life insurance policies.
Flexibility: Premium and death benefit flexibility allows policyholders to adjust the policy as their financial situation evolves.
Tax Benefits: Cash value grows tax-deferred, and the death benefit is generally tax-free to beneficiaries.
Disadvantages of Variable Universal Life
Investment Risk: Cash value is subject to market fluctuations, and poor investment performance can reduce or eliminate the cash value.
No Cash Value Guarantee: Unlike UL policies, there is no minimum guaranteed cash value.
Complexity: Managing the investment component requires knowledge and attention to financial markets.
Cost: Fees (mortality costs, administrative charges, fund management fees) can reduce returns and deplete cash value.
Takeaway
Variable Universal Life insurance offers a unique combination of flexibility, investment opportunity, and permanent life insurance coverage. However, it requires active management and a tolerance for investment risk. It is best suited for individuals who:
Want lifelong coverage.
Have higher risk tolerance and investment knowledge.
Seek the potential for higher cash value growth over time.
Rule of Thumb: Cost of Lifetime Income
$1,000,000 at age 65 buys you $60,000 of annual lifetime income
So, $1,000,000 / $60,000 means that each $1 of lifetime income (at age 65) costs $16.67
Example at age 65:
If Mary’s DB plan owes her $100,000 of lifetime income, then the Single Premium Cost of this promise equals:
= $100,000 * $16.67 = $1,667,000
Example at age 58:
If Mary is 58 (instead of 65), and if the cost of lifetime income goes up (down) by 1% for each year that a person is younger (older) than 65, then:
= $1,667,000(1 + {65-58} *.01})
UL Option A & B Calculation for Mortality Charges
Option B: (what we have been doing)
Mortality charge:
(Face Amount / $1,000) * Mortality Rate
ex: ($100,000 / $1,000) * $1.00 = $100
Option A:
Mortality charge:
(Face Amount - CVlastyear / $1,000) * Mortality Rate
ex: (($100,000 - $1,000) / $1,000) * $1.00 = $99
Reading: Raising the Price on Your Universal Life Policy
In the article "Surprise: Your Life-Insurance Rates Are Going Up," published by The Wall Street Journal on December 4, 2015, Leslie Scism discusses how major insurers have begun increasing costs on existing universal life insurance policies. This shift marks a departure from the industry's traditional practice of maintaining stable rates for in-force policies.
Key Points:
Rising Costs for Policyholders: Insurers are notifying tens of thousands of universal life policyholders about cost increases. These adjustments are attributed to the prolonged period of low interest rates, which have adversely affected insurers' investment returns.
Impact on Universal Life Policies: Universal life insurance combines a death benefit with a savings component, where the cash value grows based on interest rates. The sustained low rates have led to slower cash value accumulation, prompting insurers to raise premiums or reduce benefits to maintain policy viability.
Industry Response: Companies such as AXA Equitable Life Insurance Co. and Voya Financial Inc. have implemented these cost increases. Policyholders, especially those who purchased policies decades ago with expectations of stable premiums, are facing unexpected financial burdens.
Legal and Consumer Reactions: The article notes that some policyholders are considering legal action, arguing that the increases are unfair or violate policy terms. Consumer advocates emphasize the importance of understanding policy details and the potential for such adjustments.
Reading: Why employer-provided life insurance can backfire
The CNBC article "Why Employer-Provided Life Insurance Can Backfire" highlights potential drawbacks of relying solely on employer-sponsored life insurance. Key points include:
Insufficient Coverage: Employer plans often provide coverage equal to one or two times an employee's salary, which may not meet the financial needs of dependents in the event of the employee's death.
Lack of Portability: Coverage typically ends when employment does, leaving individuals without life insurance during job transitions or after retirement.
Tax Implications: Under IRS Code Section 79, employer-paid premiums for coverage exceeding $50,000 are considered taxable income for the employee, potentially increasing their tax liability.
The article advises individuals to assess their life insurance needs independently and consider purchasing supplemental individual policies to ensure adequate and continuous coverage.
Reading: Prudential’s New Tactics in a New World
The Wall Street Journal article "Americans Shun Life Insurance, Forcing New Tactics at Prudential" discusses how declining U.S. life insurance sales have led Prudential Financial Inc. to shift its focus toward retirement-related products and services. Many Americans now fear outliving their savings more than the premature death of a breadwinner, resulting in a significant drop in individual life insurance policy sales since the mid-1980s. In response, Prudential has transformed into an investing giant, emphasizing retirement solutions to adapt to changing consumer priorities.
Reading: Wringing Cash from Life Insurance
The New York Times article "When Life Insurance Is More Valuable as Cash" discusses the growing trend of seniors selling their life insurance policies through life settlements. This process allows policyholders to receive immediate cash by selling their policies to investors, who then assume premium payments and collect the death benefit upon the insured's passing. The article highlights that policyholders may receive three to five times more than the surrender value for their policies. This option is particularly appealing to those who no longer need the coverage or find premium payments burdensome. However, the article advises caution, noting that proceeds from such sales can affect eligibility for government benefits and may have tax implications.
Reading: WSJ–Retirement Shock: Need to Find a Job After 40 Years at GE
The Wall Street Journal article "Retirement Shock: Need to Find a Job After 40 Years at General Electric" discusses the challenges faced by long-term General Electric (GE) employees who, after decades of service, are compelled to seek new employment due to company restructuring and pension changes. Many of these workers, having anticipated stable retirements, now confront a competitive job market, often lacking the necessary skills or certifications for new roles. The article highlights the broader implications of corporate shifts on employee retirement plans and the difficulties older workers encounter when re-entering the workforce.
Reading: WSJ–Hyperbolic Discounting: Why We Sometimes Make Terrible Life Decisions
The article "Hyperbolic Discounting: Why You Make Terrible Life Choices" explores the concept of hyperbolic discounting—a cognitive bias where individuals prefer smaller, immediate rewards over larger, delayed ones. This bias often leads to procrastination and impulsive decisions, such as choosing immediate pleasures like watching TV over long-term benefits like learning a new skill. The article suggests strategies to counteract this tendency:
1. Empathize with Your Future Self: Consider how current decisions will impact your future well-being.
2. Precommitment: Make decisions in advance to limit future temptations, such as setting up automatic savings plans.
3. Break Down Goals: Divide larger objectives into smaller, manageable tasks to make long-term goals more attainable.
By implementing these approaches, individuals can make choices that better align with their long-term interests.
Reading: Companies Helping with Student Loan Payoff
The Wall Street Journal article "More Companies Help Employees Pay Off Student Loans" discusses the emerging trend of employers offering student loan repayment assistance as a benefit to attract and retain young talent. Companies like PricewaterhouseCoopers (PwC), Natixis Global Asset Management, and ChowNow have implemented programs to aid employees in managing their student debt. For instance, PwC plans to offer this benefit to all employees starting July 1. While this perk appeals to recent graduates, it's important to note that the assistance provided is considered taxable income for employees.
Reading: Companies Helping with Student Loan Payoff
In the article "Why America Is Going Broke," published by The Wall Street Journal on February 21, 2018, John F. Cogan examines the escalating federal deficit and debt in the United States, attributing the primary cause to the rapid growth of entitlement programs such as Social Security, Medicare, and Medicaid. Cogan argues that without significant reforms to these programs, the nation faces a looming fiscal crisis. He emphasizes that the current trajectory of entitlement spending is unsustainable and calls for policymakers to implement measures that address the structural issues driving the deficit.
Reading: A Cure for Office Burnout
The Wall Street Journal article "Cure for Office Burnout: Mini Sabbaticals, Usually With Full Pay" discusses how some companies are introducing short-term sabbatical programs to combat employee burnout and enhance retention. Unlike traditional sabbaticals that require long tenures, these programs offer paid leaves after shorter periods of employment. For example, a company might provide a paid sabbatical after just six months on the job. Employees report returning from these breaks feeling rejuvenated and more productive, while employers note improved morale and loyalty. This approach reflects a growing recognition of the importance of work-life balance in maintaining a healthy and effective workforce.
Reading: Edit by David G. McCarthy and James M. Carson
This letter to the editor of The Wall Street Journal critiques Mark W. Hendrickson's opinion article, “Please Stop My 8% Social Security Raise,” published on September 28, 2016. Professors David G. McCarthy and James M. Carson of the University of Georgia dispute Hendrickson's claim that delaying Social Security benefits from age 66 to 70 equates to an 8% annual return.
### Key Points:
1. Flawed Return Calculation:
- The authors argue that Hendrickson ignores critical factors such as:
- Mortality rates: 7.5% of 66-year-old males will die before age 70, receiving no delayed benefits.
- Reduced life expectancy: A 70-year-old male will collect benefits for fewer years than a 66-year-old.
- Additional FICA taxes for those working beyond age 66, which provide little to no additional benefit for workers with more than 35 years of indexed earnings.
2. Break-Even Analysis:
- Accounting for mortality, taxes, and interest, delaying benefits typically results in breaking even or possibly losing, rather than earning a significant return.
3. System Design:
- The authors suggest that Social Security actuaries designed the benefit adjustments for delayed retirement with these considerations in mind, making them actuarially fair.
4. Root Cause of Social Security Imbalance:
- The authors reject the claim that delayed benefits contribute to financial strain in Social Security.
- They attribute system challenges to the pay-as-you-go structure, where earlier generations underfunded the system, leaving necessary adjustments to later generations.
5. Criticism of WSJ:
- The authors accuse The Wall Street Journal of embracing “post-truth” politics by publishing Hendrickson’s inaccurate claims.
The letter emphasizes the need for factual accuracy in discussions about Social Security and defends the fairness of the system's benefit adjustments for delayed retirement.
Reading: Workers Compensation
In the article "States Aim to Expand Workers’ Compensation for Covid-19," published by The Wall Street Journal on April 27, 2020, Russell Gold and Leslie Scism discuss how various states are modifying workers' compensation rules to ensure that frontline workers—such as nurses, paramedics, and firefighters—who contract COVID-19 have unimpeded access to benefits. These changes often include presumptive eligibility, meaning these workers don't have to prove they were infected on the job to receive compensation. While these measures aim to support essential employees, they could lead to increased costs for insurers, who may pass these expenses on to employers.
Reading: How Workers Comp is Priced
The article "Workers' Compensation Rates Explained" provides an in-depth look at how workers' compensation insurance premiums are calculated and the factors influencing these rates. Key points include:
- Premium Calculation: Premiums are determined by multiplying the employer's payroll (per $100) by the rate assigned to their specific industry classification code. For example, a rate of 2.5 means $2.50 is charged for every $100 of payroll.
- Influencing Factors:
- Experience Modification Factor (EMR): Reflects the employer's claim history; a lower EMR can reduce premiums, while a higher one can increase them.
- Scheduled Credits and Debits: Insurers may adjust premiums based on factors like safety programs or operational risks.
- State-Specific Credits: Some states offer credits to encourage certain business practices, which can lower premiums.
- Payroll's Role: The total payroll is a primary component in premium calculation, with higher payrolls leading to higher premiums, assuming the rate remains constant.
Understanding these elements can help employers manage and potentially reduce their workers' compensation insurance costs.
Reading: Open Enrollment and HSAs
The Wall Street Journal article "It’s Open-Enrollment Season. Is an HSA Still Right for You?" examines the suitability of Health Savings Accounts (HSAs) during the open-enrollment period, especially amid the COVID-19 pandemic. HSAs, which are paired with high-deductible health plans (HDHPs), offer tax advantages and can be a strategic tool for managing healthcare expenses. However, the article emphasizes that individuals should carefully assess their healthcare needs, financial situation, and risk tolerance before opting for an HSA-eligible plan. Factors such as anticipated medical expenses, the ability to cover higher out-of-pocket costs, and the potential for long-term savings should be considered to determine if an HSA is the appropriate choice.
Reading: Unemployment Insurance
The Wall Street Journal article "Millions of Unemployed Americans Face Loss of Benefits at Year’s End," published on November 14, 2020, discusses the impending expiration of two key unemployment programs established during the COVID-19 pandemic:
1. Pandemic Unemployment Assistance (PUA): This program extended benefits to gig workers, freelancers, and others not typically eligible for unemployment insurance.
2. Pandemic Emergency Unemployment Compensation (PEUC): This program provided additional weeks of benefits to individuals who had exhausted their regular state unemployment insurance.
Both programs were set to expire on January 1, 2021, potentially leaving millions without financial support unless Congress enacted new relief measures. The article highlights the economic challenges and uncertainties faced by unemployed individuals as these deadlines approached.
Reading: Can the Pension Plan (Defined Benefit) Make a Comeback?
The Wall Street Journal article "Bring Back Corporate Pension Plans. Seriously." discusses the potential resurgence of corporate pension plans in the U.S. due to rising interest rates and a competitive labor market. Historically, defined-benefit pension plans were common, with 88% of Americans with retirement coverage participating in such plans 40 years ago. These plans provided guaranteed payouts, with employers bearing the investment risk. The article suggests that current economic conditions may make it feasible for companies to reintroduce pension plans, offering employees more secure retirement options and enhancing employer competitiveness in attracting and retaining talent.
Reading: Whole Life and Universal Life
The article "Whole Life vs. Universal Life: UL Evolves into Legacy-Protector and Robust Wealth Generator" by Guy Baker discusses the evolution and comparison of whole life (WL) and universal life (UL) insurance, highlighting their characteristics, market impact, and long-term considerations.
Key Points:
1. Historical Context:
- In the 1970s, whole life insurance was a dominant product, offering guaranteed premiums, cash value, and dividends.
- Rising interest rates in the 1980s challenged whole life policies as insurers introduced universal life insurance (UL) to provide flexibility in premiums and cash value.
2. Key Differences Between WL and UL:
- Whole Life (WL): Provides guarantees (premium, mortality cost, and cash value). Dividends depend on the insurer’s performance but are non-guaranteed.
- Universal Life (UL): Shifts risks (interest rates, mortality costs, expenses) to the policyholder. Premiums are flexible, and cash value depends on market assumptions, which are unbundled and transparent.
3. Market Impact of UL:
- UL gained popularity due to lower illustrated premiums and flexibility, which often led policyholders to replace existing whole life policies.
- UL's success introduced risks, especially when interest rates fell, exposing the limitations of assumptions made in the initial illustrations.
4. Innovations and Variants:
- Variable Universal Life (VUL): Combines UL flexibility with investment options, offering higher potential returns but increased risk.
- Indexed Universal Life (IUL): Balances guarantees with market-linked returns. It offers downside protection and upside potential, appealing to buyers seeking flexibility and growth.
5. Challenges and Risks:
- UL policies can underperform if not adequately funded, potentially leading to policy lapses when coverage is needed most.
- Flexibility in UL is both an advantage and a risk—underfunding reduces the compounding effect on cash value, turning the policy into an expensive term insurance.
6. Long-Term Considerations:
- Policyholders must understand the lack of guarantees in UL and the importance of consistent premium payments.
- Advisors play a critical role in educating policyholders about the policy’s merits and risks to ensure it meets long-term goals.
### Conclusion:
The article emphasizes that while universal life insurance offers flexibility and cost efficiency, its success depends on proper funding and realistic expectations. Whole life insurance, though less flexible, provides stability and guarantees. Indexed Universal Life (IUL) may serve as a middle ground for those balancing growth and security, but careful management is essential for any life insurance product to deliver on its promises.
Lifetime Income / Annuity
4% Rule at age 65 implies $1,000,000 allows us to withdraw $40,000 per year
Alternatively, using the $1,000,000 to purchase an annuity from an insurer at age 65 provides us with $60,000
Defined Benefit Plan / Formula / Final Salary / Vesting
DB Plan Formula:
Yearly Benefit = (0.02) * (Years of Service) * (Final Salary)
ex: (0.02) x (30) x ($200,000) = $120,000
Vesting in DB:
7-year graded vesting
Years of Service: 3, 4, 5, 6, 7
Vested%: 20, 40, 60, 80, 100
7-Year Graded Vesting:
Employee Contributions
Employer Contributions Vested
1
$2,000
$0
2
$4,000
$0
3
$6,000
$5,000 (20% of $25,000)
4
$8,000
$10,000 (40% of $25,000)
5
$10,000
$15,000 (60% of $25,000)
6
$12,000
$20,000 (80% of $25,000)
7
$14,000
$25,000 (100% vested)
5-year cliff year graded vesting
5-Year Cliff Vesting:
Employee Contributions
Employer Contributions Vested
1
$2,000
$0
2
$4,000
$0
3
$6,000
$0
4
$8,000
$0
5
$10,000
$25,000 (100% vested)
6
$12,000
$30,000 (100% vested)
7
$14,000
$35,000 (100% vested)
DB Vesting Summary
Summary of Vesting:
5-Year Cliff Vested (Employee / Employer) | 7-Year Graded Vested (Employee / Employer) | |
1 | $2,000 / $0 | $2,000 / $0 |
2 | $4,000 / $0 | $4,000 / $0 |
3 | $6,000 / $0 | $6,000 / $5,000 |
4 | $8,000 / $0 | $8,000 / $10,000 |
5 | $10,000 / $25,000 | $10,000 / $15,000 |
6 | $12,000 / $30,000 | $12,000 / $20,000 |
7 | $14,000 / $35,000 | $14,000 / $25,000 |
This table shows how vested amounts increase over time under the two vesting schedules.
PBGC (Pension Benefit Guaranty Corporation)
The PBGC insures defined benefit pension plans offered by private-sector employers. If an insured plan becomes underfunded or the employer goes bankrupt, the PBGC steps in to pay guaranteed benefits to retirees.
Defined Contribution (DC) Plan Vesting
Definitions:
3-Year Cliff Vesting:
0% vested in employer contributions for the first 2 years.
100% vested in employer contributions after 3 years.
6-Year Graded Vesting:
0% vested in employer contributions for the first year.
Gradual vesting from Year 2 onward:
Year 2: 20%
Year 3: 40%
Year 4: 60%
Year 5: 80%
Year 6: 100%
3-Year Cliff Vesting:
EOY | Employee Contributions | Employer Contributions Vested (Er) |
1 | $1,000 | $0 |
2 | $2,000 | $0 |
3 | $3,000 | $9,000 (100% vested) |
4 | $4,000 | $12,000 (100% vested) |
5 | $5,000 | $15,000 (100% vested) |
6 | $6,000 | $18,000 (100% vested) |
6-Year Graded Vesting:
EOY | Employee Contributions | Employer Contributions Vested (Er) |
1 | $1,000 | $0 |
2 | $2,000 | $1,200 (20% of $6,000) |
3 | $3,000 | $3,600 (40% of $9,000) |
4 | $4,000 | $7,200 (60% of $12,000) |
5 | $5,000 | $12,000 (80% of $15,000) |
6 | $6,000 | $18,000 (100% vested) |
Defined Contribution (DC) Plan Vesting Summary
Summary Table:
EOY | 3-Year Cliff Vested | 6-Year Graded Vested |
1 | $1,000 / $0 | $1,000 / $0 |
2 | $2,000 / $0 | $2,000 / $1,200 |
3 | $3,000 / $9,000 | $3,000 / $3,600 |
4 | $4,000 / $12,000 | $4,000 / $7,200 |
5 | $5,000 / $15,000 | $5,000 / $12,000 |
6 | $6,000 / $18,000 | $6,000 / $18,000 |
401k Plans
2024 Annual Contribution Limits:
$23,000 by employee (+$7,500 if at least age 50 = “catch up”)
$69,000 (or $76,500) combined employee and employer, including forfeitures (plus “catch up”), up to total salary
Must begin withdrawals by age 73 (10% penalty if before age 59.5)
Scenario Without a 401(k):
Gross Pay: $5,000 per month.
Income Tax: 20% tax on gross pay.
After-tax income = $5,000 × (1 - 0.20) = $4,000.
Savings Contribution: $1,000 contributed after taxes to a savings account.
Remaining after-tax income = $4,000 - $1,000 = $3,000.
Outcome: You save $1,000, but it is after taxes, reducing your remaining spendable income.
Scenario With a 401(k):
Gross Pay: $5,000 per month.
401(k) Contribution: $1,250 contributed pre-tax.
This reduces the taxable income to $3,750.
Income Tax: 20% tax applied to the reduced taxable income.
After-tax income = $3,750 × (1 - 0.20) = $3,000.
Outcome: You save $1,250 into the 401(k) account (more than in the first scenario) and still have $3,000 in after-tax spendable income.
Tontine
How a Tontine Works:
Initial Setup:
1,000 retirees each contribute $1,000, creating a $1,000,000 pool.
The pool buys a 3% bond, which generates $30,000 in annual interest.
Each retiree initially receives an equal share of the interest: $30,000 ÷ 1,000 = $30 each.
Over Time:
As retirees pass away, their share of the interest is redistributed among the survivors.
This redistribution creates a mortality credit, which increases payments to remaining participants.
Examples:
10 Years Later:
800 participants alive: $30,000 ÷ 800 = $37.50 per retiree.
The extra $7.50 is the mortality credit, a reward for surviving longer.
20 Years Later:
100 participants alive: $30,000 ÷ 100 = $300 per retiree.
The extra $270 is the mortality credit.
Final Stages:
When very few participants remain (e.g., 30 retirees), the payouts become significantly larger.
If 30 participants are alive, $30,000 ÷ 30 = $1,000 per retiree annually.
Important Numbers to Know
ItemsTen Numbers (approx.) to Know (Aug 2024) |
#1 Apple Market Cap | $3.5 Trillion |
#2 Nvidia Market Cap | $3.1 Trillion |
#7 Berkshire Hathaway Market Cap | $900 Billion |
World Population | 8 Billion |
US Population | 330 Million |
US Life Expectancy (Men / Women) | 76 / 80 Years |
US Federal Budget | $6 Trillion |
US GDP | $27 Trillion |
US Federal Debt | $35 Trillion |
Lifetime Income (at Age 65) | $1 Million Buys $60,000/Year |
Benefits Brokers
Marsh
Willis Towers Watson
Aon
Arthur J Gallagher
HUB International
USI
NFP Corp
Lockton
Alliant
Brown & Brown
Rule of 72
Example Calculations:
Investment with a 6% Return:
Time to double = 72/6 = 12 years
Investment with an 8% Return:
Time to double = 72/8 = 9 years
Investment with a 10% Return:
Time to double = 72/10 = 7.2 years
Coinsurance in Health Insurance
Breakdown:
Claim | Amount | Paid by Insured | Paid by Insurer |
1 | $2,000 | $2,000 (applied to deductible) | $0 (insured hasn’t met deductible) |
2 | $800 | $800 (applied to deductible) | $0 (insured hasn’t met deductible) |
3 | $600 | $200 (remaining deductible) + $80 (coinsurance) | $400 × 80% = $320 |
4 | $1,000 | $200 (coinsurance: $1,000 × 20%) | $800 (coinsurance: $1,000 × 80%) |
5 | $9,000 | $1,720 (remaining to reach out-of-pocket cap) | $7,280 (remaining claim after insured cap) |
Key Features:
Out-of-Pocket Limit:
Once the insured reaches $5,000, the plan pays 100% of covered claims for the remainder of the year.
Purpose of Coinsurance:
Encourages the insured to be cost-conscious since they share the cost of services (20% in this case).
Helps reduce overuse of healthcare benefits and keeps premiums lower.
High Deductible Health Plan (HDHP):
After the out-of-pocket cap is reached, the HDHP pays all subsequent claims in full.
HSA & HDHP
Category | Health Savings Account (HSA) | High Deductible Health Plan (HDHP) |
Purpose | Covers day-to-day medical expenses | Covers major medical expenses and emergencies |
Examples of Coverage | - Doctor visits | - Serious illnesses |
Funding | Contributions are tax-deductible and grow tax-free | Premiums are typically lower than traditional health plans |
Spending | Used for routine healthcare costs (pre-deductible) | Kicks in after the deductible is met |
Unused Funds | Roll over annually and grow tax-free for future use | Not applicable |
Contribution Limit | Roughly equal to the HDHP deductible (by law) | Deductible must meet the IRS minimum for HDHP eligibility |
Tax Advantages | - Contributions are tax-deductible | Not directly tax-advantaged |
Disability Risk and Plans
More likely (7x) than death during working years
1 out 10 will be permanently disabled before 65
Short-term
Usually < 6 months
Less stringent
More companies have short term plans
Long-term
Payout period may be lifetime
Usually paid for by employee
Common Exclusions
Self-inflicted wounds
Not under physician’s care
Injury prior to being covered
Disability Benefits
Benefit schedule
Percent of salary
Why not 100%
Moral hazard (malingering)
Favorable tax treatment
Expenses may be less
May be a weekly or monthly $ maximum
ex: 2/3 of salary with max of $3,000 per week
Federal Taxation
Federal Taxation of Disability Income (DI) Benefits
1. Employer Contributions:
- Treated as deductible business expenses for the employer.
- Not considered taxable income for the employee.
2. Employee Contributions:
- Made with after-tax dollars.
3. Taxation of DI Benefits:
- The portion funded by employer contributions is taxable as income when received by the employee.
- The portion funded by employee contributions is not taxable.
4. State Tax Treatment:
- Generally aligns with federal tax rules.
Example Scenario:
- If an employer contributes $200 and an employee contributes $100 monthly toward a DI plan:
- Benefits from the employer-funded portion (2/3 of the total) are taxable.
- Benefits from the employee-funded portion (1/3 of the total) are tax-free.
This tax structure incentivizes shared contributions while balancing the tax burden.
Federal Taxation of DI Benefits Example
To calculate the income taxes Katniss owes, let's break it down step by step:
Given Information:
1. Monthly LTDI Premium Contributions:
- Employer (MockingJay): $200
- Employee (Katniss): $100
- Total: $300
2. Disability Benefit: $12,000 per month.
3. Employer Contribution Proportion:
200/300 = 2/3
4. Marginal Tax Rate: 40%.
Taxable Portion of the Benefit:
The portion of the benefit attributable to employer contributions is taxable:
Taxable Portion = 2/3 × 12,000 = $8,000
Tax Owed:
Apply the tax rate (40%) to the taxable portion:
Tax Owed = 8,000 × 0.40 = $3,200
Answer:
Katniss will owe $3,200 in income taxes on her monthly disability benefit.
AIME
The image explains how to calculate the number of quarters of coverage needed for a worker to be fully insured for Retirement and Survivor Benefits under the Average Indexed Monthly Earnings (AIME) system. Here’s a breakdown:
Key Steps in the Calculation:
Determine the Relevant Period:
Worker was born in 1983 and dies in 2015.
The relevant years are after age 21 (2005) until the year of death (2015).
Total = 2015−2005 = 10 years
Calculate Minimum Quarters for Full Coverage:
Each year has 4 quarters.
Minimum quarters to be fully insured = 10 years × 4 quarters/year = 40 quarters.
Determine Number of Earnings Years for AIME:
Subtract 5 from the total number of quarters (as required by Social Security rules).
10−5 = 5 years of earnings are included in the AIME calculation.
AIME Calculation:
The worker's Top 5 years of indexed earnings are included in their AIME, which impacts the Retirement and Survivor Benefits.
Dakota is 20 years old and buys a Universal Life policy (Option B) with $1,000,000 of Face Amount. Dakota pays a $6,000 annual premium, the policy pays 7% interest each year, and there is a $20 annual expense charge. The mortality rate (charge) at age 20 is $1 per $1,000 of coverage, and this charge grows at 5% per year. Given this information, the Cash Value after the policy has been in force for a full 10 years would equal
Year 1:
Mortality Charge:
Mortality Charge = 1 × 1,000,000 / 1,000 = 1,000
Net Premium
6,000 - 20 - 1,000 = $4,980
Cash Value:
Cash Value (End of Year 1) = Net Premium x ( 1 + 0.07 )
Cash Value = 4,980 × 1.07 = $5,328.60
Updated Mortality Charge for Year 2:
New Mortality Charge = 1,000 × 1.05 = 1,050
Year 2:
Mortality Charge: $1,050
Net Premium:
Net Premium = 6,000 - 20 - 1,050 = 4,930
Cash Value (End of Year 2):
Cash Value = (5,328.60 + 4,930) x 1.07 = 10,976.70
Updated Mortality Charge for Year 3:
New Mortality Charge = $1,050 × 1.05 = 1,102.50
Year 3:
Mortality Charge: $1,102.50
Net Premium:
Net Premium = 6,000 - 20 - 1,102.50 = 4,877.50
Cash Value (End of Year 3):
Cash Value = (10,976.70 + 4,877.50) x 1.07 = 16,964.00
Updated Mortality Charge for Year 3
New Mortality Charge = 1,102 × 1.05 = 1,157.62
Year 10 = $70,309
For someone who is paid $50,000 per year, the combined employer/employee FICA taxes will amount to less than $7,600.
( 7.65% + 7.65% = 15.30% ) *$50,000 = $7,650
The statement would be FALSE
Employees typically contribute to the cost of employer-provided health insurance premiums with pre-tax dollars. Assume that the health insurance premium is $9,000. If you were paying for your health insurance with after-tax dollars, how much would you need to earn before taxes so that you would end up with $9,000after-tax, assuming your tax rate is 25%
9,000 / ( 1 - .25) = $12,000
OR:
$12,000 * ( 1 - .25) = $9,000
Marvella is 40 years old and has $300,000 of group life insurance through McDonald’s. She contributes .03 per thousand of coverage, per month, while her employer contributes the rest of thecost. If her tax rate is .20, how much tax will she owe each year on this employee benefit (use the Table 1 costs from the class PPTs)?
$250 .10 12 = $300 is the IRS value of the insurance
$300 .03 12 = $108 is Marvella’s contribution each year
$192 is the value of the employee benefit paid by McDonald’s
$192 * .20 = 38.40 is the tax she will owe
To calculate the annual mortality charge in a Universal Life (Option B) policy, we take the mortality rate, as stated in the policy for that particular age) times the Face Amount (in thousands) of the life insurance policy. For example, if Sam has a UL policy with $150,000 of coverage, and if the mortality charge in the policy for Sam at age 40 is $3 per thousand of coverage, then the mortality charge in Sam’s Universal Life policy for that year would equal $20
[ $3 * (150) = $450 ]
Statement is FALSE
Since life insurers have been earning relatively high rates of returns on their investments (from high interest rates over the past 10 years), many life insurers have been reducing the mortality rates (and charges) within UL policies that were purchased by consumers many years ago and that are still in effect today, as discussed in our Readings.
a.True
b.False
b. FALSE, Life insurers have not been reducing mortality rates within UL policies
Most group life insurance is cash value life insurance.
a. True
b. False
b. FALSE, most group life insurance is term life
The “savings” component within a permanent life insurance policy is known as the:
a. Cash Value
b. Savings Account
c. Accumulation Cash Fund
d. Net Reserve Account
e. Capital Depreciation Fun
a. Cash Value
Life expectancy (by age) at birth is lower than life expectancy at age 75.
a.True
b.False
a. TRUE, by age 75 an individual has already survived many earlier life risks, so the remaining life expectancy tends to be higher for those who reach that age.
Based on our Readings, Universal Life shifts much of the risk to the policyowner, relative to traditional Whole Life.
a.True
b.False
a. TRUE, In Universal Life, the policyowner has flexibility in premium payments, death benefits, and cash value growth. However, this also means that the policyowner bears the risk of ensuring sufficient premiums are paid to maintain the policy.
Based on our discussions and the Readings, the Net Amount at Risk in a traditional cash value life insurance policy changes throughout the life of the policy. As time goes by, the Net Amount of Risk:
a. decreases
b. increases
a. DECREASES, this is because the cash value of the policy grows, and the insurer’s liability (death benefit - cash value) reduces as the cash value approaches the policy’s face amount.
Rachel has Disability Income Insurance through her work at JR-Min. JR-Min contributes $90 per month and Rachel contributes $30 per month toward the cost of the coverage. Rachel becomes disabled and unable to work, and she starts receiving monthly disability income $4,000. Rachel's marginal tax bracket is 20%. Rachel's after-tax monthly income will be:
4000 - ((90/120) x 4000 × 0.20) = $3,400
Health Savings Accounts (HSAs) are even more advantageous than 401(k) plans in the sense that FICA taxes (Social Security taxes) are not owed on the amounts that an employee contributes to an HSA, whereas FICA taxes are still owed on amounts that an employee contributes to a 401k
a. True
b. False
a. True
Morgan has a Health Savings Account coupled with a High-Deductible Health Plan that contains a $4,000 aggregate deductible and an 80-20 percentage participation clause, along with a $5,000 out-of pocket limit (cap). Calculate how much the HDHP will pay toward the last (fifth) claim (of $7,000).
The sizes of the five claims are:
$2,000
$1,200
$1,800
$3,000
$7,000
An employee who owns 4% of the stock of a company and who was paid $100,000 last year would be considered a Highly Compensated Employee.
a. True
b. False
b. False
A person’s retirement benefit is increased if they retire earlier than the plan’s Normal Retirement Age.
a. True
b. False
b. False
Identify the FALSE statement about Disability Income Insurance:
a. Disability Income Insurance typically replaces approximately 90% of a person’s monthly pre-tax income
b. Short-Term Disability Income Insurance typically provides somewhere between 6 months and 2 years of income replacement
c. The likelihood of becoming disabled and unable to work at some point between ages 25-65 is about 7 times higher than the chance of death.
d. Typical exclusions in Disability Income Insurance policies are war, self-inflicted wounds, and pre-existing injuries
a. Disability Income Insurance typically replaces approximately 90% of a person’s monthly pre-tax income
Which of the following is not a benefit of HSAs?
a. Contributions are not subject to income tax when they are contributed
b. Contributions grow on a tax-deferred basis
c. Contributions are not subject to FICA taxes
d. Contributions can be used to pay for health insurance premiums, just like for medical expenses
d. Contributions can be used to pay for health insurance premiums, just like for medical expens
Sheena was born in 1992 and began earning wages when she turned 16. In 2019, she died in a downhill skiing accident. To be fully insured and therefore eligible for Social Security survivorship benefits, how many quarters of coverage does Sheena need to have earned?
a. 11
b. 5
c. 13
d. 6
e. 10
d. 6
2019 minus 2014 = 5, but the minimum is always 6
Jack was born in 1985 and began earning wages when he was 20. In 2019, he died in a car racing accident. For Social Security survivorship benefits, how many years should be included in his AIME calculation?
a. 7
b. 8
c. 9
d. 5
e. 6
a. 7
2019 - 2007 = 12
And then we always subtract 5, which equals 7
If Jud's AIME equals $5,000, what is his PIA, based on our discussion of bend points and percentages in class?
a. $1,694.61
b. $3,265.67
c. $1,992.45
d. $1,980.94
= 0.90 × 767 + 0.32 x (4624-767) + 15 x (5000-4624)
= $1,980.94
ABY has a contributory DC pension plan with 6-year graded vesting. Jill worked and participated in the plan for 4 years and then quit. When Jill quit, the accumulated value of her contributions was $12,000. The accumulated value of the ABY’s contributions made on Jill’s behalf was $20,000. What will be the amount of Jill’s forfeiture?
4 years on a 6-year-graded plan means that Jill was 60% vested.
So, she will forfeit 40%.
$20,000 * 40% =
$8,000