CFA Level 1: Equity Investments
 Call Kai
 Learn
Learn Practice Test
 Spaced Repetition
 Match
Match Flashcards
 Knowt Play
1/132

There's no tags or description
Looks like no tags are added yet.
Name | Mastery | Learn | Test | Matching | Spaced | Call with Kai | Chat |
|---|
No analytics yet
Send a link to your students to track their progress
133 Terms
Long Position (L1)
Buying of shares if prices go up, thus increasing the value of the asset.
Short Position (L1)
Selling the shares, if prices go down, thus asset price declines.
Porter’s Five Force (L6)
Strong forces mean low industry profitability. Analyst can be alert to drivers of future industry profitability.
I. Threat of Substitute
II. Threat of new entrants
III. Bargaining power of suppliers
IV. Bargaining power of customers
V. Competitive rivalry among existing competitors
Historic Growth Rate (L6)
Enables an analyst to consider if growth can continue or slow too close to GDP, or begins to decline.
Weak Form (L3)
A efficiency test standard that focuses on patterns & results of specific trading rules. If evidence of presence it indicates developed markets are weak form efficient.
Industry Classification Method (L6)
Groups companies by the products and service offered by the firm’s principal business activity.
A much narrow way to group companies: geography, ESG characteristics, sensitivity to business cycle, similar investment characteristics.
Industry Survey (L6)
An inquiry that determines growth, profitability, industry size, business cycle sensitivity, market share trends.
Style Box (L6)
A tool used to classify industries by growth rate and business cycle sensitivity.
Cyclical Industries (L6)
Companies that are sensitive to economic expansions and recessions.
Defensive Industries (L6)
Companies that are resilient to business cycle trends, and are willing to remain stable.
Growth Industry (L6)
Companies in industries that have untapped potential and are expected to have above average growth.
Mature Industry (L6)
Companies in industries that have exhausted its growth potential.
PESTLE Analysis (L6)
A tool that can be used to consider the long-term industry growth rate.
Focuses on the subjects of:
Political, Economic, Social, Technological, Legal, & Environmental
Competitive Positioning (L6)
I. Does the strategy create a defense against the 5 industry forces.
II. Does the strategy benefit from PESTLE influences?
III. Does the company have the resources and capabilities to execute the strategy.
Benefits of PESTLE (L6)
Allow analysts to isolate themes or narratives that investors may want exposure to/avoidance of.
Industry Base Rate (L6)
Overall baseline on profitability for the industry as a whole.
Objectives of Financial Markets (L1)
I Price Discovery
II Liquidity
III Capital Allocation & Raising
Steps in Industry Competitive Analysis (L6)
I Define Industry
II Industry Survey
III Industry Structure
IV External Influences
V Competitive Analysis
Fixed Growth Rate Forecasting (L7)
Used for fixed expenses such as depreciation & amortization, sales general administration, cash, physical assets, rent, and loan.
Variable Growth Rate Forecasting (L7)
Used for variable expenses such as Cost of Goods Sold & Selling Expense
Top Down Analysis (L7)
A method of forecasting revenue that starts with expectations about macroeconomic variables.
Such as : GDP, interest rates, or unemployment rates
Bottom-Up Analysis (L7)
A method of forecasting revenue that starts with analysis of individual company attributes
Such as : Average selling prices and volumes, product line or segment revenues, capacity-based measures, return based measures.
Working Capital Forecasting (L7)
Forecasts are typically made using efficiency ratios as the forecast object combined with sales and cost forecasts,
Comprises of accounts receivable, inventories, and accounts payables.
Scenario Analysis (L7)
Future outcomes are likely to be different from expectations, with built in different outcomes and probabilities.
Hybrid Forecasting Revenue Analysis (L7)
Revenue forecasting is determined using both top-down and bottom-up approaches and methods.
Forecasting: Cost of Goods Sold (L7)
An operating expense forecasting method in which is closely related to sales, and thus is usually estimated as a percentage of revenue (1 - GROSS MARGIN).
Normally is expected to increase with increased market shares.
Forecasting: SG& A (L7)
An operating expense forecasting method in which is less sensitive to changes in sales volume because of their fixed cost element.
Fixed elements can be modeled using a fix growth rate plus inflation.
Variable elements will be more directly realted to sales volume.
Forecasting Capital Investments (L7)
Requires the cash flow statement (for additions and disposals) and the income statement (for depreciation).
Historic depreciation will increase by the relevant inflation rate, as replacement asset costs will increase with inflation.
Forecasting value of future asset purchases (L7)
Subjective and require knowledge of management growth strategy.
Forecasting Capital Structure (L7)
Requires analysis of leverage ratios, target structure, and borrowings.
Forecast Approaches (L7)
Analyst focus on forecast objects, which may be a financial statement line, a driver of a line, summary measures.
Analyst Discretionary (L7)
A forecasting approach based on an analyst's own judgment, experience, and research, rather than relying solely on a mathematical model.
The analyst combines information from multiple sources, such as:
Financial statements
Industry trends
Economic conditions
Competitor performance
Meetings with management
Personal expertise
Management Guidance (L7)
A forecasting approach that relies on information or projections provided by the company's management.
Management may provide guidance for:
Revenue
Earnings per share (EPS)
Profit margins
Capital expenditures
Future growth
Historical Base Rates and Convergence (L7)
A forecasting approach that assumes that extreme performance tends to move back toward the historical average over time.
Instead of assuming unusually high or low growth continues forever, the analyst expects results to converge toward long-run averages often called mean reversion.
Historical Forecast (L7)
A forecasting approach that future performance will be similar to past performance. Sometimes called the historical growth approach or naïve forecasting.
Multiplier Models (L8)
A type of equity valuation model that looks at is fundamentals to market price.
Ratio of stock price to earnings, sales, better values, cash flows and focus on equity value.
Enterprise value multiple looks at providers of all sources of finance.
Asset-Based Models (L8)
A type of equity valuation model that looks at the net assets, or total asset value less liabilities and preferred stock.
Discount Cash Flow Models (L8)
A type of equity valuation model that looks at the present value of future dividends for minority share holders and present value of future cash flows to controlling shareholders.
Present Value Models (L8)
Estimate value as present value of expected future benefits.
Dividend Discount Model (L8)
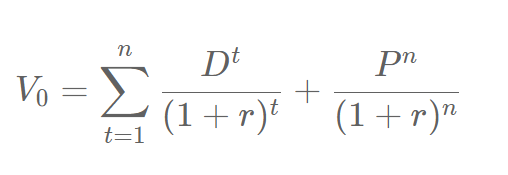
Intrinsic Value = PV of Future Dividends + PV of terminal value
Used to calculate a stocks intrinsic values based on present value of it expected future dividends.
Gordon Growth Model (L8)
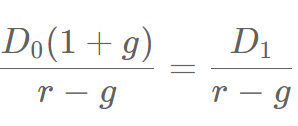
Most common type of dividend discount model, used for the assumption that dividends grow forever at a constant rate.
g = dividend growth rate r = required rate of return
D0 (1+g) = Expected Dividend next period
Assumptions for Gordon Growth Model (L8)
Required rate of return > dividend growth rate
Dividends must grow at a constant rate forever
Dividend Growth Rate (g) (L8)
B = Earnings Retention Ratio
ROE = Return on Equity

Retentions Earning (b) (L8)
Earnings Retention Rate * ( 1- Dividend Payout)

Security Valuation: Asset is Under Valued (L8)
Market Price < Estimated Value
Security Valuation: Asset is Overvalued (L8)
Market Price > Estimated Value
Security Valuation Profitability (L8)
The security must be misvalued now and converge toward intrinsic value in the future.
Cash Dividends (L8)
Payments made to shareholders in cash.
Regular Dividends
Extra (special) dividends
Stock Dividend (L8)
Payments to shareholders in shares of stock.
Stock Split (L8)
Proportionate increase in shares outstanding.
Reverse Stock Split (L8)
Proportionate decrease in shares outstanding.
Share Repurchases (L8)
An alternative to a cash dividend as a way to distribute cash to shareholders:
Tax advantage to shareholders if tax rate on capital gains in less tax rate on dividends
Signal to shareholders that management believes shares are undervalued
Can offset increase in shares outstanding sue to employee exercise of stock options.
Payment Date (L8)
Dividend payment made to shareholders.
Declaration Date (L8)
Company declares and approves the dividend.
Ex-dividend Date (L8)
Cutoff date on or after which buyers of a stock are not eligible for the dividend. Also the first date where the stock trades without dividend.
Holder-of-Record Rate (L8)
A record of shareholders who are eligible to receive dividend is made, usually 2 days after ex-dividend date.
Preferred Stock Valuation (L8)
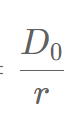
Usually pays a fixed dividend and has no maturity date.
D0= preferred dividend
Kp = Discount Rate
Present Value Models Advantages (L8)
Theoretically sound
Widely Accepted
Present Value Models Disadvantages (L8)
Input must be estimated
Valuation can be sensitive to input values
Dividend basis not appropriate for all companies
Advantages of Price Multiple Approach (L8)
Widely used, readily available
Easy to calculate
Can be used for cross-sectional analysis or time series analysis
Associated with equity returns
Can be distorted by accounting methods and choices.
Enterprise Value /EBTIDA (L8)
A common multiple useful for comparing companies with different capital structures, to evaluate the cost of a takeover and for analyzing loss making companies. However:
May avoid issue of negative earnings
Could use operating income as a proxy
Enterprise Value (L8)
Market value of debt + Market value of equity + Market value of preferred stock – cash and short term investments
Seen as the cost of a takeover
Useful when comparing companies with different capital structure.
Asset-Based Valuation (L8)
Net assets of company used to provide a baseline minimal value. Also known as liquidation value.
Downsides to Asset-Based Valuation (L8)
Hard to establish market/fair values for some assets.
Valuing intangible assets- whether on or off the books.
Accounting values may diverge from fair values.
Free Cash Flow to Equity (L8)
A free cash flow model that measures of dividend capacity, can be used for a non-dividend-paying stock.
Cash Flow from Operations - Capital Expenditure + Net Borrowing
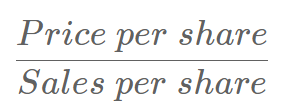
Price-to-Sales Ratio (P/S) (L8)
Shows how much the market values every dollar of the company's revenue. It is highly useful for young, fast-growing startups or companies that are not yet profitable.
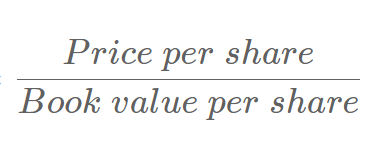
Price-to-book Ratio (L8)
Compares the stock's market value to its "book value" (its net assets / total assets minus total liabilities). It is often used for financial firms and asset-heavy businesses.
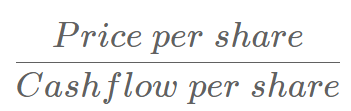
Price to Cashflow Ratio (L8)
Compares the market price to the operating cash flow per share. Because cash flow is harder to manipulate than net income, this metric provides a highly reliable look at a firm's financial health.
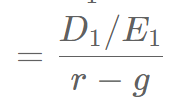
Price to Equity Ratio (L8)
Composed of growth rate, required rate of return, dividend payout ratio.
Ratio is higher if firm has: higher growth rate, higher payout ratio, lower required return.
Initial Report (L5)
A company research report that focuses on:
Front Matter
Recommendation and rationale
Company Description (business model, and strategy)
Industry overview and competitive positioning
Financial Analysis
Valuation
ESF and other risk factors
Subsequent Reports (L5)
A company research report that focuses on:
Front Matter
Recommendation (amendments)
Valuation
Risk (changes)
Analysis of new information
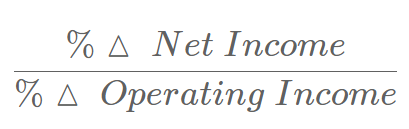
Degree of Financial Leverage (DFL) (L5)
Measures how sensitive net income (or EPS) is to changes in operating profit (EBIT), and reflects on the effect of debt financing.
Degree of Operating Leverage (DOL) (L5)
Measures how sensitive operating profit (EBIT) is to a change in sales. Important in the consideration of risk and capital structure.
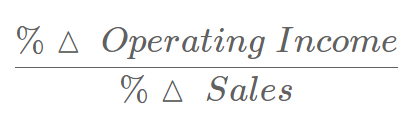
Operating Profit (L5)
Understanding the nature of costs as fixed vs variable an implications for forecasting profit.
Q = Units solid per period FC= Fixed Operating Costs
P = Price per unit VC= Variable Operating Costs

Output for Operating Profit (L5)
The major driver of profitability:
Economies of scale
Economies of scope
Sources of Capital (L5)
Equity issuance
Asset Disposals
Debt Issuance
Cash Flow Operations (CFO)
Uses of Capital (L5)
Cash and investments on hand
Acquisitions
Debt Paydown
Dividends and Share Repurchases
Positive Net Working Capital
Additions to intangibles
Capital Expenditure
Economic Profit (L5)
Return on Invested Capital > Weighted Average Cost for Capital
No Economic Profit (L5)
Return on Invested Capital < Weighted Average Cost for Capital
Revenue Drivers (L5)
Consider the pricing power — ability to set prices without affecting sales volume. Driven by market structure:
Perfect competition (low) to monopoly (high)
Also consider position in the market.
Bottom Up Revenue Drivers (L5)
Volumes
Prices
Understand each product line/segment
Top Down Revenue Drivers (L5)
GDP growth
Market size
Market share
Degree Total Leverage (DTL) (L5)
A financial metric that measures how sensitive a company's earnings per share (EPS) or net income is to a change in sales revenue.

Unlevered Returns (L5)
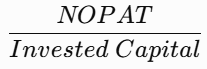
The return on invested capital that looks at all returns on finance, it excludes cash and investments.
Common Stock Key Features (L4)
Voting Rights: Right to vote at AGM and by proxy, cumulative voting can help minority shareholders, and may be nonvoting classes of equity.
Dividends: Variable, no contractual right
Features: Residual claim on assets, and perpetual
Risk/Return: Return through dividends and capital gains. With high risk and return.
Preferred Stock Key Features (L4)
Voting Rights: No voting rights
Dividends: Usually fixed % of par that is either cumulative and participating.
Features: May be perpetual, convertible, callable, and putable.
Risk/Return: Return largely through dividends, with low risk and return
Advantages of Private Equity (L4)
When compared to public equity:
Reporting requirements less.
More able to focus on long term.
Potentially greater return for investors once firm goes public.
Disadvantages of Private Equity (L4)
When compared to public equity:
Less, liquid, less able to raise capital, less disclosure, may weaken governance.
Leverage Buyout (LBO) (L4)
A type of private equity investment that uses debt to buy all outstanding stock.
Venture Capital (L4)
A private equity investment that provides financing for early stages of firm development.
Management Buyout (MBO) (L4)
A type of private equity investment that uses debt to buy all outstanding stock.
Participating Preferred Shares (L4)
Dividend increased if profits exceed a prespecified level.
Callable Preferred Shares (L4)
Can be bought back by the issuer at a prespecified price.
Cumulative Preferred Shares (L4)
Unpaid dividends must be paid before common shares dividend paid.
Sponsored Depositary Receipts (L4)
Firms are involved with issue.
Greater reporting requirements
Same voting and dividend rights as share holders.
Unsponsored Depositary Receipts (L4)
Depositary buys shares in foreign market
Bank retains voting rights.
Private Investment in Public Equity (PIPE) (L4)
A type of private equity investment that uses public firms to raise equity capital in private placement.
Weak Form (L3)
A test of efficiency that is used to test for patterns and results of specific trading rules.
If profitable trading rules or patterns persist, market is not weak form efficient.
Relies heavily on past market data
Implications: Abnormal returns cannot be earned by trading on past price trends. Technical analysis helps maintain weak-form efficient markets.
How to Beat the Market: No Value in technical analysis (using past price and volume data)
Strong Form (L3)
A test of efficiency that tests whether trading on inside information generates sexcess returns.
Relies heavily on past market data, public information, and private information.
Implications: Securities markets are not strong-form efficient as it assumes perfect markets where information is cost-free and available to everyone at the same time. Hence, abnormal profits can be made by trading on private information, which regulators try to prevent.
How to beat market: No one can beat the market.
Semi-Strong Form (L3)
A test of efficiency that uses event studies check reaction to news.
If traders reacting to news make abnormal profit, market is not semi-strong efficient.
Relies heavily on public information and past market data.
Implications: Investors cannot achieve risk-adjusted excess returns using important public info. Fundamental analysis helps maintain semi-strong form efficient markets.
How to beat market: Inside Information