Graphs | AP Micro MV 2025-2026
1/12
Earn XP
Description and Tags
Change your settings to "Answer with definition" to make the questions more similar to Mosnter Vocab!
Name | Mastery | Learn | Test | Matching | Spaced |
|---|
No study sessions yet.
13 Terms
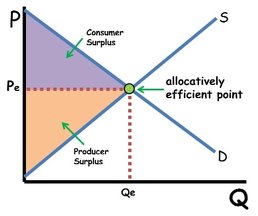
Demand and Supply with Surpluses
Graph showing the relationship between quantity demanded and supplied, illustrating shortages and surpluses at different prices.
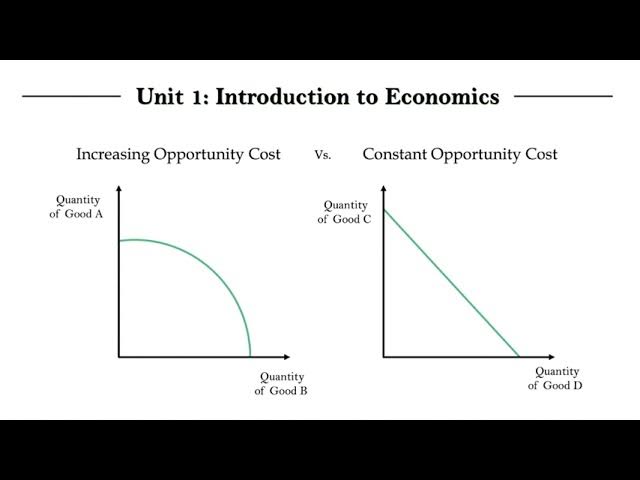
Production Possibilities Curves
Graphs that show constant (straight line) or increasing (bowed) trade-offs between two goods.
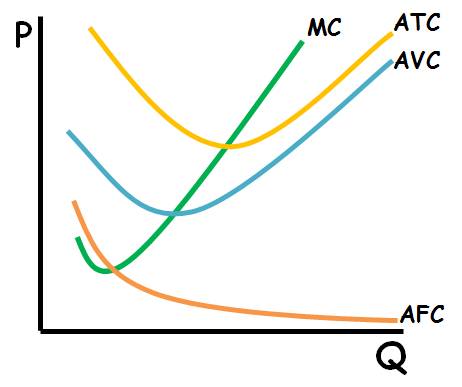
Cost Curves (Fixed, Average, Total, Marginal)
Graphs depicting different costs in production: fixed costs (constant), average costs, total costs, and marginal costs.
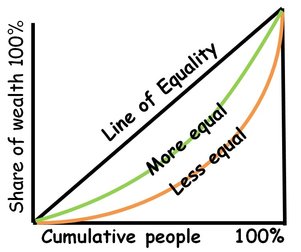
Lorenz Curve
Graph showing income distribution and inequality in a population.
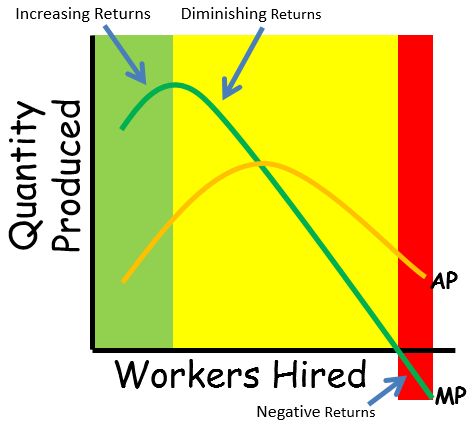
Law of Diminishing Marginal Returns
Graph illustrating that adding more of one input to fixed inputs eventually causes marginal output to decrease.
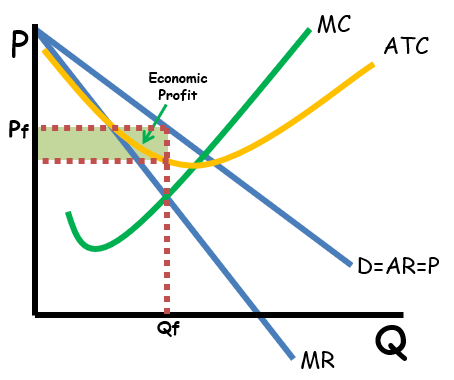
Monopoly Graph
A downward-sloping demand curve, a marginal revenue (MR) curve below it, and a marginal cost (MC) curve. The profit-maximizing output is where the MR and MC curves intersect. setting the price. This results in a price higher than marginal cost, a reduced output compared to a competitive market, and the potential for long-term supernormal profits.
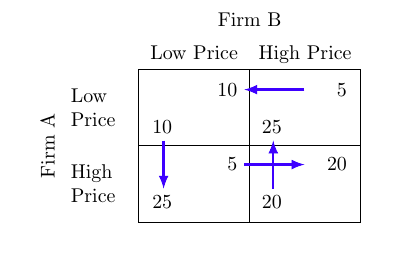
Payoff Matrix (Game Theory)
Matrix showing the payoffs for players in strategic decision-making situations like the prisoners’ dilemma.
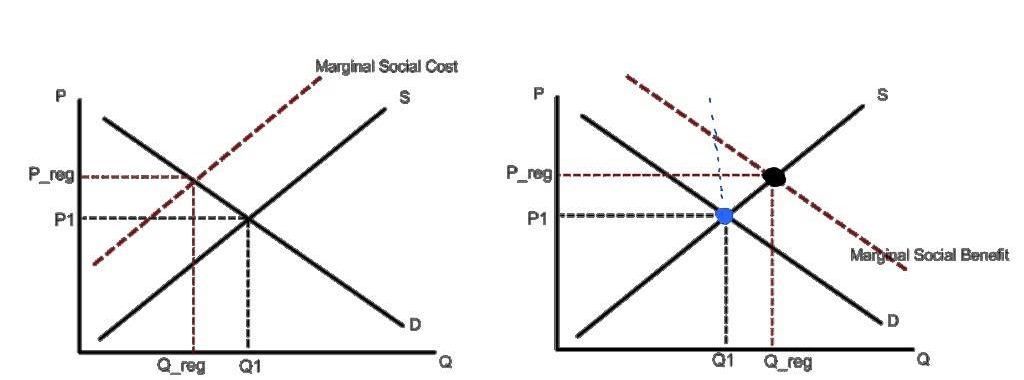
Externality with Deadweight Loss (Negative and Positive)
Graphs showing how external costs or benefits cause market inefficiency and deadweight loss.
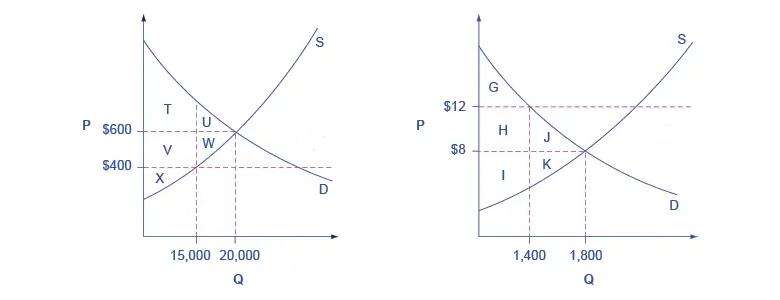
Government Set Prices (Price Ceilings and Floors)
Graphs showing effects of legal price limits causing shortages or surpluses.
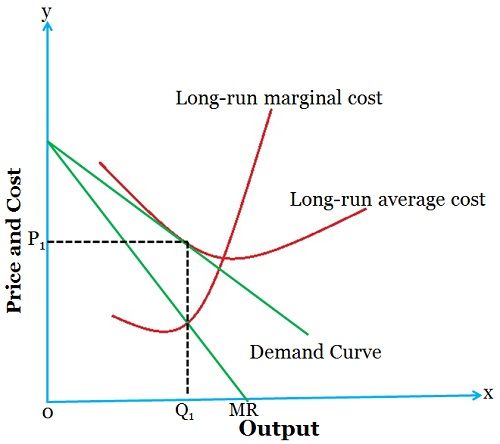
Monopolistic Competition Graph
A graph characterized by a downward-sloping demand curve and a marginal revenue (MR) curve that lies below it
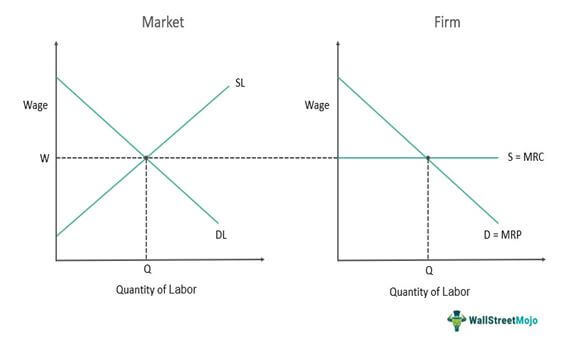
Factor Market Competition Perfect Competition
Two side-by-side graphs to show how the wage rate is determined by supply and demand in the overall market, and how an individual firm decides how much of a resource (like labor) to hire. The market graph shows a standard downward-sloping demand curve and an upward-sloping supply curve, with their intersection defining the market wage. The firm graph shows a horizontal demand curve at the market wage, illustrating that the firm is a price-taker and will hire labor up to the point where the marginal revenue product of labor equals the market wage.
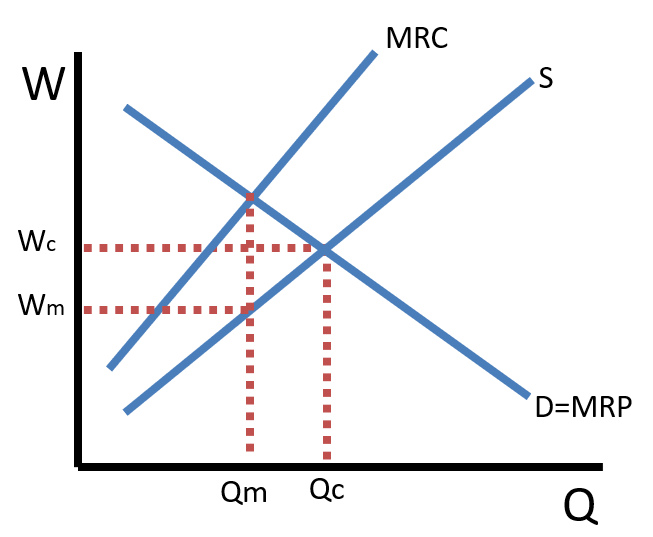
Monopsony
Illustrates a single buyer's control in a market, typically a labor market, showing an upward-sloping supply curve of labor. It plots the Marginal Revenue Product (MRP) and the higher Marginal Factor Cost (MFC) curves against the supply curve to show that the profit-maximizing quantity of labor is found where MRP = MFC
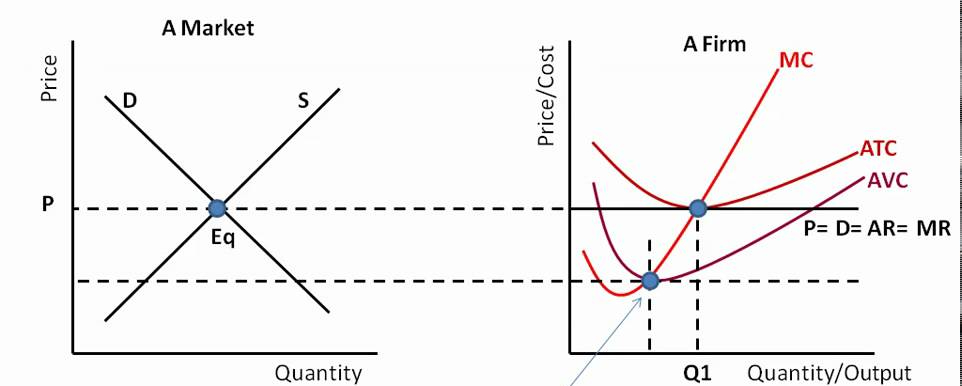
Product Market Perfect Competition
Two side-by-side diagrams: one for the overall market and one for the individual firm. The market graph shows a standard downward-sloping supply and upward-sloping demand curve, with their intersection determining the equilibrium price and quantity. The firm graph uses a horizontal demand curve at the market price, as the firm is a price taker. This horizontal curve also represents the firm's average revenue (AR) and marginal revenue (MR). The firm produces where marginal cost (MC) equals marginal revenue (MR) to maximize profit.