GW Blok 6 Seminar 4.2 Chi-square test for categorical variables
1/3
There's no tags or description
Looks like no tags are added yet.
Name | Mastery | Learn | Test | Matching | Spaced | Call with Kai |
|---|
No study sessions yet.
4 Terms
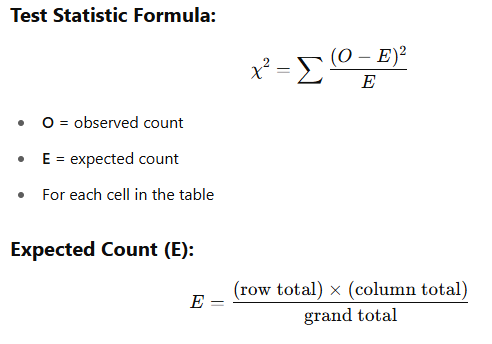
What is the chi-square test of independence?
To test whether two categorical variables are statistically associated (i.e., not independent)
This test statistic can safely be used, if all expected counts are larger than 5 (see bottom table under sub a.) Then use asymptomatic sig. for p-value
Otherwise use the exact sig. for p-value
Degrees of freedom: (number of rows - 1) x (numer of columns - 1)
If p-value < 0.05 → Reject H₀
There is a significant association
If p-value ≥ 0.05 → Do not reject H₀
No significant association
A large chi-square → more difference between observed & expected → more evidence against H₀
What are the different ways to write hypotheses? (probability function, RR, OR)
In words:
H₀: No relationship between the two variables → they are independent
Hₐ: There is a relationship → they are not independent
Example – Social Distancing & Study Program: a) Probability formulation:
H₀: π(social distancing = yes | EPH1026) = π(social distancing = yes | GZW1026)
Hₐ: π(social distancing = yes | EPH1026) ≠ π(social distancing = yes | GZW1026)
b) Relative Risk (RR):
H₀: RR = 1
Hₐ: RR ≠ 1
c) Odds Ratio (OR):
H₀: OR = 1
Hₐ: OR ≠ 1
What are the assumption of the chi-square test?
Groups are independent
Observations are independent
Every person occurs only once in one cell of the cross table. Hence no repeated measurements for 1 person.
This is an assumption
Expected frequencies (E) ≥ 5
Not an assumption
If not satisfied: better to employ an exact test (Fisher’s)
We can still do the chi square test if there are more than 2 levels (ex. not vaccinated, a little, a lot)
How can you quantify the strength of an association?
To quantify the strength of association, use RR or OR
You can’t calculate the RR with a case control study design
You can always calculate the OR
Remember in the sample:
The probability (“risk”) of supporting social distancing after vaccination for EPH1026 is 2.3 times the probability (“risk”) for GZW1026
The odds of supporting social distancing after vaccination in EPH1026 is 3.3 times the odds in GZW1026
At the population level, there is evidence that RR≠1 (i.e., OR ≠1). Why?
We are rejecting H0 → we assume a relationship