ISYE 6414 Formulas
1/30
There's no tags or description
Looks like no tags are added yet.
Name | Mastery | Learn | Test | Matching | Spaced | Call with Kai | Chat |
|---|
No analytics yet
Send a link to your students to track their progress
31 Terms
ANOVA F-Statistic Degrees of Freedom
F(k - 1, n - k)
So, with 303 data points and 3 sports the degrees of freedom is: F(2,300)
So, with 4 groups and 40 samples the degrees of freedom is: F(3,36)
In ANOVA, when n is the total number of observations and k is the number of groups, what is the degrees of freedom for the pooled variance estimator?
n-k
So, with 300 observations and 4 groups it is 296
1 intercept + 3 group indicators = 4 paramters
MSR
SSR / P
SSTR / (k - 1)
MSE
REGRESSION
MSE = SSE / (n-p-1)
ANOVA
MSE SSE / (n - k)
Answer is 2.05
F-Statistic (F₀)
MSR/MSE (explained variance) / (unexplained variance)
or
(SSR / P)
————
SSE / (n - p - 1)
R²
1 - (SSE/SST) = SSR/SST
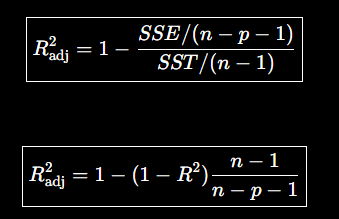
R² Adjusted
SST
SSR + SSE
or
SST = Σ(yᵢ - ȳ)²
SSR
SST − SSE
or
SSR = Σ(ŷᵢ - ȳ)²
SSE
SST − SSR
or
SSE = Σ(yᵢ - ŷᵢ)²
ESS
SST - SSE
R² × SST
Multiple Linear Regression Equation
Y = β₀ + β₁X₁ + β₂X₂ + ... + βₚXₚ + ε
Estimated Regression Equation
Ŷ = b₀ + b₁X₁ + b₂X₂ + ... + bₚXₚ
Estimated Regression Equation (Matrix Formula)
β̂ = (XᵀX)⁻¹XᵀY
Null Hypothesis
H₀: β₁ = β₂ = ... = βₚ = 0
Alternative Hypothesis
Hₐ: At least one βⱼ ≠ 0
VIF Formula
1 / (1 - Rⱼ²)
VIF (Variance Inflation Factor)
VIF = 1 No multicollinearity
VIF > 5 Potential concern
VIF > 10 Serious concern
Cook’s Distance Cutoff
4/n (holistically validate)
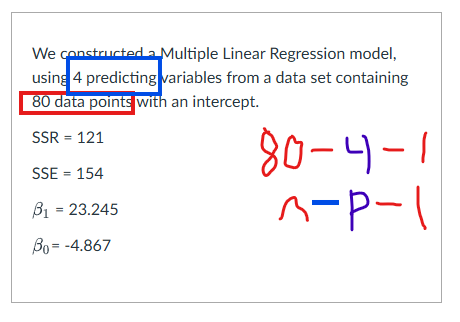
Multiple Regression DF
Regression df = p
Error df = n - p - 1
F(p, n - p - 1)
ANOVA DF
p = k - 1
F(p, n - p - 1)
is equivalent to
F(k - 1, n - k)
Box-Cox transformation
λ = 2 y² strongly stretches large values
λ = 1 y no transformation
λ = 0.5 √y moderately compresses large values
λ = 0 log(y) strongly compresses large values
λ = -0.5 1/√y reverses and compresses values
λ = -1 1/y stronger reciprocal transformation
T-Value
Estimate / Std Error
Std Error
Estimate / T-Value
Estimate
T-Value * Std Error
T-Value Reject/Fail
Fail to reject H₀ if: |t-value| < t-critical There is not enough evidence to conclude that the predictor has a statistically significant relationship with the response.
Reject H₀ if: |t-value| > t-critical There is enough evidence to conclude that the predictor has a statistically significant relationship with the response.
P-Value Reject/Fail
Fail to reject H₀ if: p-value > α There is not enough evidence to conclude that the predictor has a statistically significant relationship with the response.
Reject H₀ if: p-value < α There is enough evidence to conclude that the predictor has a statistically significant relationship with the response.
Standardized Residual Calculations (outliers)
|Standardized residual| > 2 → Possible outlier
|Standardized residual| > 3 → Strong evidence of an outlier
A standardized residual greater than 1 alone is not usually considered an outlier.
Default for Error terms in Simple linear regression
Zero mean and error term
Independent variable (1 for slr)
Constant Variance
Normality distribution
R²
R² = ρ² = Coefficient of Determination
Total Observations
DF + All predictors