stats chapter 1
1/29
Earn XP
Description and Tags
Name | Mastery | Learn | Test | Matching | Spaced |
|---|
No study sessions yet.
30 Terms
Data
Collections of observations
Statistics
The science of planning studies and experiments, obtaining data, and then organizing, summarizing, presenting, analysing, and drawing conclusions based on data
census
The collection of data from every member of the population
Population
Complete collection of all individuals to be studied
Sample
A sub collection of members from a population
Parameter
A numerical measurement describing some characteristic of a population
Statistic
A numerical measurement describing some characteristic of a sample
Quantitative data
Consists of numbers representing counts or measurements
Categorical (qualitative data)
Consists of names or labels that are not numbers representing counts of measurements
Discrete data
The result when a number of possible values is either a finite number or a “countable” number
Nominal
Characterized by data that consists of names, labels, or categories only. The data cannot be arranged in an ordering scheme (such as low to high)
Ordinal
Characterized by the data that can be arranged in some order, but differences between data values either cannot be determined or are meaningless
Interval
Characterized by data like the ordinal level, but with the additional property that the difference between any two data values is meaningful. Data at this level does not have a natural zero starting point (where none of the quantity is present) think like years
Ratio
Characterized by data like the interval level, but with the additional property that there is also a natural zero starting point (where zero indicated that none of the quantity is present). For values at this level, differences and ratios are both meaningful. (Think college textbooks, $0 is no cost, $100 is twice $50)
Continuous (numerical) data
The result from infinitely many possible values that correspond to some continuous scale that covers a range of values without gaps, interruptions, or jumps
Observational study
When we observe and measure specific characteristics, but we don’t attempt to modify the subjects being studied
Experiment
When we apply some treatment and then proceed to observe its effects on the subjects
Random sample
Members from the population are selected in such a way that each individual member in the population has an equal chance of being selected
Systematic sample
We select some starting point and then select every kth element in the population
Convenience
We simple use results that are very easy to get
Stratified
Se subdivide the population into at least two different subgroups (or strata) so that the subjects within the same subgroup share the same characteristic, then we draw a sample from each subgroup
Cluster
We first divide the population area into sections then randomly select some of the clusters, and then choose all the members from those clusters
Frequency Distribution (frequency Table)
Shows how a data set is partitioned among all the several categories by listing all of the categories along with the number of data values in each of the categories
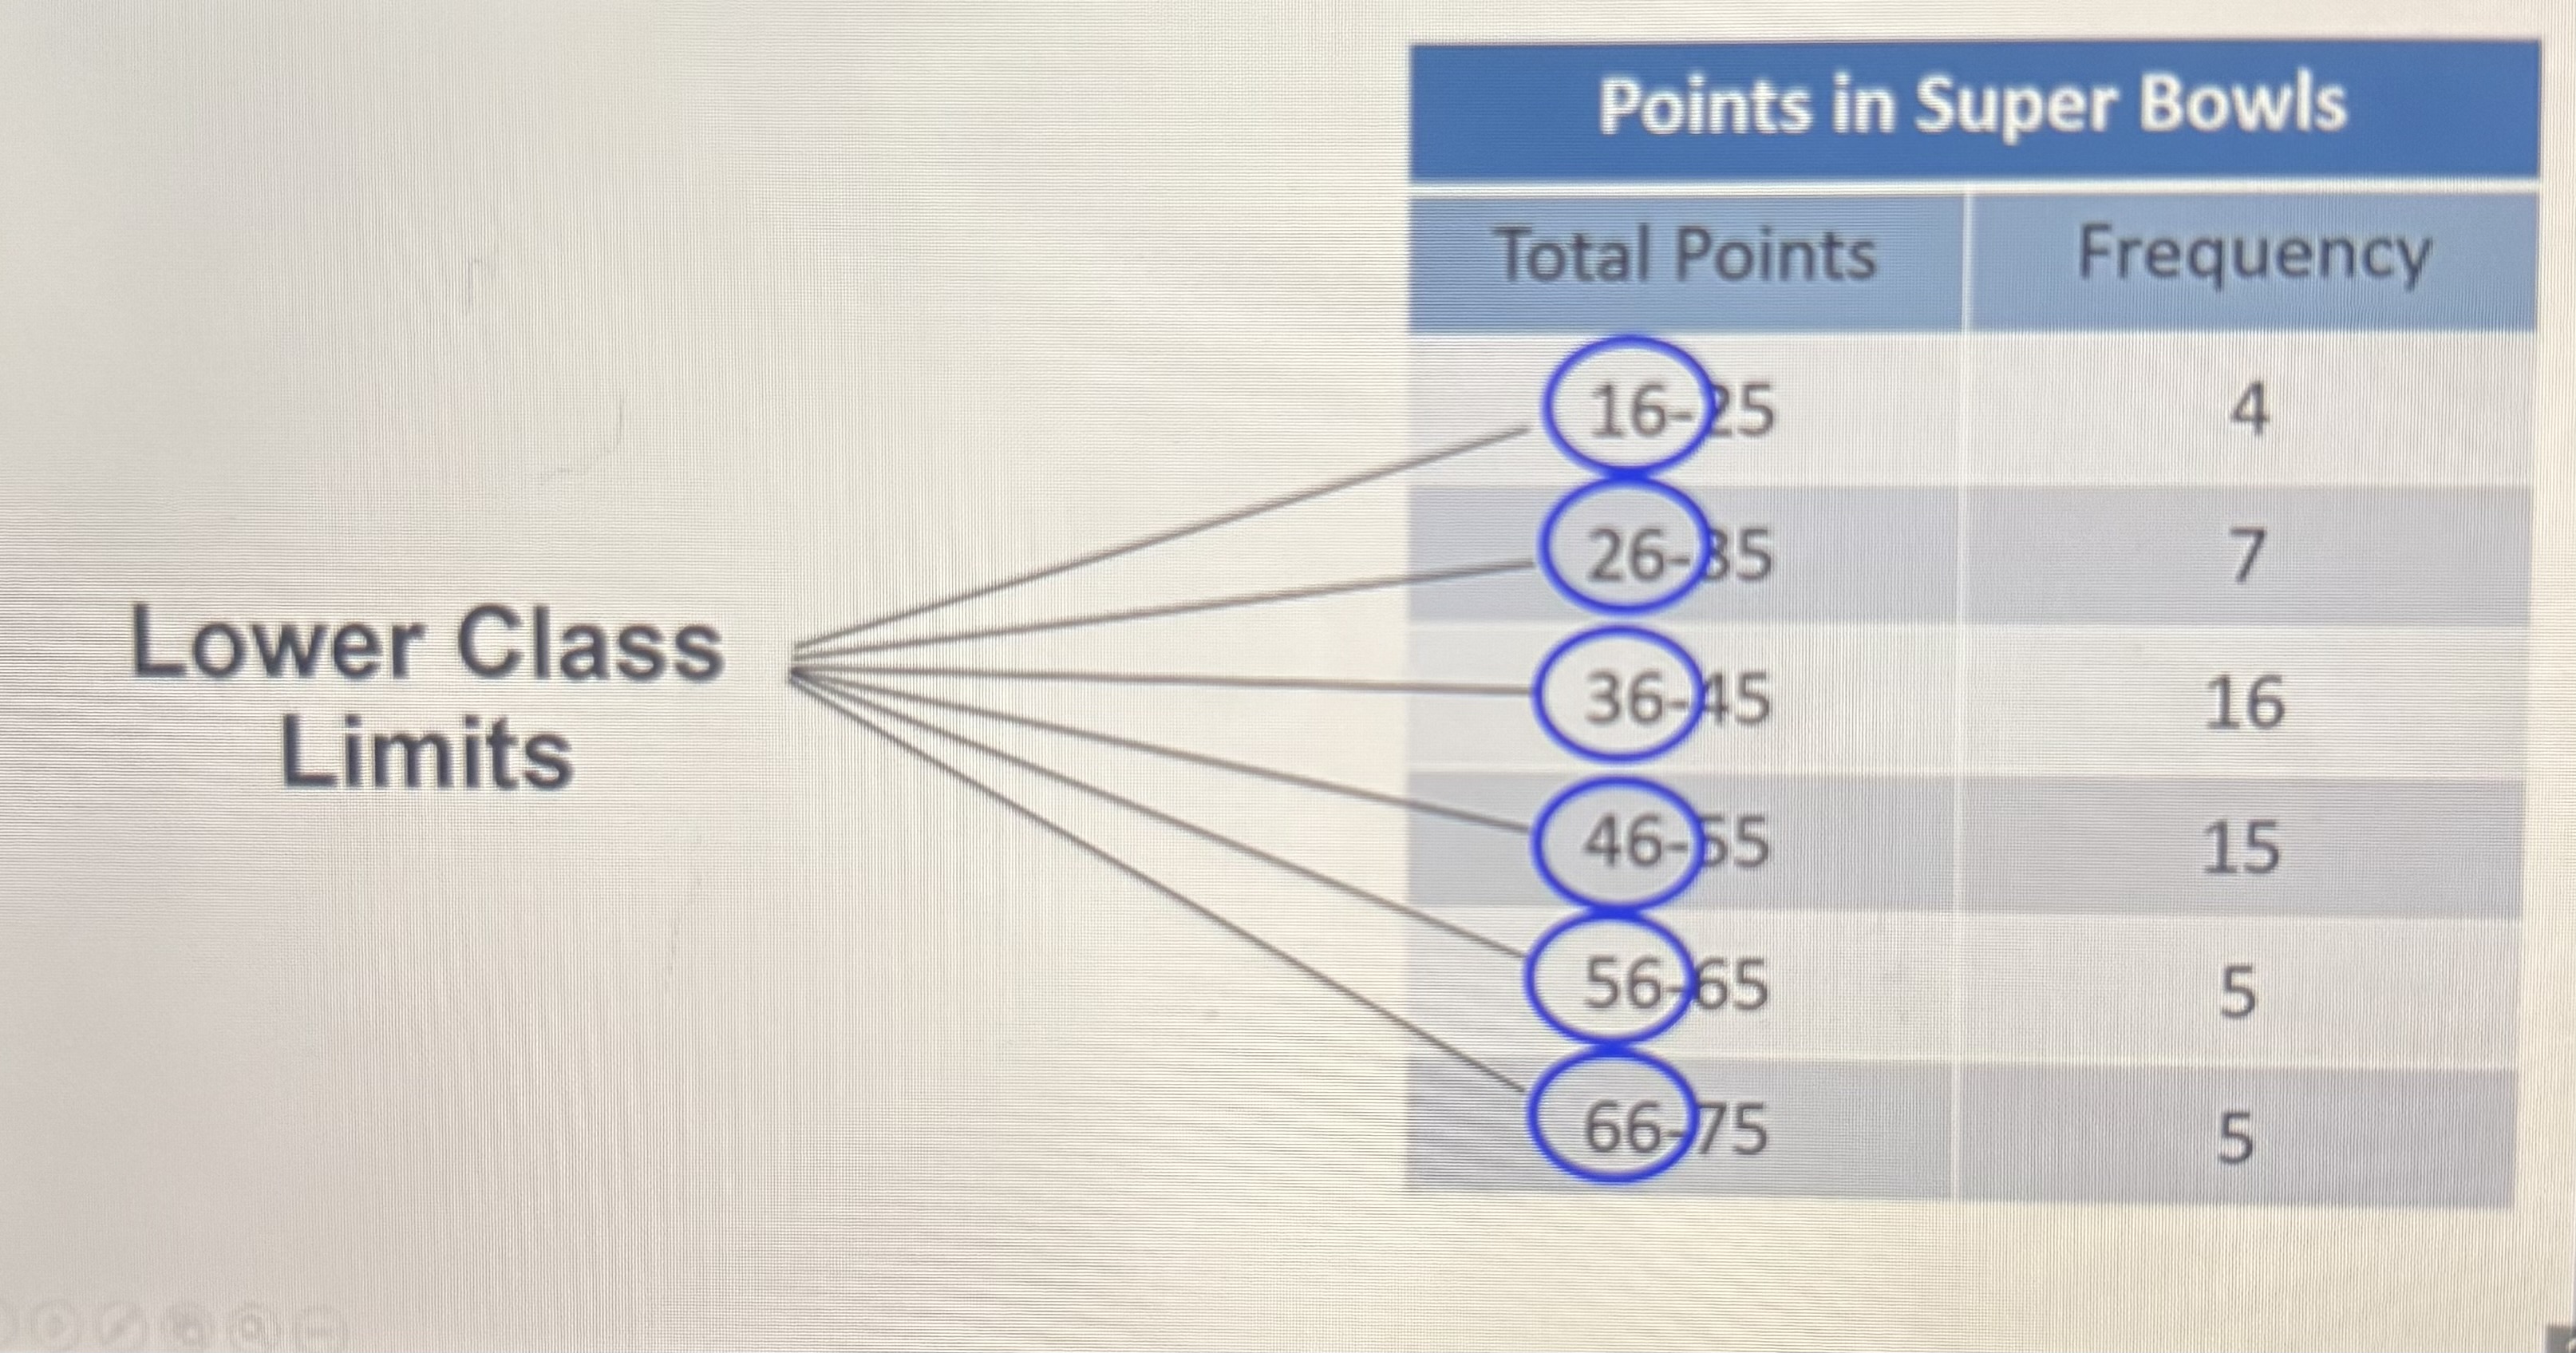
Lower Class Limits
Smallest numbers that can belong to different classes
Upper class limits
Highest number that can belong to a class
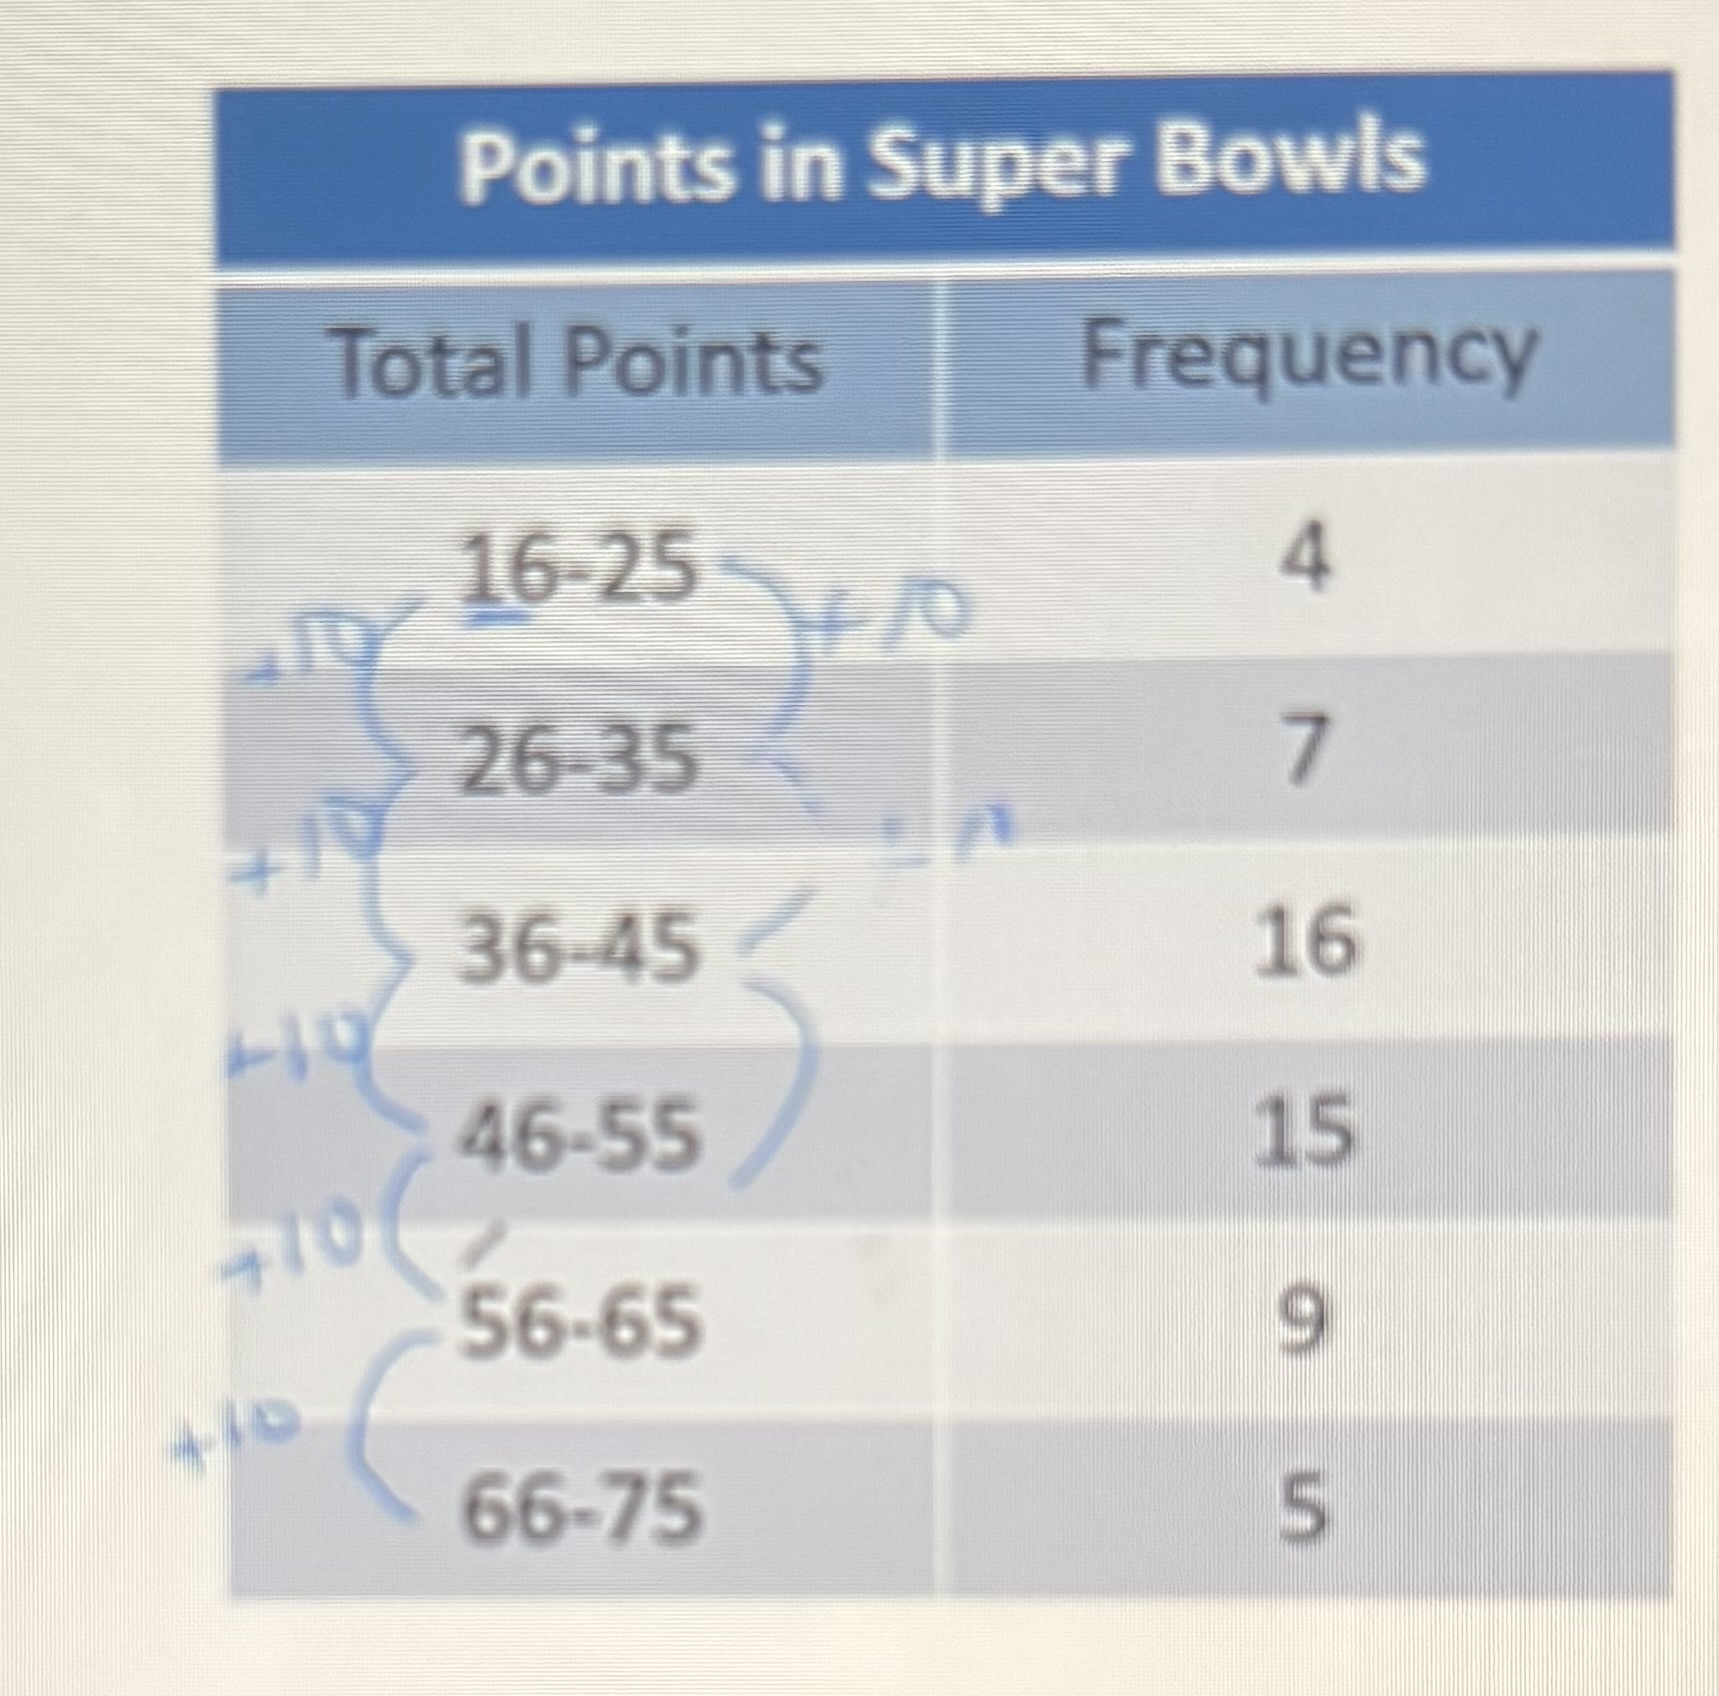
Class width
Difference between two consecutive lower class limits or two consecutive lower class boundaries
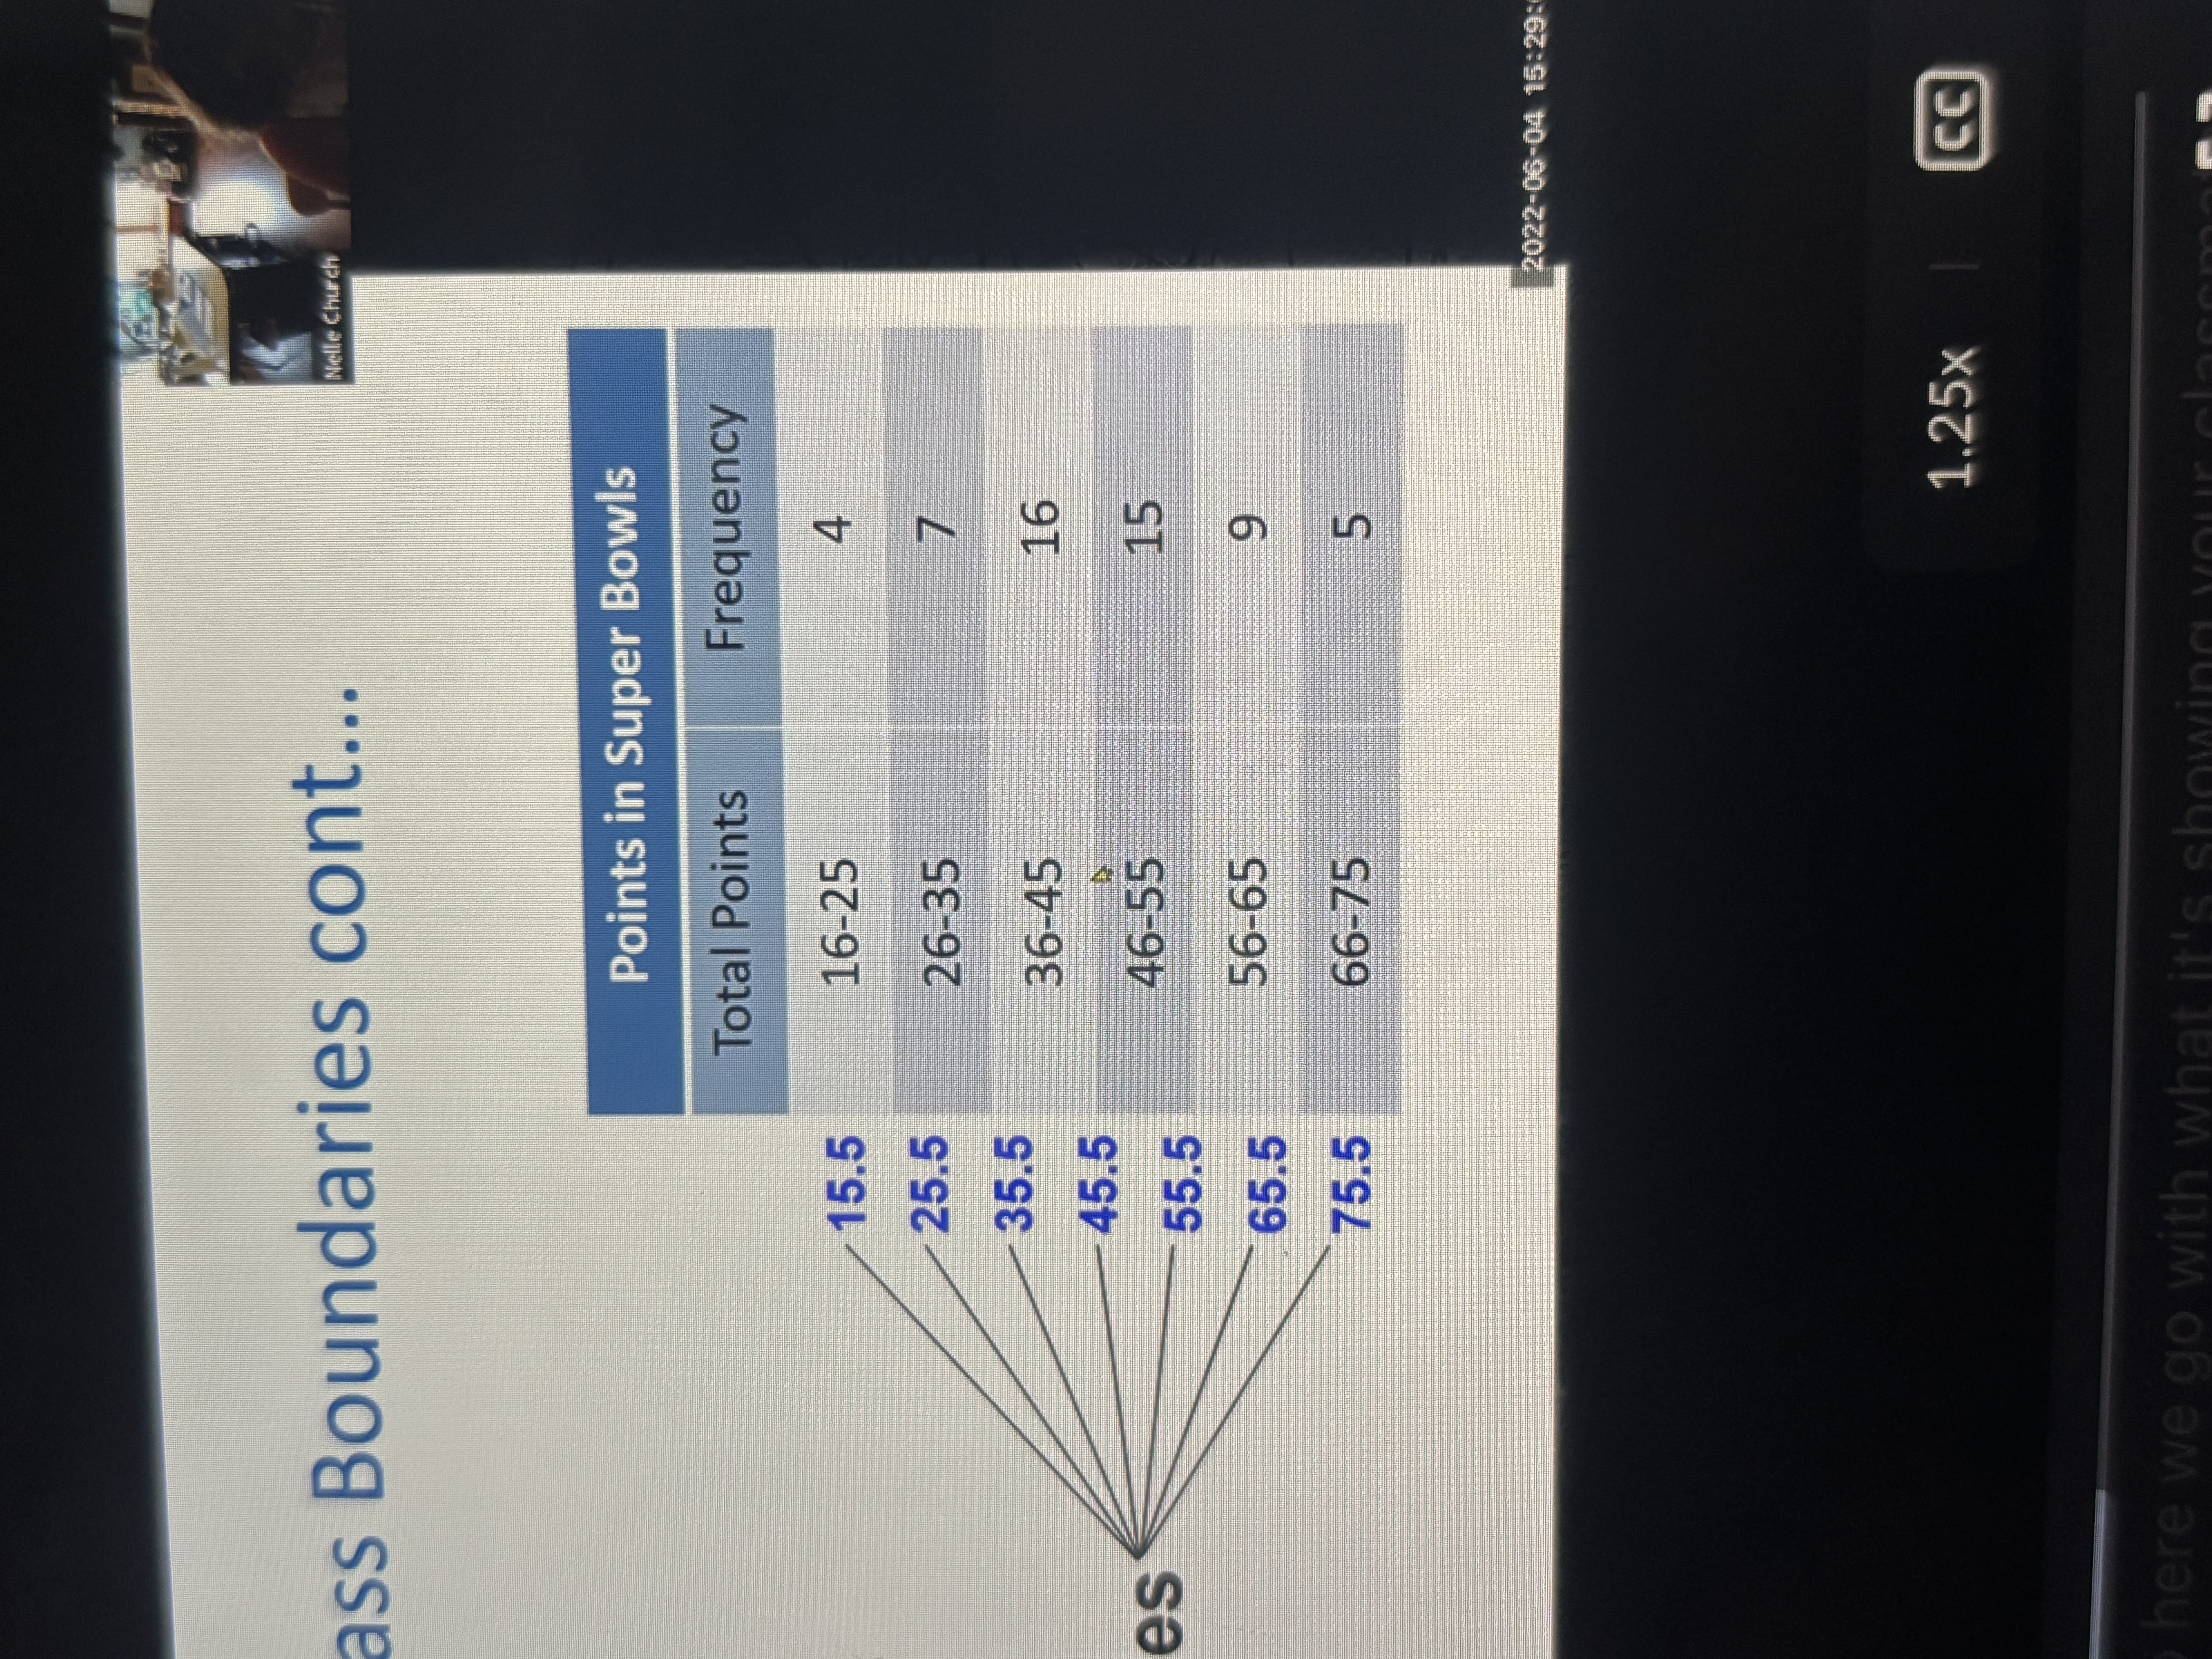
Class boundaries
Halfway between different frequency distributions
Class midpoints
Values in the middle of the classes and can be found by adding the lower class limits to the upper class limit and dividing the sum by 2
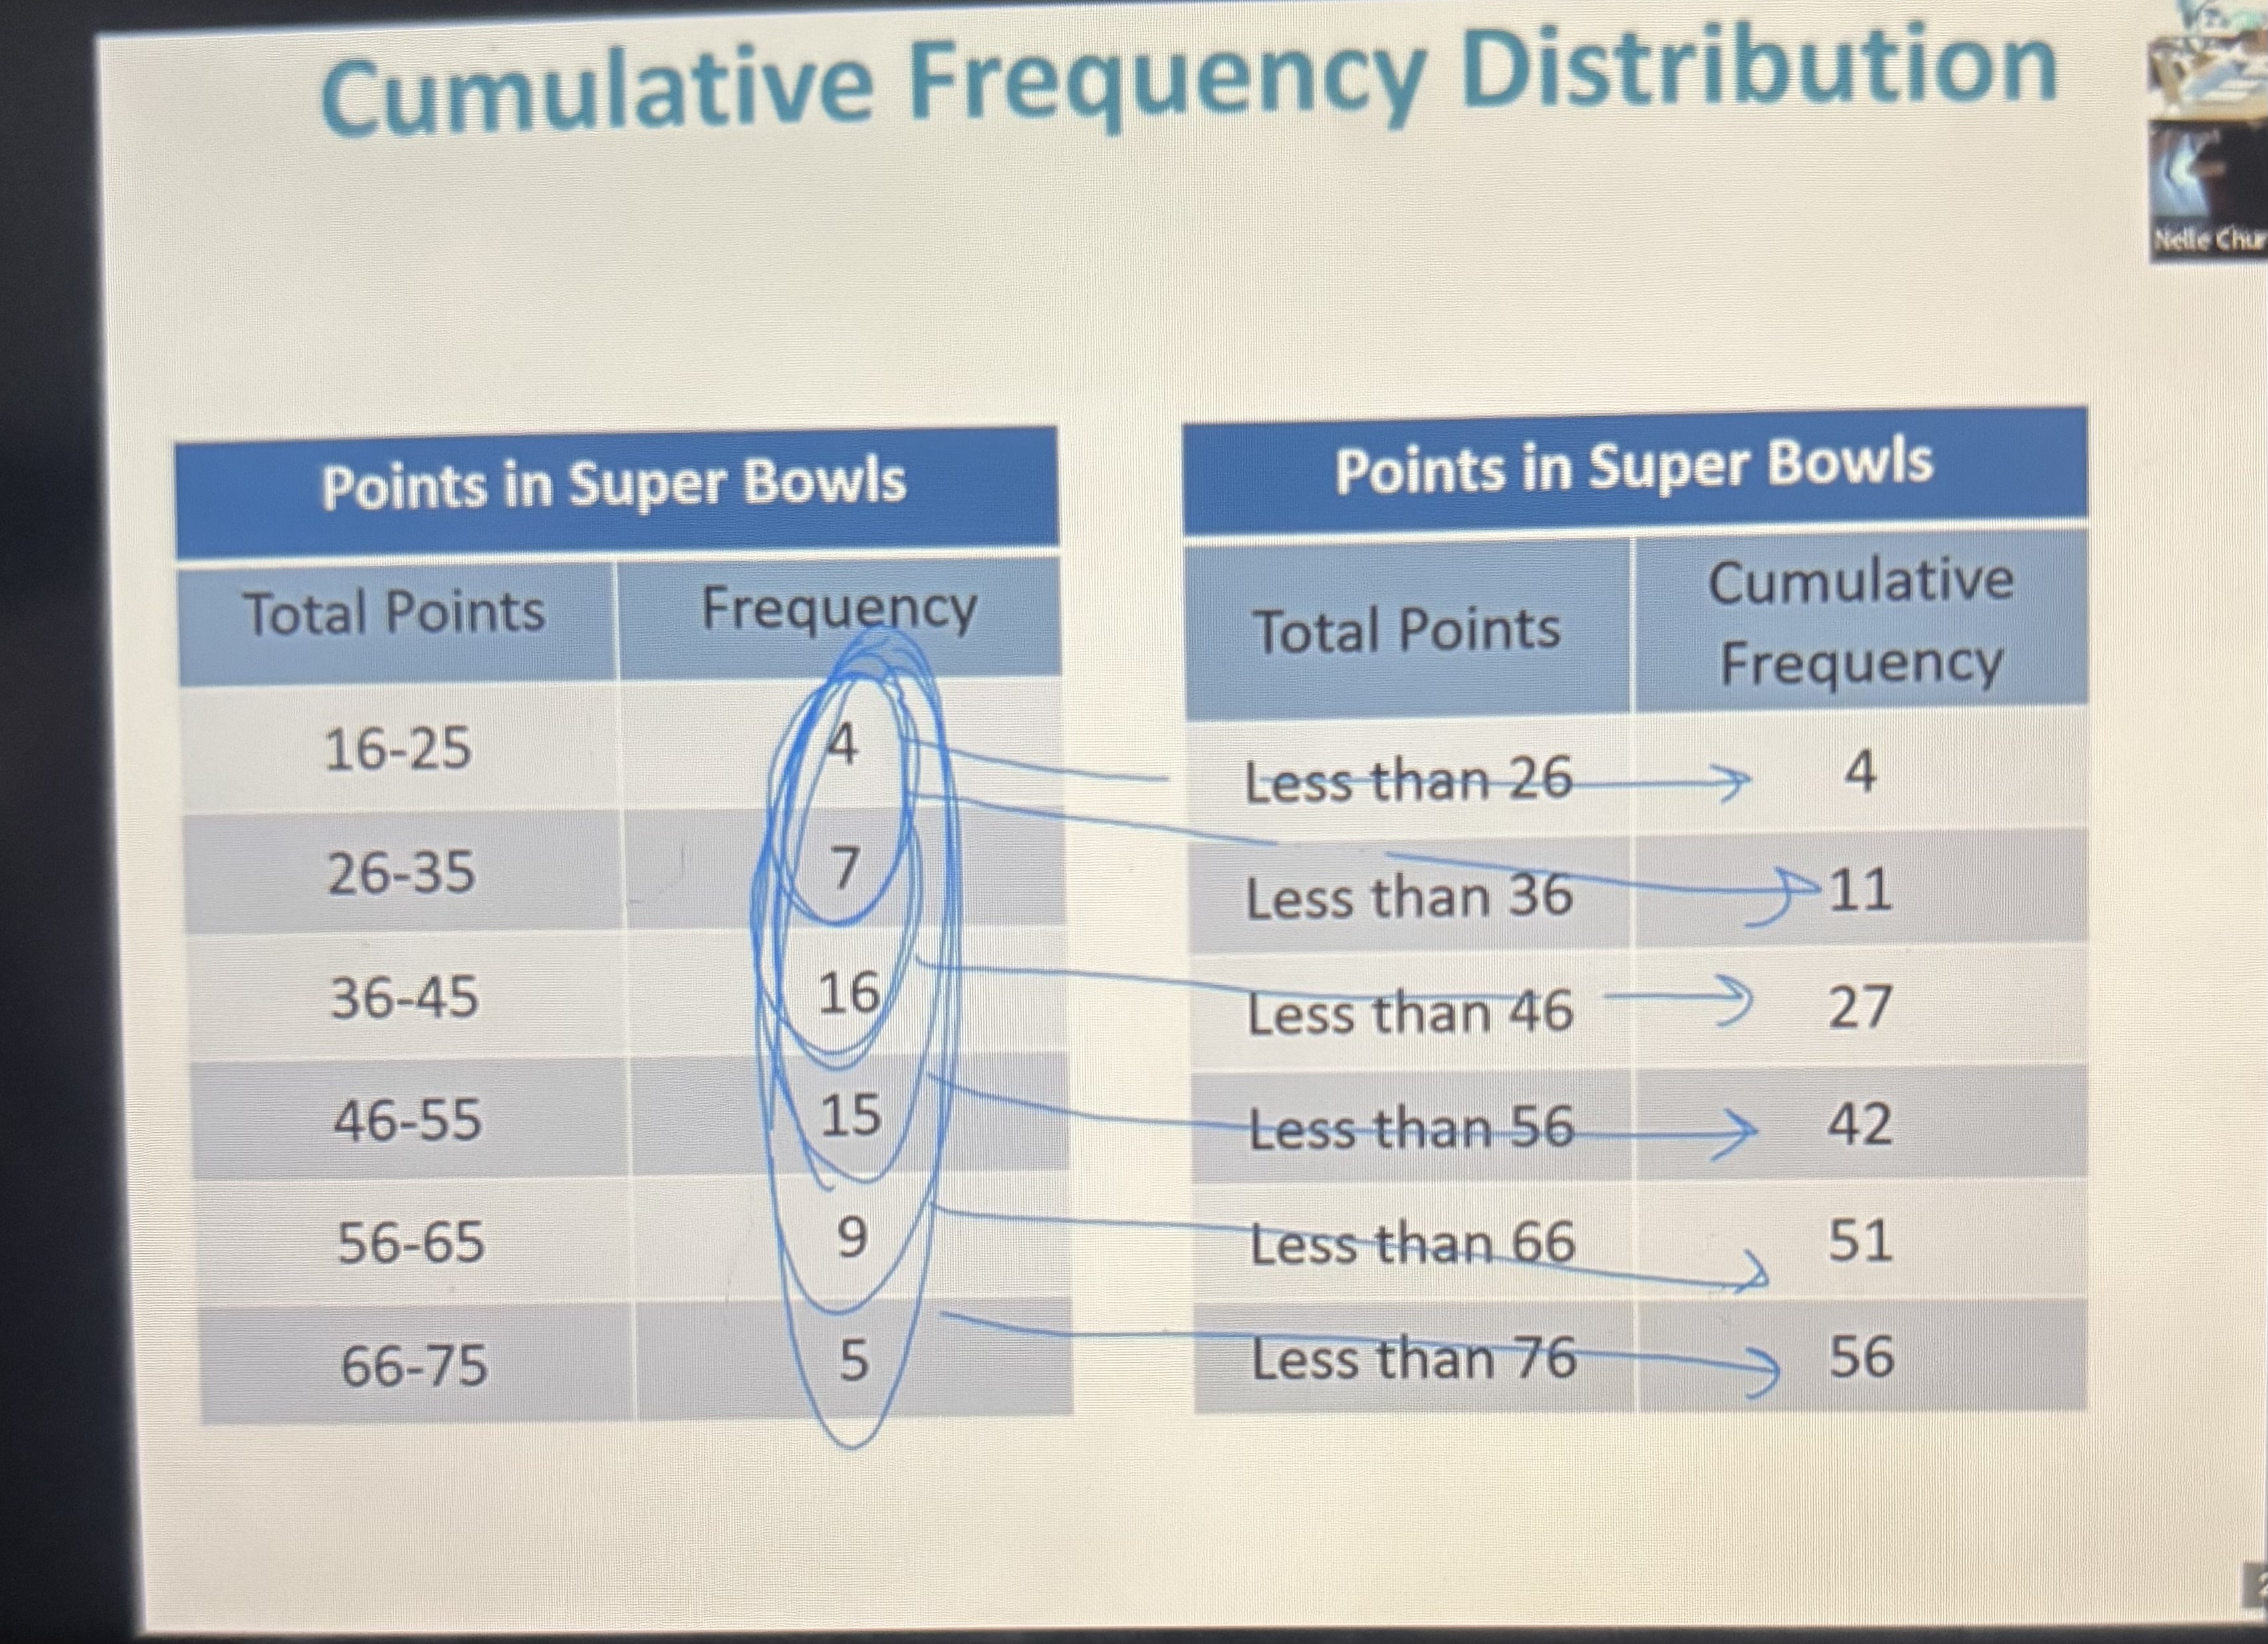
Cumulative frequency
The cumulative frequency for a class is the sum of the frequencies for that class and all previous classes