P2: Proteomics Acquisition Methods and Data Analysis
1/22
There's no tags or description
Looks like no tags are added yet.
Name | Mastery | Learn | Test | Matching | Spaced | Call with Kai |
|---|
No analytics yet
Send a link to your students to track their progress
23 Terms
Data acquisition in Mass Spec
Linking the results from the M1 to the results of the M2
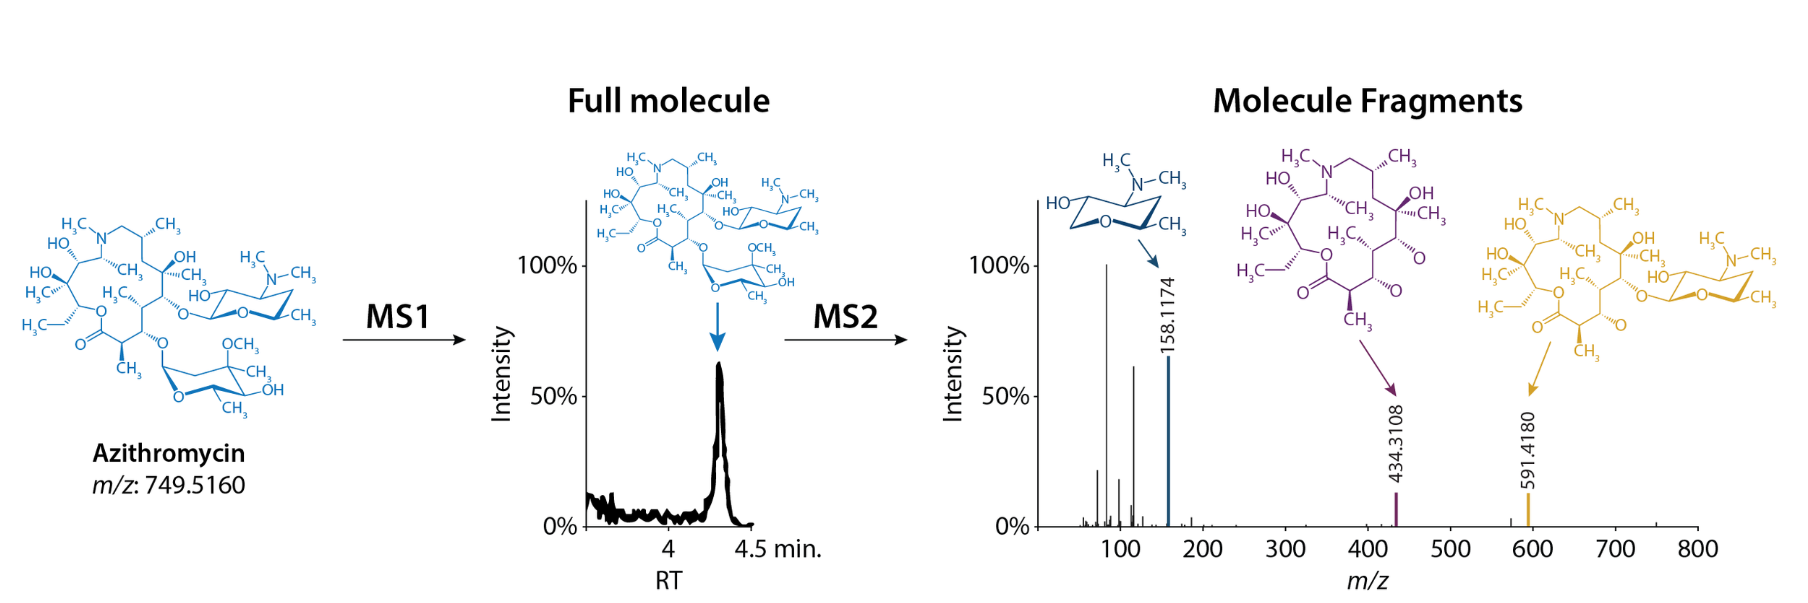
Outputs of M1 and M2
Output of M1 is a spectra of intensity vs mass to charge ratio (m/z). Each peak represents a peptide, with its corresponding m/z.
Output of M2 is a similar plot, except each peak correspond to a fragment ion of a specific peptide.
Why can’t MS2 analyse all peptides from MS1 scans?
Some peaks from MS1 scans may be from contaminants.
Often, several MS1 scans are performed as we have a flow of peptides coming into the mass spec, and they cannot all be into one MS1 scan. However, the same peptide may be in two different MS1 scan, and we do not want to analyse twice in MS2.
How does MS2 know which peaks from MS1 to analyse?
There are two main techniques:
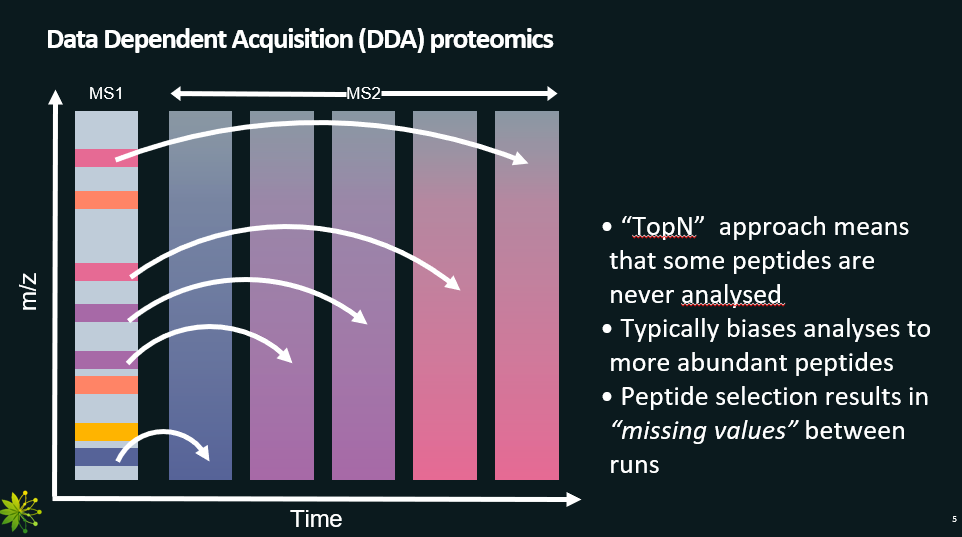
Data Dependent Acquisition (DDA): selects the most abundant peptides from the MS1 scans. Called data dependent because the MS2 scans depend on the data from the MS1 scans.
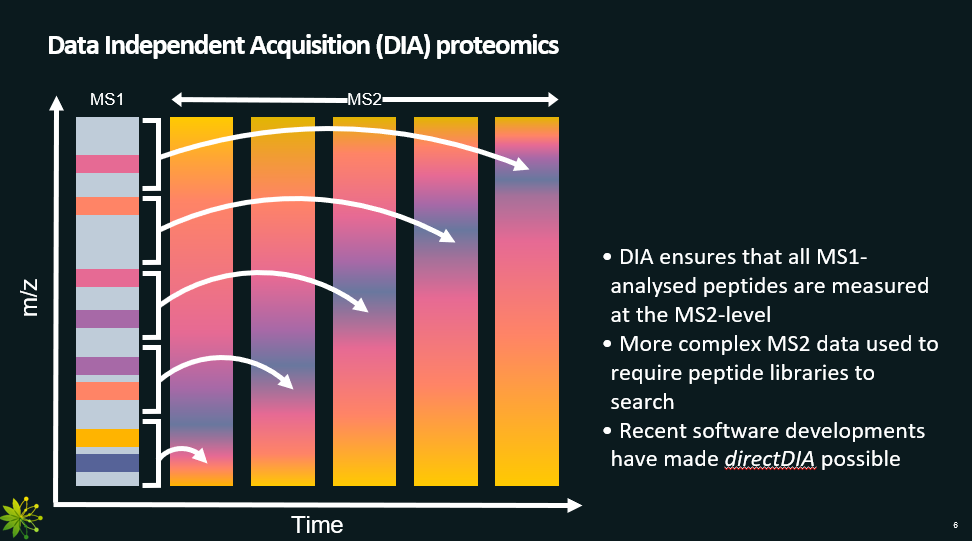
Data Independent Acquisition (DIA): MS2 scans do not depend on MS1 scans. For each MS2 scan, a set of peptides (peaks) from the MS1 scan are selected (going up from lower to higher m/z). Thus, the MS2 scan contains information about several peptides.
Data Dependent Acquisition, with pros and cons.
technique that selects the most abundant peptides from the MS1 scans for the MS2.
In the graph, darker colours mean higher intensity.
Pros:
Simple
We can assume that all peaks in MS2 scan correspond to one peptide.
Cons:
Bias towards the higher abundance peptides.
When doing experiments where the protein concentrations change over time, we might miss important data (missing value problem).
Data Independent Acquisition, with pros and cons.
This method addresses the main limitation of the Data Dependent Acquisition, as it analyses all peptides from MS1, not just the most abundant ones.
Pros:
Analyses all peptides from MS1 (no bias towards high abundance ones).
Cons:
A MS2 scan has ions from different peptides (number depends on the window used). Thus, further analysis needed to figure out to which peptide each peak belongs to.
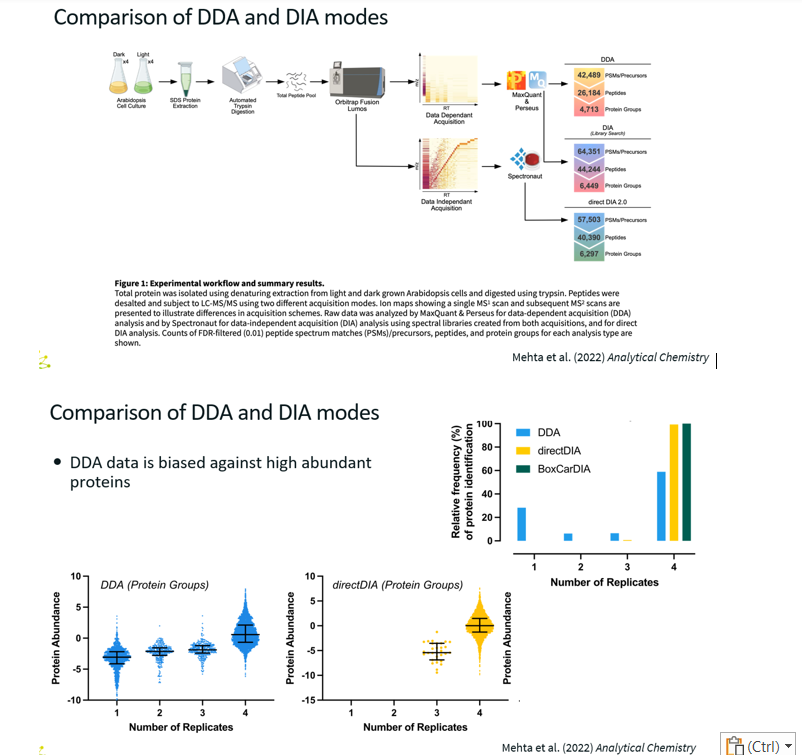
Comparison Study of DDA and DIA methods
No need to know difference between the two DIA methods.
Same sample used for all replicates
For DDA, only 60% of the peptides were found in all four replicates.
For DIA, 100% of the peptides were found in all four replicates.
The bottom graphs shows that for DDA, the proteins detected in only 1 out of the four samples are the lowest abundance proteins, which makes sense for DDA.
Broadly, how do we get peptide sequences from the MS2?
Two data analysis methods:
De Novo Sequencing (older, more laborious)
Database Searching (newer, computational)
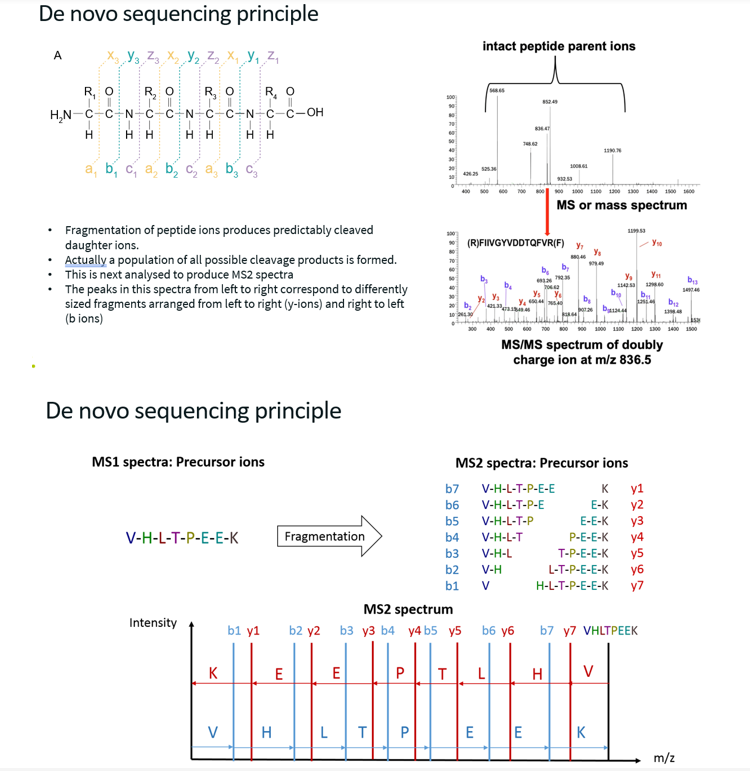
Explain the De Novo Sequencing Principle, with challenges associated with it.
How does it work?
Consider one peptide, which has been fragmented into b and y ions (obtained through collision-induced dissociation, break is at the peptide bond). Ideally, this peptide has been broken up into every possible fragment pattern.
In this case, when observing the MS2 spectra, distance between two b ions/peaks or two adjacent y ions/peaks (Δm/z) corresponds to the mass to charge (m/z) of one amino acid. The heavier of the two fragments has one additional amino acid compared to the lighter one, and this amino-acid has a mass to charge ration equal to Δm/z. Since we know the m/z of every amino acid, we can deduce what this amino acid (which is in the heavier fragment but not the lighter one) is. Thus, by analysing the Δm/z between each adjacent b peaks or each adjacent y peaks, we can deduce the peptide sequence.
Challenges:
Only works if we have perfect fragmentation (i.e. all possible fragmentation patterns). If there is no perfect fragmentation, there will be gaps in the amino acid sequence. This can be solved by repeating the analysis and hoping to fill in the gaps.
MS2 must contain only one peptide. Thus, this method does not work well for DIA.
Amino acids with the same mass to charge ratio cannot be distinguished (e.g. leucine and isoleucine).
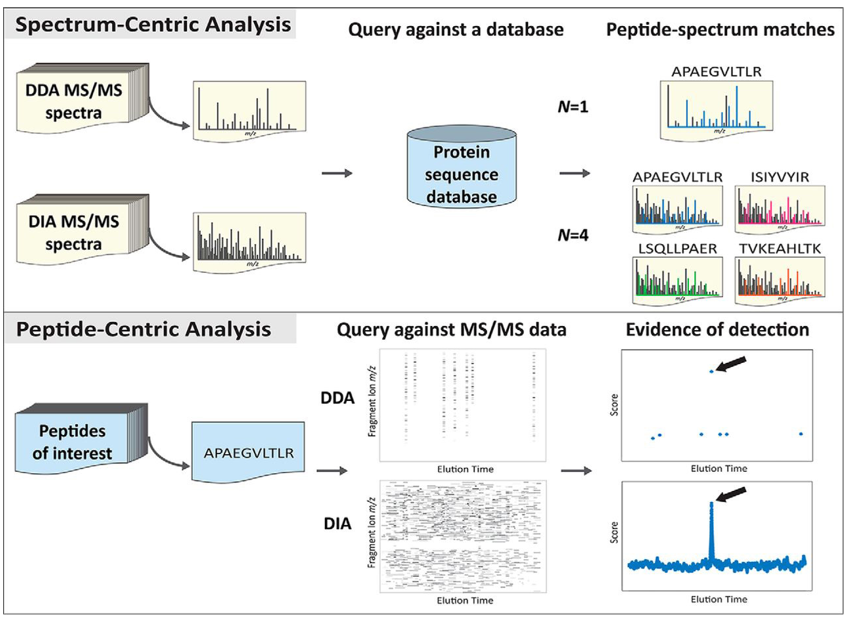
Explain the database searching methods
What?
Newer method used to identify sequence from MS2 spectra.
How?
Two main ways to do it:
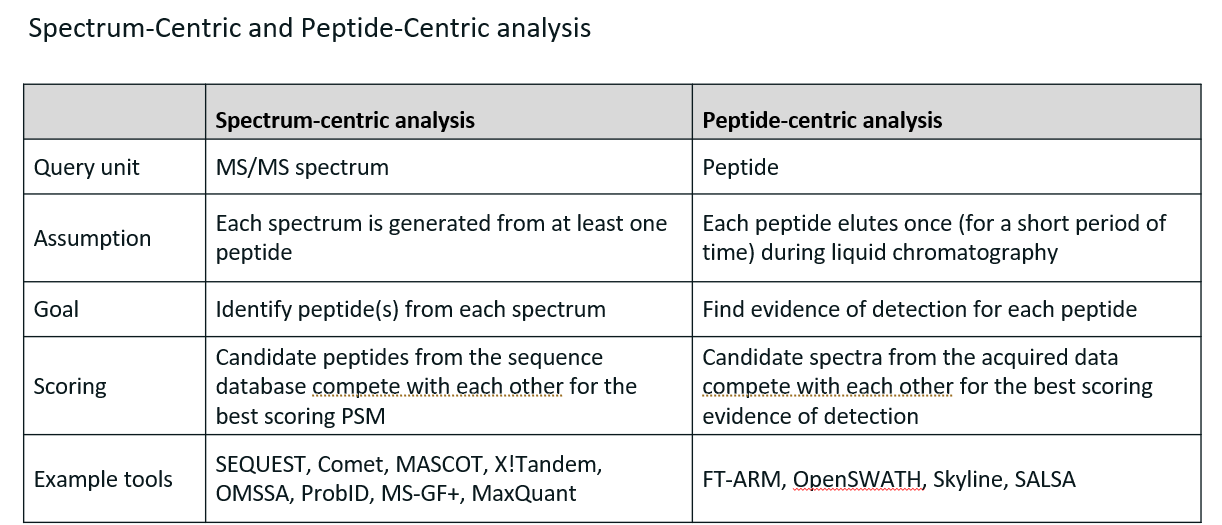
Spectrum-centric analysis: the mass spectrometer generates MS2 spectra from peptide ions. Each spectrum is compared to theoretical spectra generated in silico from a protein database. Each match between an observed spectrum and a theoretical spectrum is scored.
Peptide-centric analysis: more often used when trying to find particular peptides in sample. Consists in only looking for the particular pattern of those peptides. This is done by comparing experimental spectra with reference fragmentation patterns in database.
In which case is De Novo Sequencing used over database searching?
When we don’t know from which organism our proteins come from.
PSM
Peptide spectrum match.
Assignment of an MS/MS spectrum to a specific peptide sequence. It represents a hypothesis that the observed spectrum was generated by fragmentation of that peptide.
During database search:
Each MS/MS spectrum is compared against theoretical spectra from peptides in a protein database.
A scoring algorithm (like XCorr, Andromeda score, etc.) ranks possible matches.
The best-scoring peptide is selected as the PSM for that spectrum.
Compare spectrum-centric and peptide-centric analysis.
Explain Hybrid Analysis
Hybrid analysis in mass spectrometry-based proteomics refers to approaches that combine elements of both spectrum-centric and peptide-centric analysis to improve peptide identification and quantification.
Cycle time
Time it takes for mass spec to go from MS1 to next MS1.
Quantitative Proteomics
Quantitative proteomics is a field within proteomics that focuses on measuring the abundance of proteins in biological samples to understand differences across conditions, such as disease vs. control, treated vs. untreated, or time-course studies.
Two main techniques for quantitative proteomics
Label free quantitation
Labelling:
Metabolic labelling (e.g. SILAC)
Isobaric tags (e.g. Tandem mass tags)
What is the main challenge encountered in quantitative proteomics?
When doing quantitative proteomics, we want to compare the amount of certain proteins in different samples. However, when doing an experiment with several samples, we end up with peptides from different samples in our spectra. The challenge is to figure out from which sample each peptide comes from.
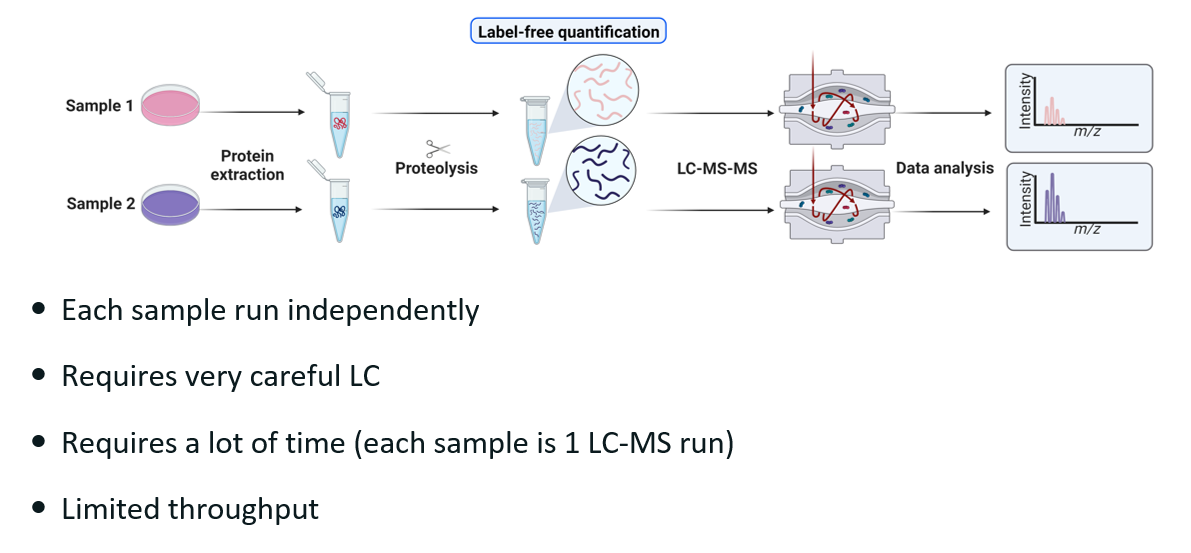
Explain label free quantitation (LFQ) and its drawbacks.
In label free quantitation, we inject samples sequentially.
Drawbacks:
If we are comparing two samples, then we have two mass spec run instead of one. However, in practice, there are usually many samples. This usually means that a compromise has to be made on how long each mass spec run can be, which in turn decrease the amount of peptide we can identify in each run —> limited throughput.
There can be contamination between each sample loading. This can be mitigated by running very careful liquid chromatography and by randomising the loading so that each sample has the same bias.
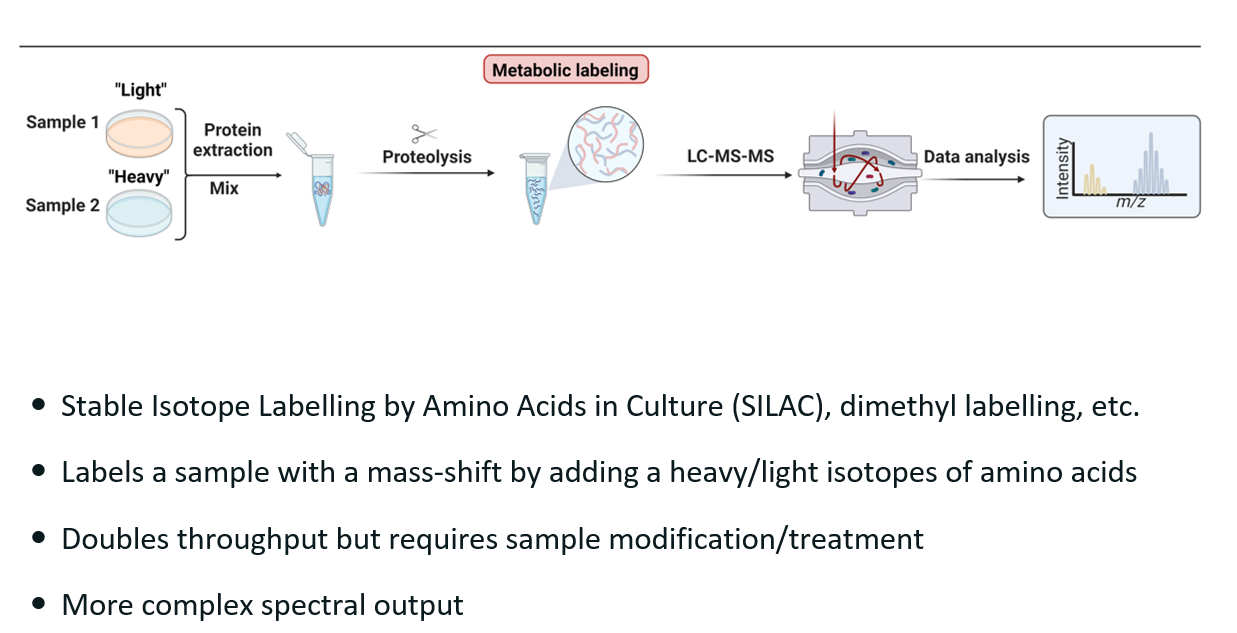
SILAC
What?
Stable Isotope Labelling by Amino Acids in Culture.
Type of metabolic labelling.
How does it work?
Replace an amino-acid in one of the sample with a heavy isotope. Thus, we have a “heavy” and a “light” sample.
Both samples are mixed and inputted in the mass spec together.
In the MS2 spectra, we see two groups of peptides due to the mass shift, thus allowing to easily distinguish the two samples in the result.
Pros:
Can run TWO samples at the same time, thus saving time.
Cons:
More complex spectra.
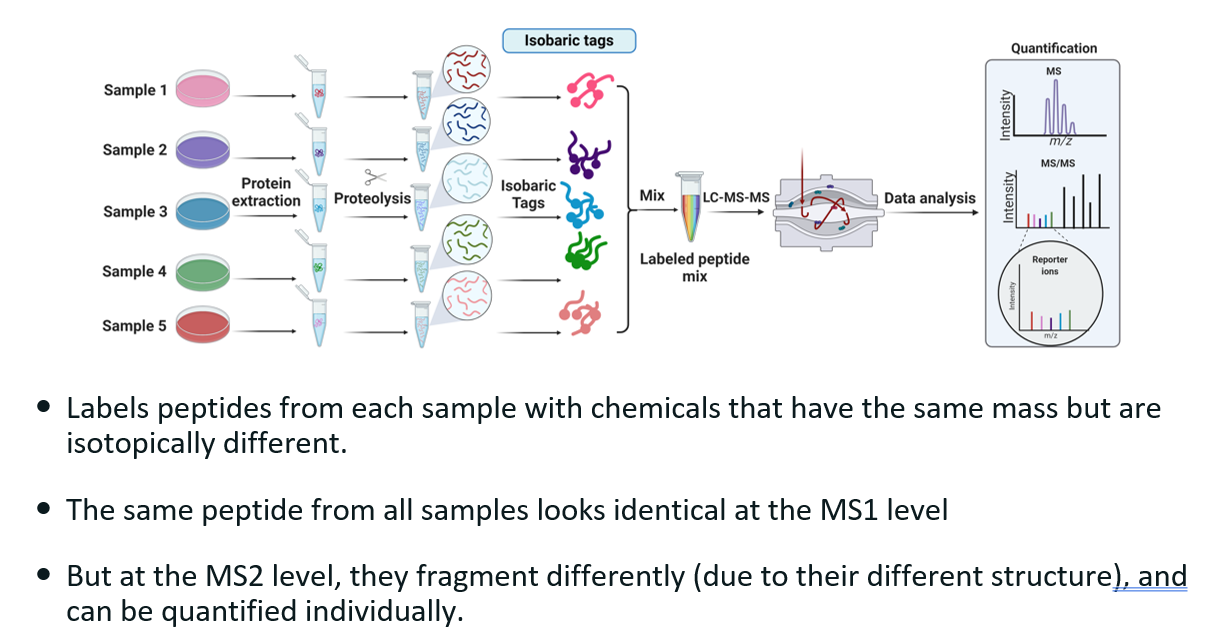
Explain isobaric tags and how they are used in labelled quantitative proteomics.
What?
Isobaric tags are chemical labels used in quantitative proteomics to compare the relative abundance of proteins across different biological samples using mass spectrometry (MS). The term isobaric means "same mass".
How does it work?
The isobaric tags have the same mass but different structures, leading to different fragmentation patterns.
Labeling: Proteins from different conditions (e.g., treated vs. control) are digested into peptides and each is labeled with a different isobaric tag.
Mixing: The labeled peptide samples are mixed into a single pool.
Liquid chromatography
MS1 Scan: In the first stage of mass spectrometry (MS1), all labeled peptides appear as a single peak because the isobaric tags make them the same mass.
MS/MS Scan: During MS2, the different structures of the tags lead to different fragmentation patterns. Each tag releases a unique reporter ion (different m/z). These reporter ions are quantified to determine relative abundance of peptides in each sample.
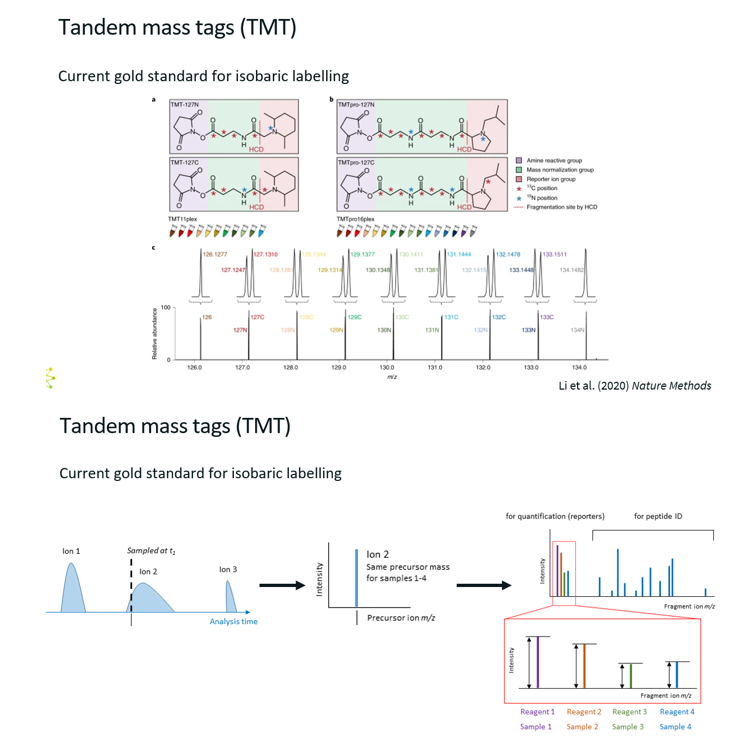
Tandem Mass Tags
What?
Most popular version of isobaric labelling.
Tandem mass tags are chemical labels with the same mass (isobaric), but who release different reported ions during MS2 fragmentation.
How does it work?
Labelling:
Digest proteins from each sample into peptides.
Label each sample with a different TMT reagent.
Mixing & MS1:
Combine all labelled samples into one tube.
In MS1, all peptides appear to have the same mass because the tags are isobaric.
MS/MS (MS2)
Peptides are fragmented.
Each tag releases a reporter ion with unique m/z (e.g., 126–131).
The intensity of these reporter ions reflects the relative abundance of the peptide in each sample.
Interpreting the results?
In the MS2, we have peaks corresponding to peptide fragments of one peptide. The reporter ions give the abundance of that one peptide in each of the four samples.
Thus, the right part of the MS2 is only used to get the sequence of the sequence, and the left part is used for quantification.
Pros:
Compared to SILAC, which doubles the throughput, this can go as far as multiplying the throughput by 32.
Cons:
Expensive
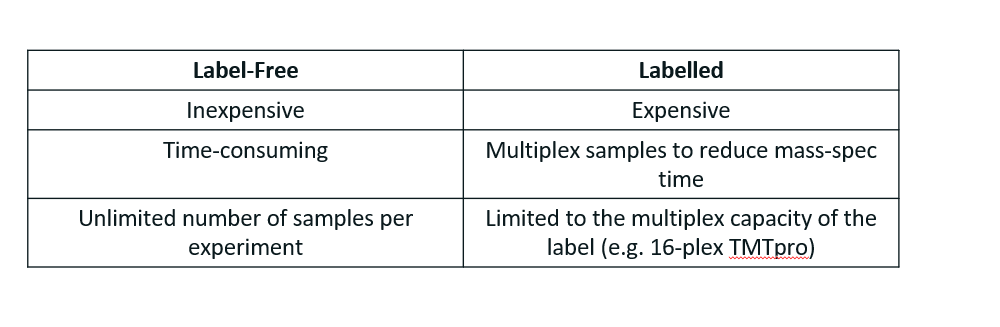
Comparison of label-free and labelling quantitative proteomics
TMT is superior to SILAC due to the massive throughput increase. However, with improvement in mass spec technology, mass spec runs are becoming shorter and shorter, meaning that label-free becomes more attractive since the time constraint is not as bad, and it is very inexpensive compared to SILAC.