booklet 1 combined
1/51
There's no tags or description
Looks like no tags are added yet.
Name | Mastery | Learn | Test | Matching | Spaced |
|---|
No study sessions yet.
52 Terms
Fertility rates trends over time
decreased overall
Abortion Act 1968
Post war spike
1.62 kids per woman 2021
Increased 1.9% from 2020
Increased occurred in a regions apart from Londoners and the West Midlands
East England highest post-Covid 1.76 births per 1000 2023
Leeds - 1.32 births per 1000 2023
Bradford - 1.82 births per 1000
Bradford has high levels of poverty and a large young immigrant population
Internal immigration effects on population structure
to Leeds from small towns and cities (hull, York, middlesborough, Bradford)
11,400 from Leeds to London
16-21 net inflow of 50,000 (students)
22-25 net outflow of 30,000 (post graduate)
International immigration effects on population structure
London and SE have the most amount of international immigrants around 35%
London has 14% of UKs population + 35% of that are non UK born
From India , Poland, Pakistan, Romania (order of amount)
Due to expansion of EU and post colonial migration
Main reasons for migration
eu born - employment
Non eu born - family
Asylum seekers
how does the changing mix of ethnic groups effect characteristics of places?
immigrant enclaves have natural increase higher than native areas
how does the media effect characteristics of places?
globalisation + social media promote an international and homogeneous culture and lifestyle
Deep rooted in ‘western culture’
Emphasis on consumerism and consumption
Effects urban areas to become more urban
how does assimilation effect characteristics of places?
immigrants over several generations slowly lose their culture
However some parts of core culture will be replaced by immigrant culture
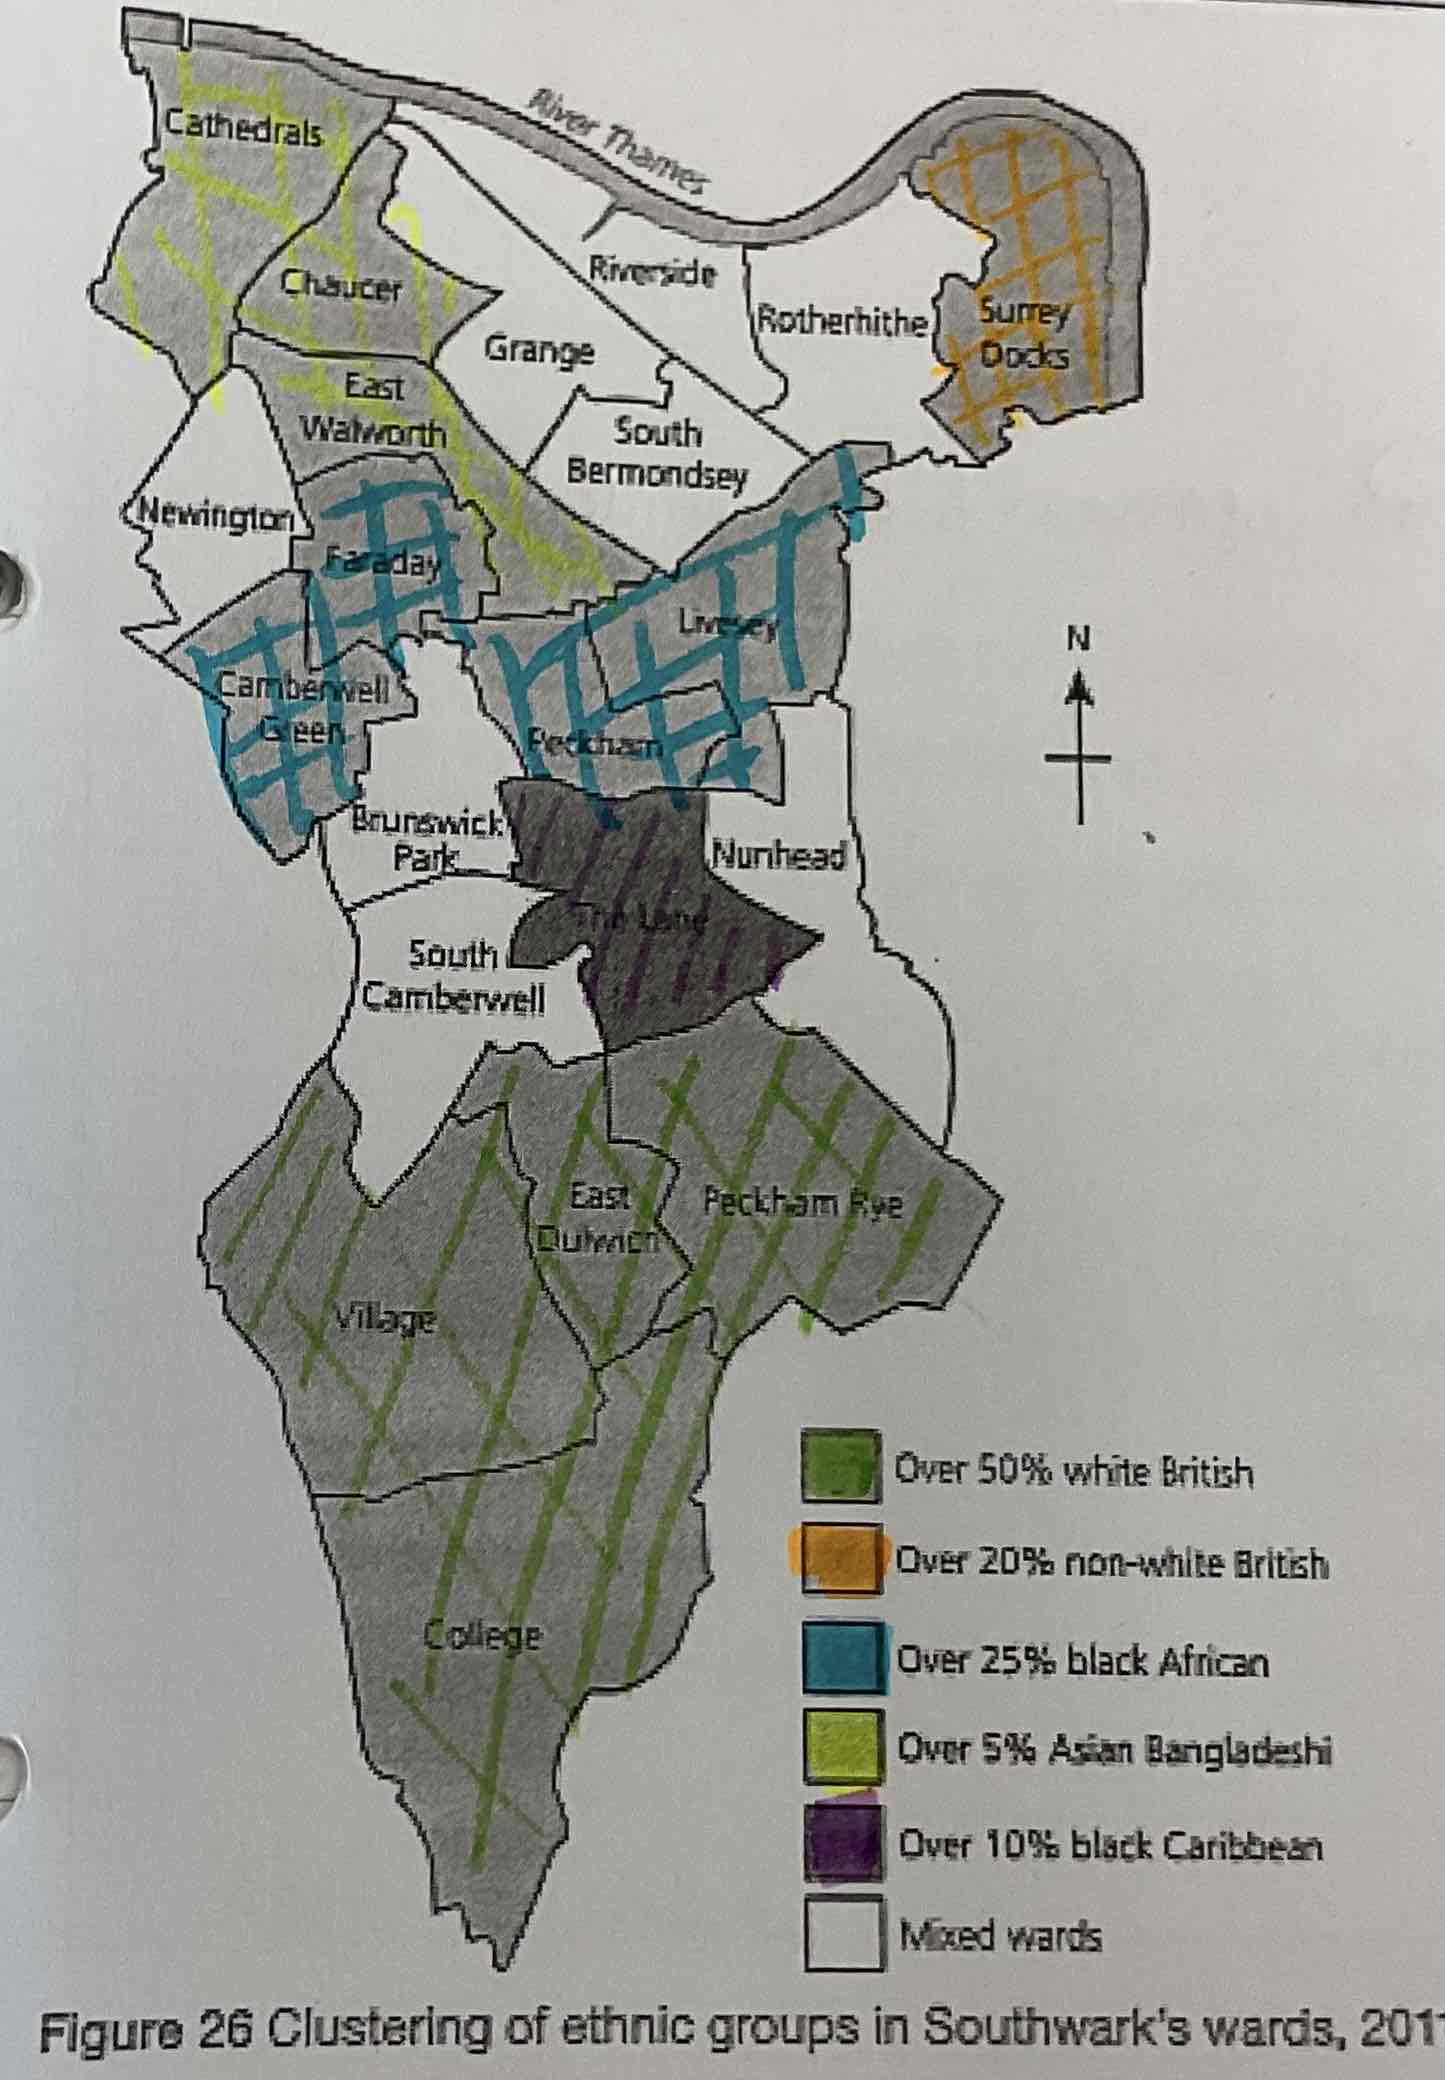
What is social clustering like in Southwark, London?
certain wards have higher-than-expected levels of concentrations of ethnic minorities
Riverside bought by wealthy European migrants
Wealthier white British people live in Southern wards
Lower income ethnic groups live in areas with council housing
10% of its residents change each year
Diversity changing rapidly
High fertility rates due to immigration population
How has government planning effected cultural diversity?
end of WW2 and British rule in India in 1947
Labour shortages led to overseas job ads
Empire windrush post 1948
Most of these immigrants settled in London
How has government anccessibility effected cultural diversity?
Pakistani people gained employment in textile mills in Lancashire
Remote areas had less job opportunities so less ethnic diversity
This created ethnic enclaves (concentrated areas of a particular ethnic group)
Facts about migration from labour shortages ?
1971 - 31% of doctors had qualified overseas
NHS hired 18,000 commonwealth citizens
Pakistani immigrants immigrated for low skill textile jobs
Bradford, Oldham, Dewsbury have high levels of Pakistani immigrants
What was the 1948 Nationality Act?
same citizenship status as those born in the UK
Free movement
What was the the 1971 Immigration act and why was it implemented?
ending the work permit scheme for commonwealth immigrants
Pitting them back on the same legal footing as other foreign nationals
Due to increasing negative attitudes towards immigration in the 1960s
What is ethnicity?
The cultural heritage shared by a group of people that sets them apart from others
What did the UK 2011 Census show?
86.0% white
7.5% Asian
80.5% white British
4.4% other white
How did the 2011 census differ from the 2001 census ?
1.4% less identify as white British
Less other white
% changed but proportion is the same
Increased immigration
What is social clustering ?
a form of segregation
All places have economic segregation
Ethnic segregation is a step beyond
Anglesey vs Southwark - what are the ethnic differences?
Anglesey - rural wales
98% white
96% white British
Southwark- central London
54% white
26% Black
9.5% Asian
Why is there ethnic differences between Southwark and Anglesey?
Anglesey is rural Wales so poor accessibility
More expensive property is not accessible for a lot of migrants
Southwark is near central London
Accessible for workers
Social clustering
what is the ethnic diversity like in Leeds?
on average with UK for most
Less non-uk nationals
Higher Irish population due to famine
Lower black but higher mixed population
Higher Pakistani population than average
more central
WW2 post war migration
Allyship
Cheap, industrial areas
what is the ethnic diversity like in Harehills & Gipton?
higher other white population
59.1% ethnic minorities
Pakistani make up 20% of the population
Higher Irish population than Leeds
what is the ethnic diversity like in Wetherby?
half the amount of non white than Leeds avg
Significantly less ethnic minorities
None more than 0.5%
What is the rural-urban continuum?
The gradual transition between urban and rural areas
Fewer services the more rural the area
Sequence of areas
CBD - secondary city - town - villages - rural
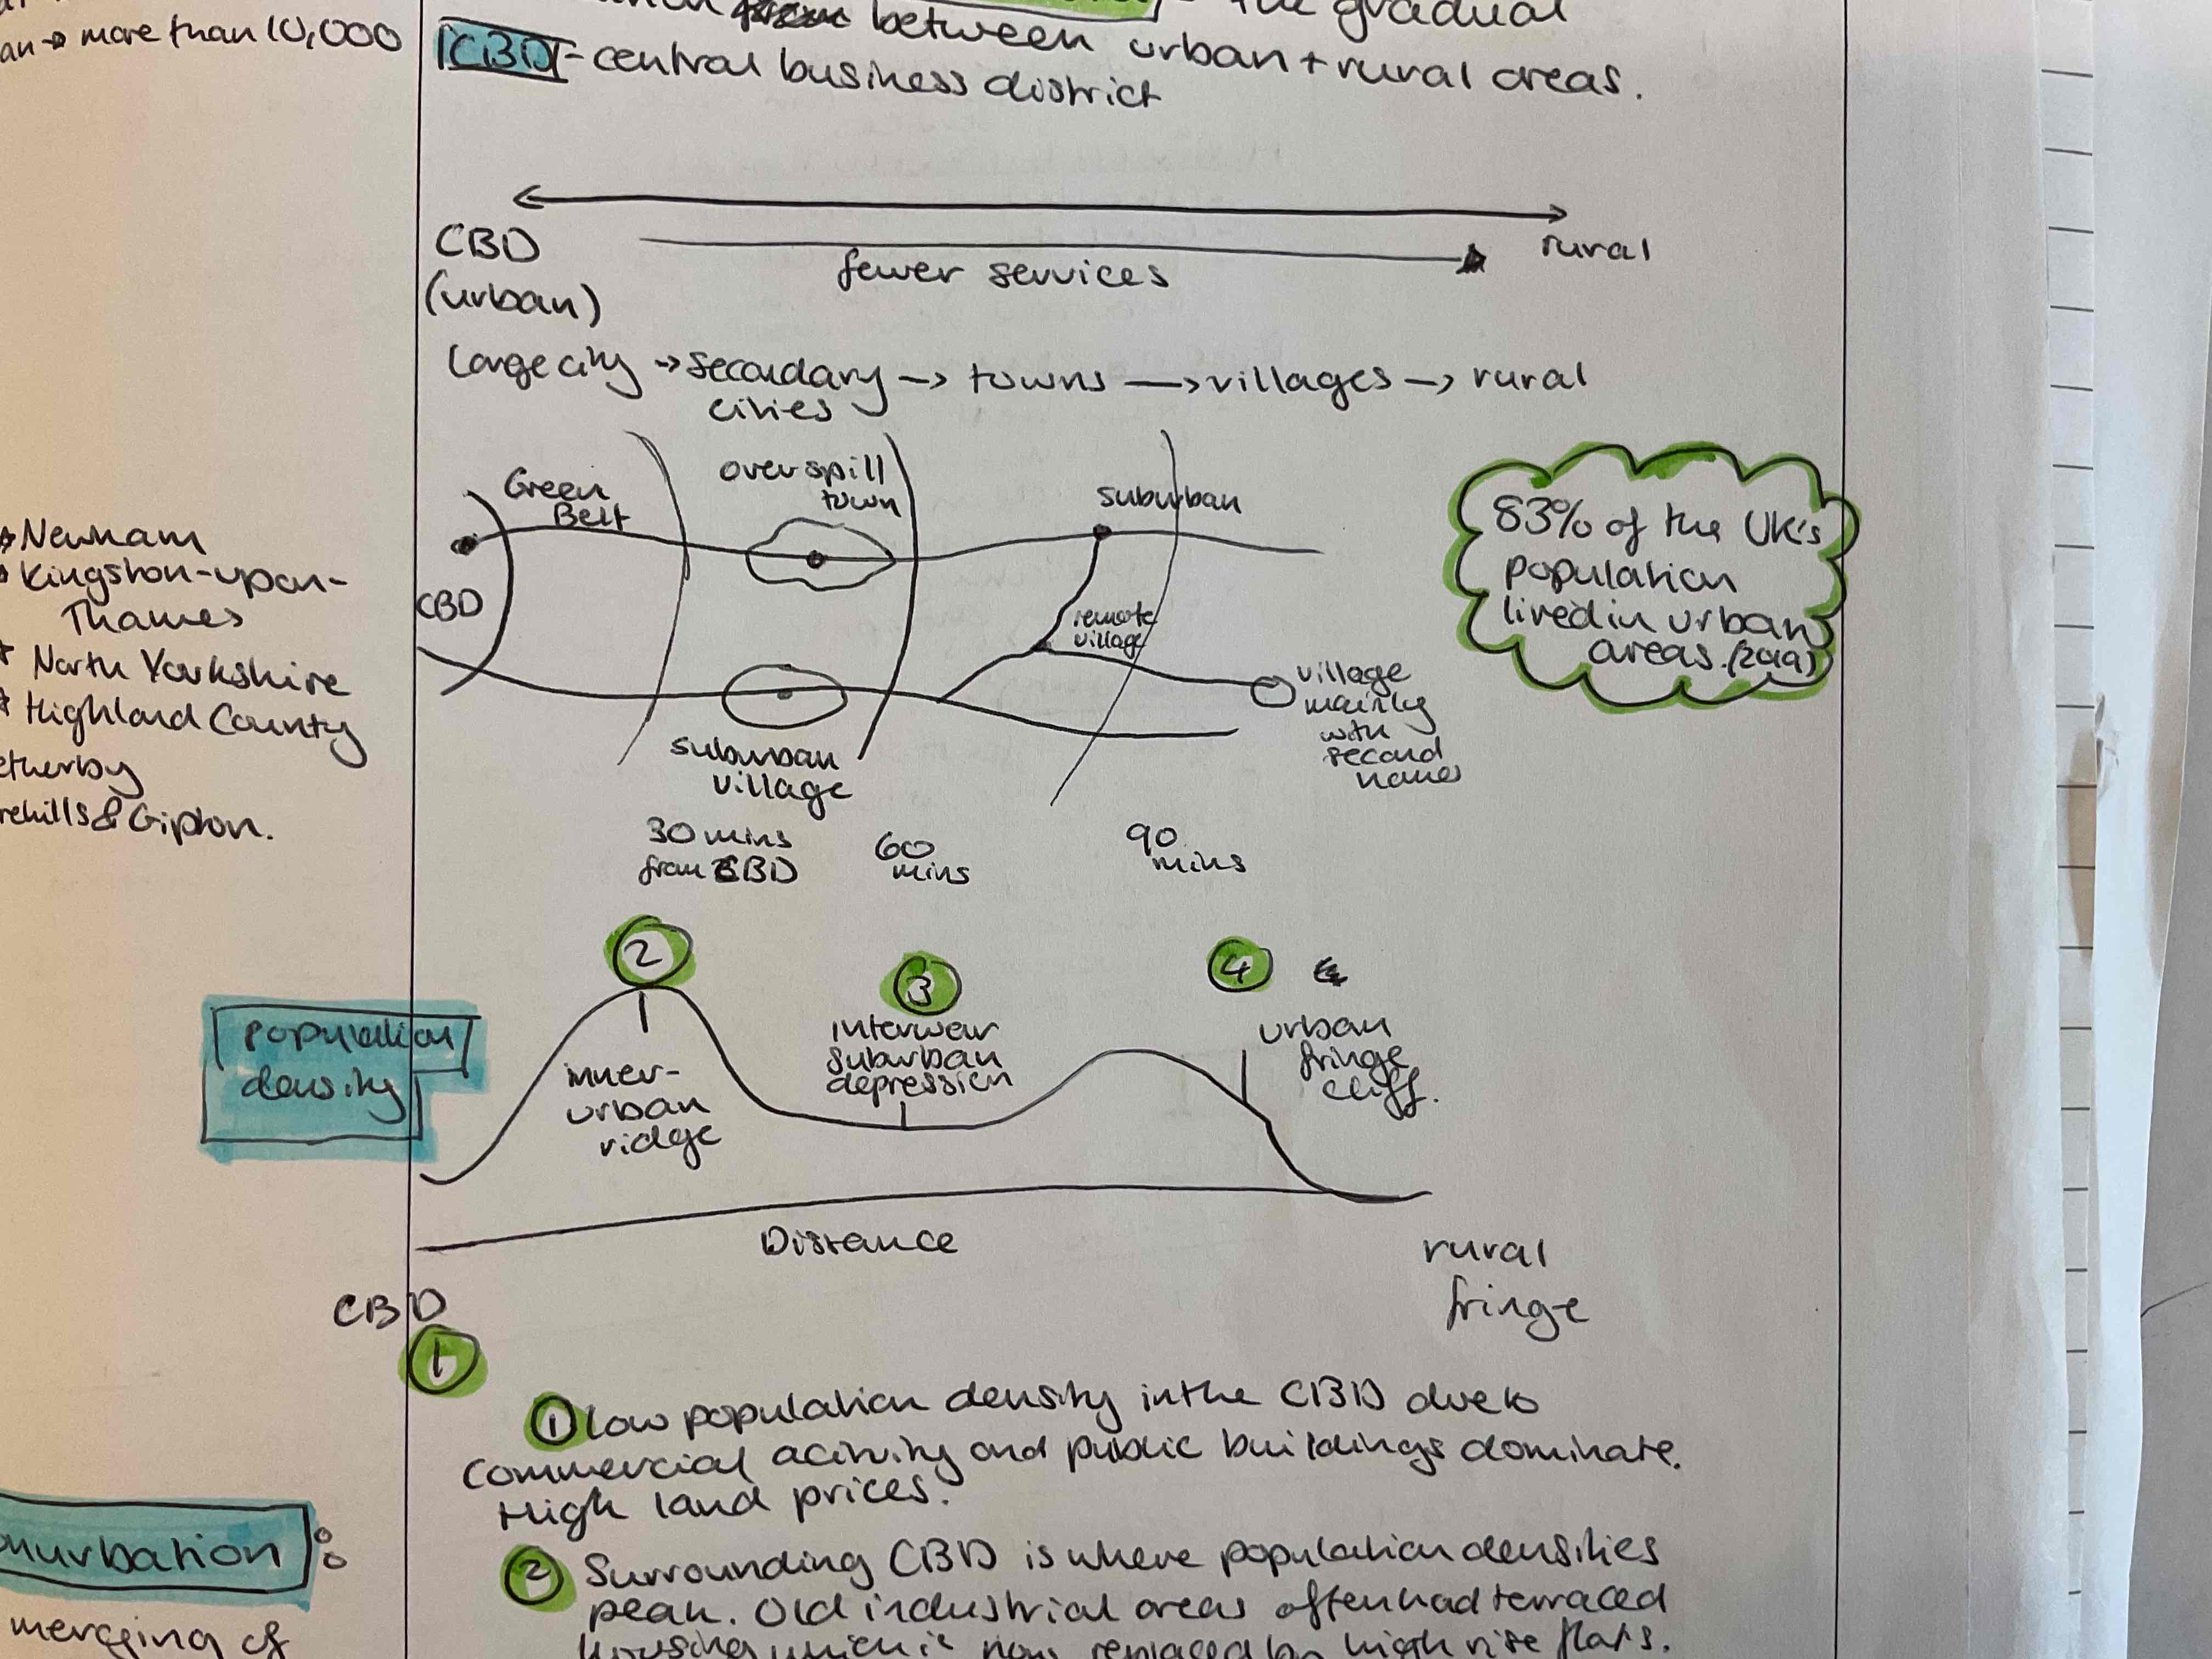
Population trends
low density in CBD (central business district)due to commercial activity and public buildings dominate
Surrounding CBD is highest densities. Old industrial areas with terraced housing. Some replaced with high rise buildings
Interwar period had low density buildings
Large amounts of council estates on the urban fringe but cliff due to green belt policies
What is conurbation?
The merging of two or more sizeable cities whose peripheral zones have grown into each other
What is an overspill town?
A town built/repurposed/expanded to accommodate access population from a city
Physical factors that effect population structure
areas of isolation = lower population densities and population decline
Isolated areas are poorly connected to areas of employment and services
Weather provides challenged e.g. winter causing power failures and become cut off from services (Scottish highlands)
How historical development caused differences in population structure
cities have expanded
Land use directly effects population density
Inner city has high density due to Industrial Revolution
Suburban has more space
Role of planning on population structure
green belts 1947 to prevent urban sprawl
Local and national government play a role
They decide on planning permission , housing and infrastructure
Regeneration projects
Creating enterprise zones to attract businesses
Population characteristics of wetherby, Leeds and harehills + gipton
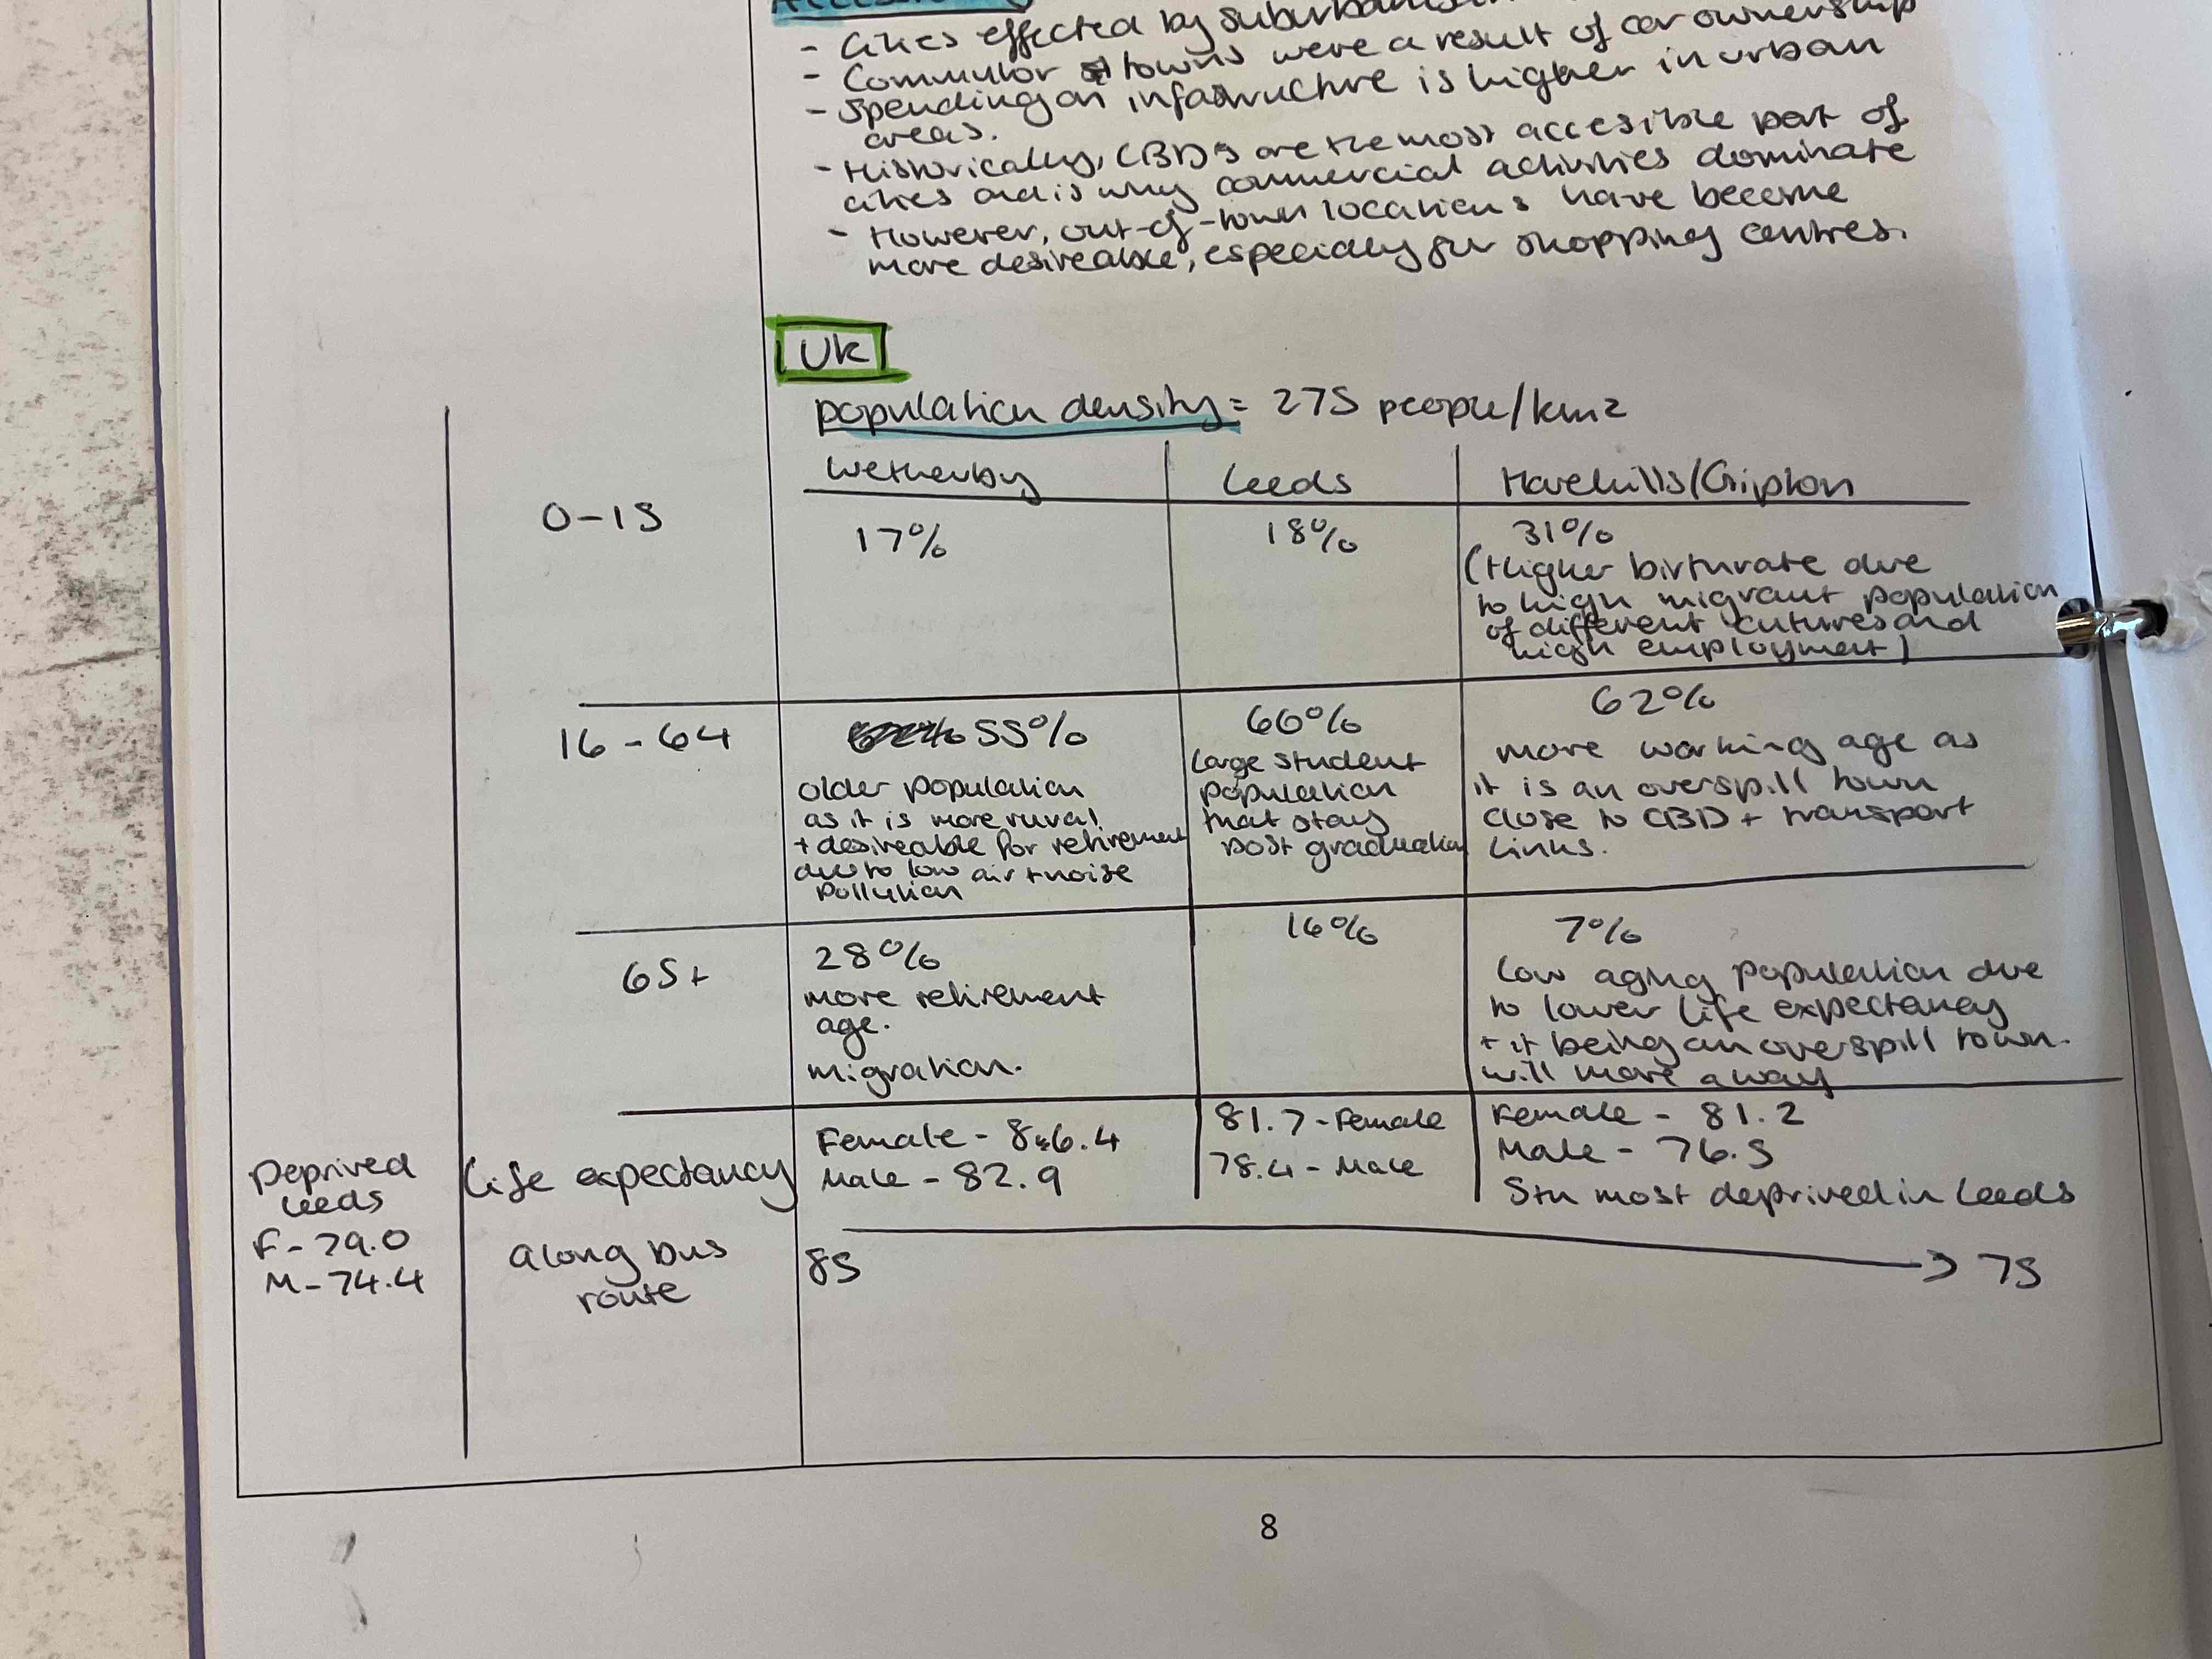
Wetherby population characteristics
Aged 0-15 is 17% of pop
16-64 is 55%
65+ is 28% due to retirement, migration and less noise and air pollution
Life expectancy 86.4 F and 82.9 M
Leeds population characteristics
0-15 is 18%
16-64 is 66% large student population that stay post graduation
65+ is 16%
Life expectancy 81.7 F and 78.5M
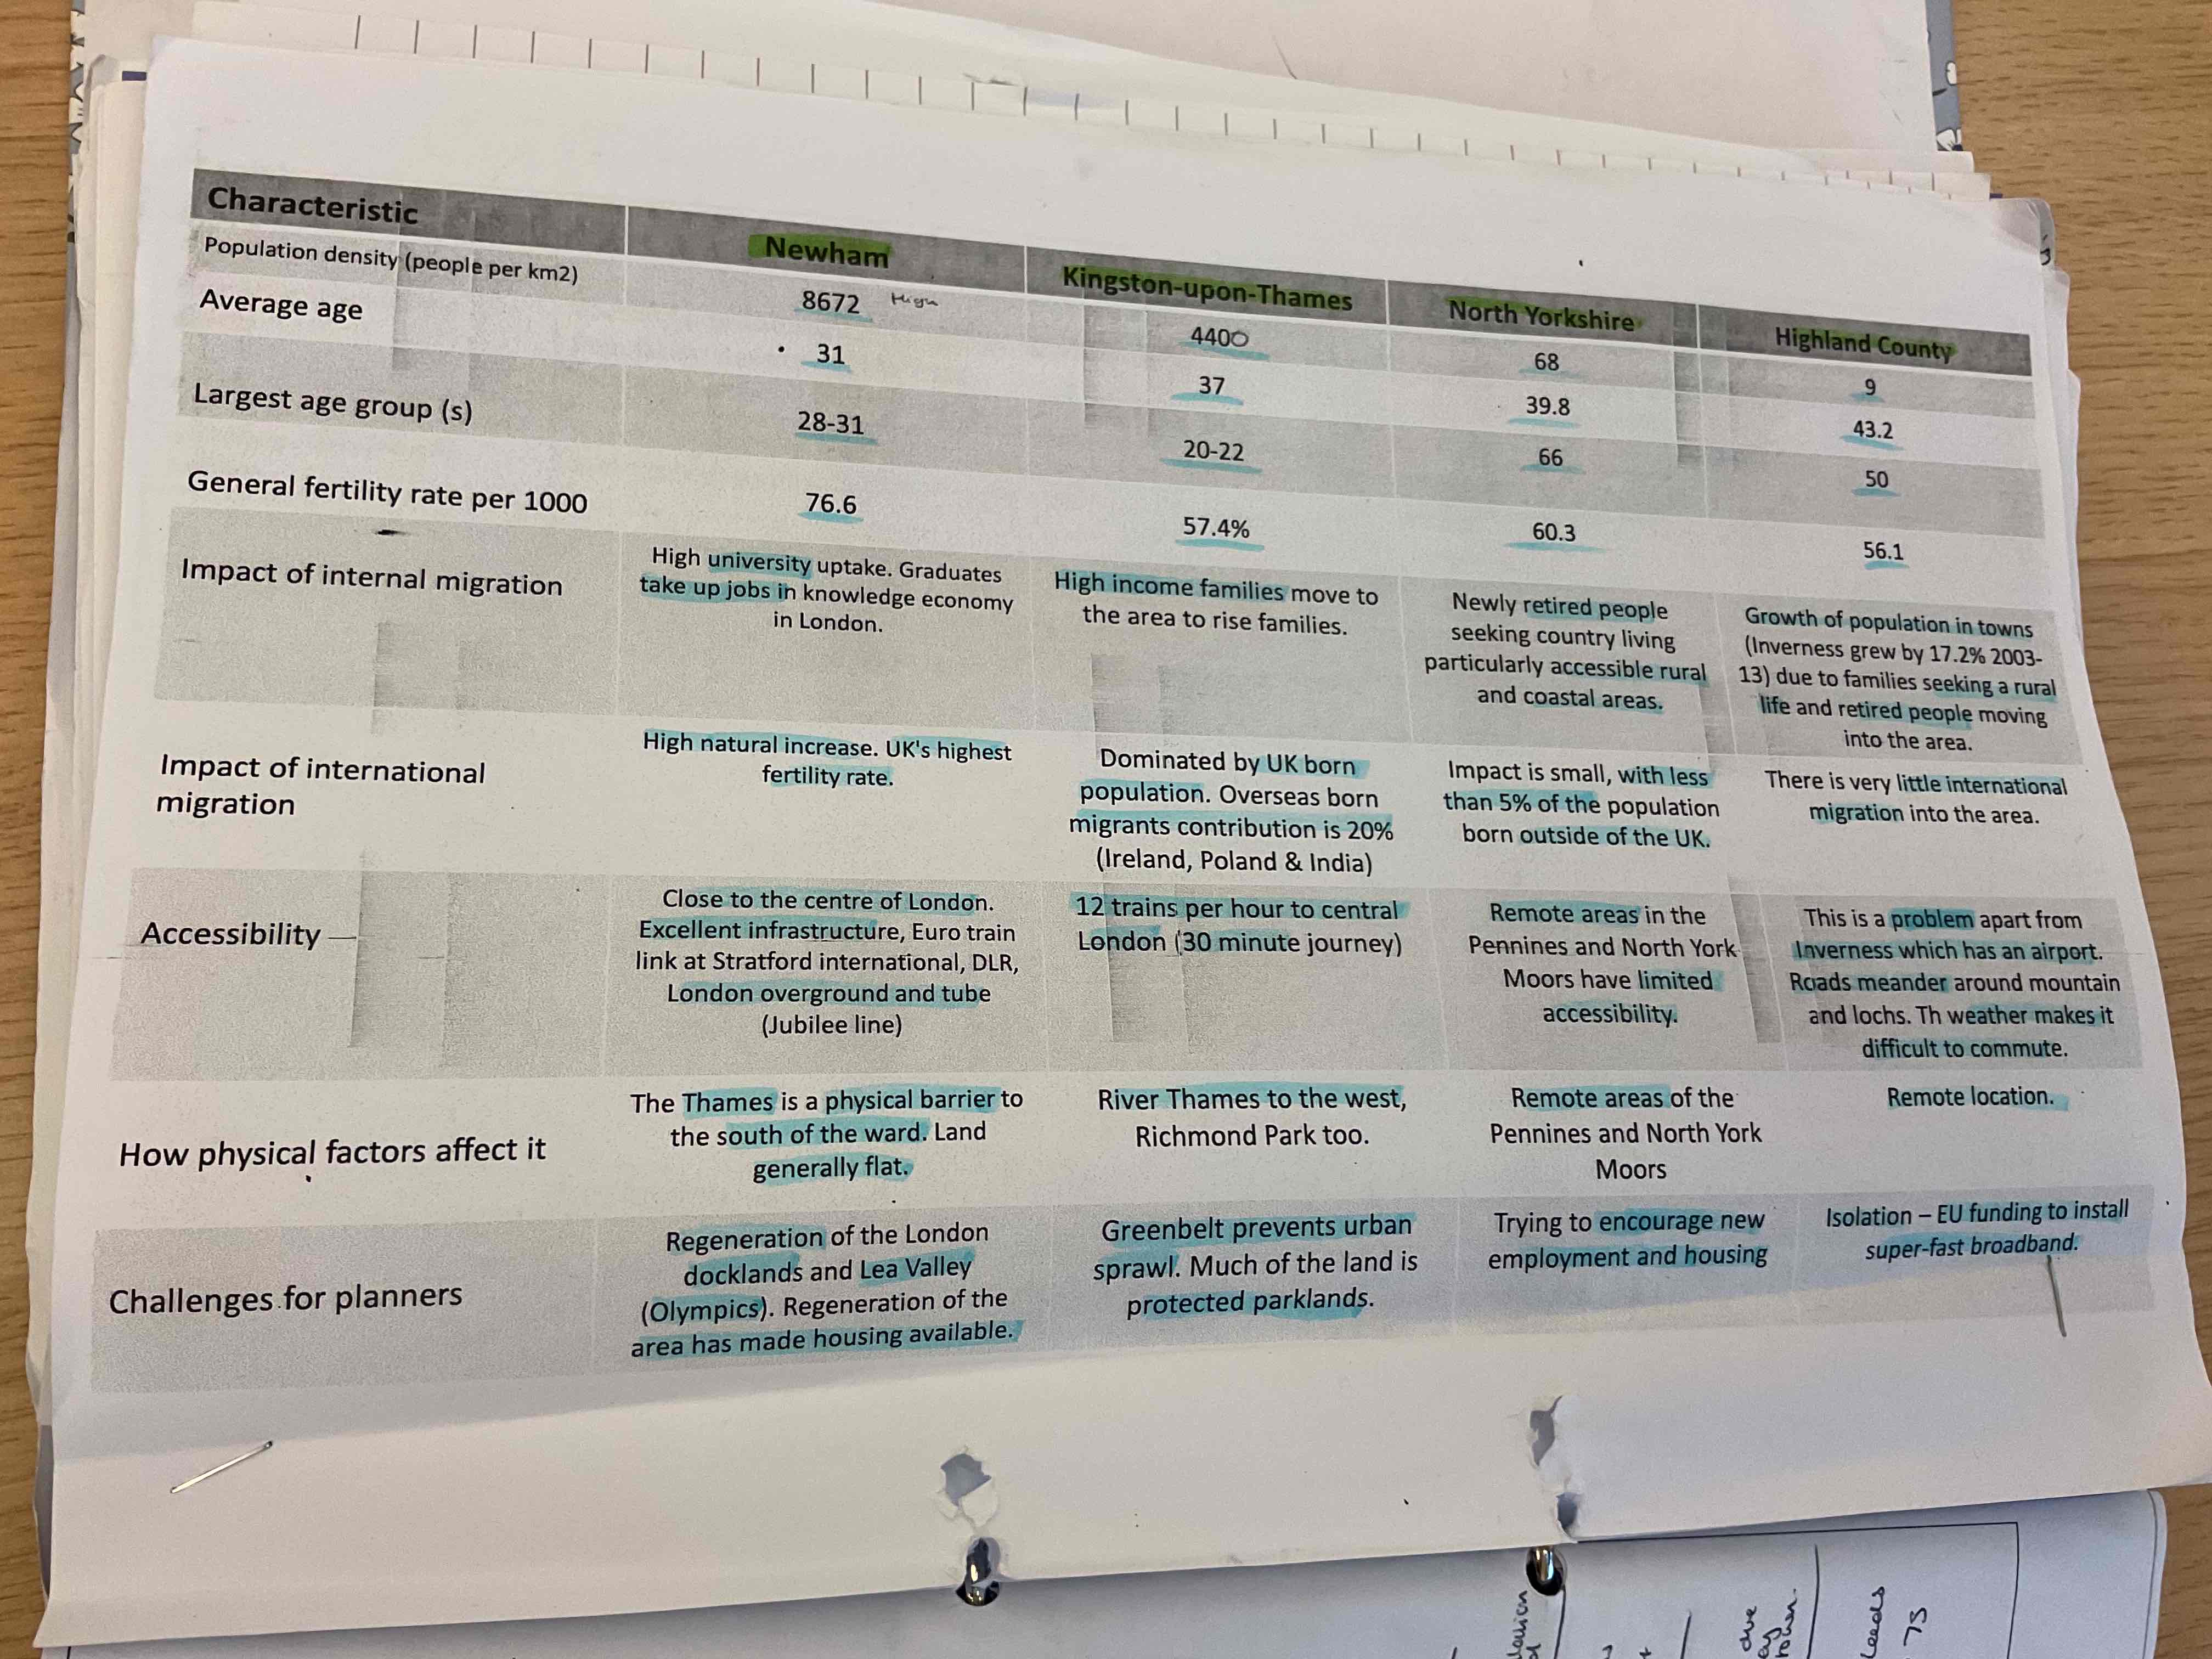
Characteristics of Newham
population density - 8672
Avg age - 31
Largest age group - 28-31
Fertility rate per 1000 - 76.6
Internal migration- high uni intake , graduates take up jobs in knowledge economy in London
International migration- high natural increase, highest fertility rate in the UK
Accessibility- close to centre of London , excellent infrastructure, London over ground + tube
Physical factors - Thames is a physical barrier, flat land
Challenges for planners - regeneration of dock lands, regeneration has made housing available
Characteristics around the UK
Characteristics in Leeds
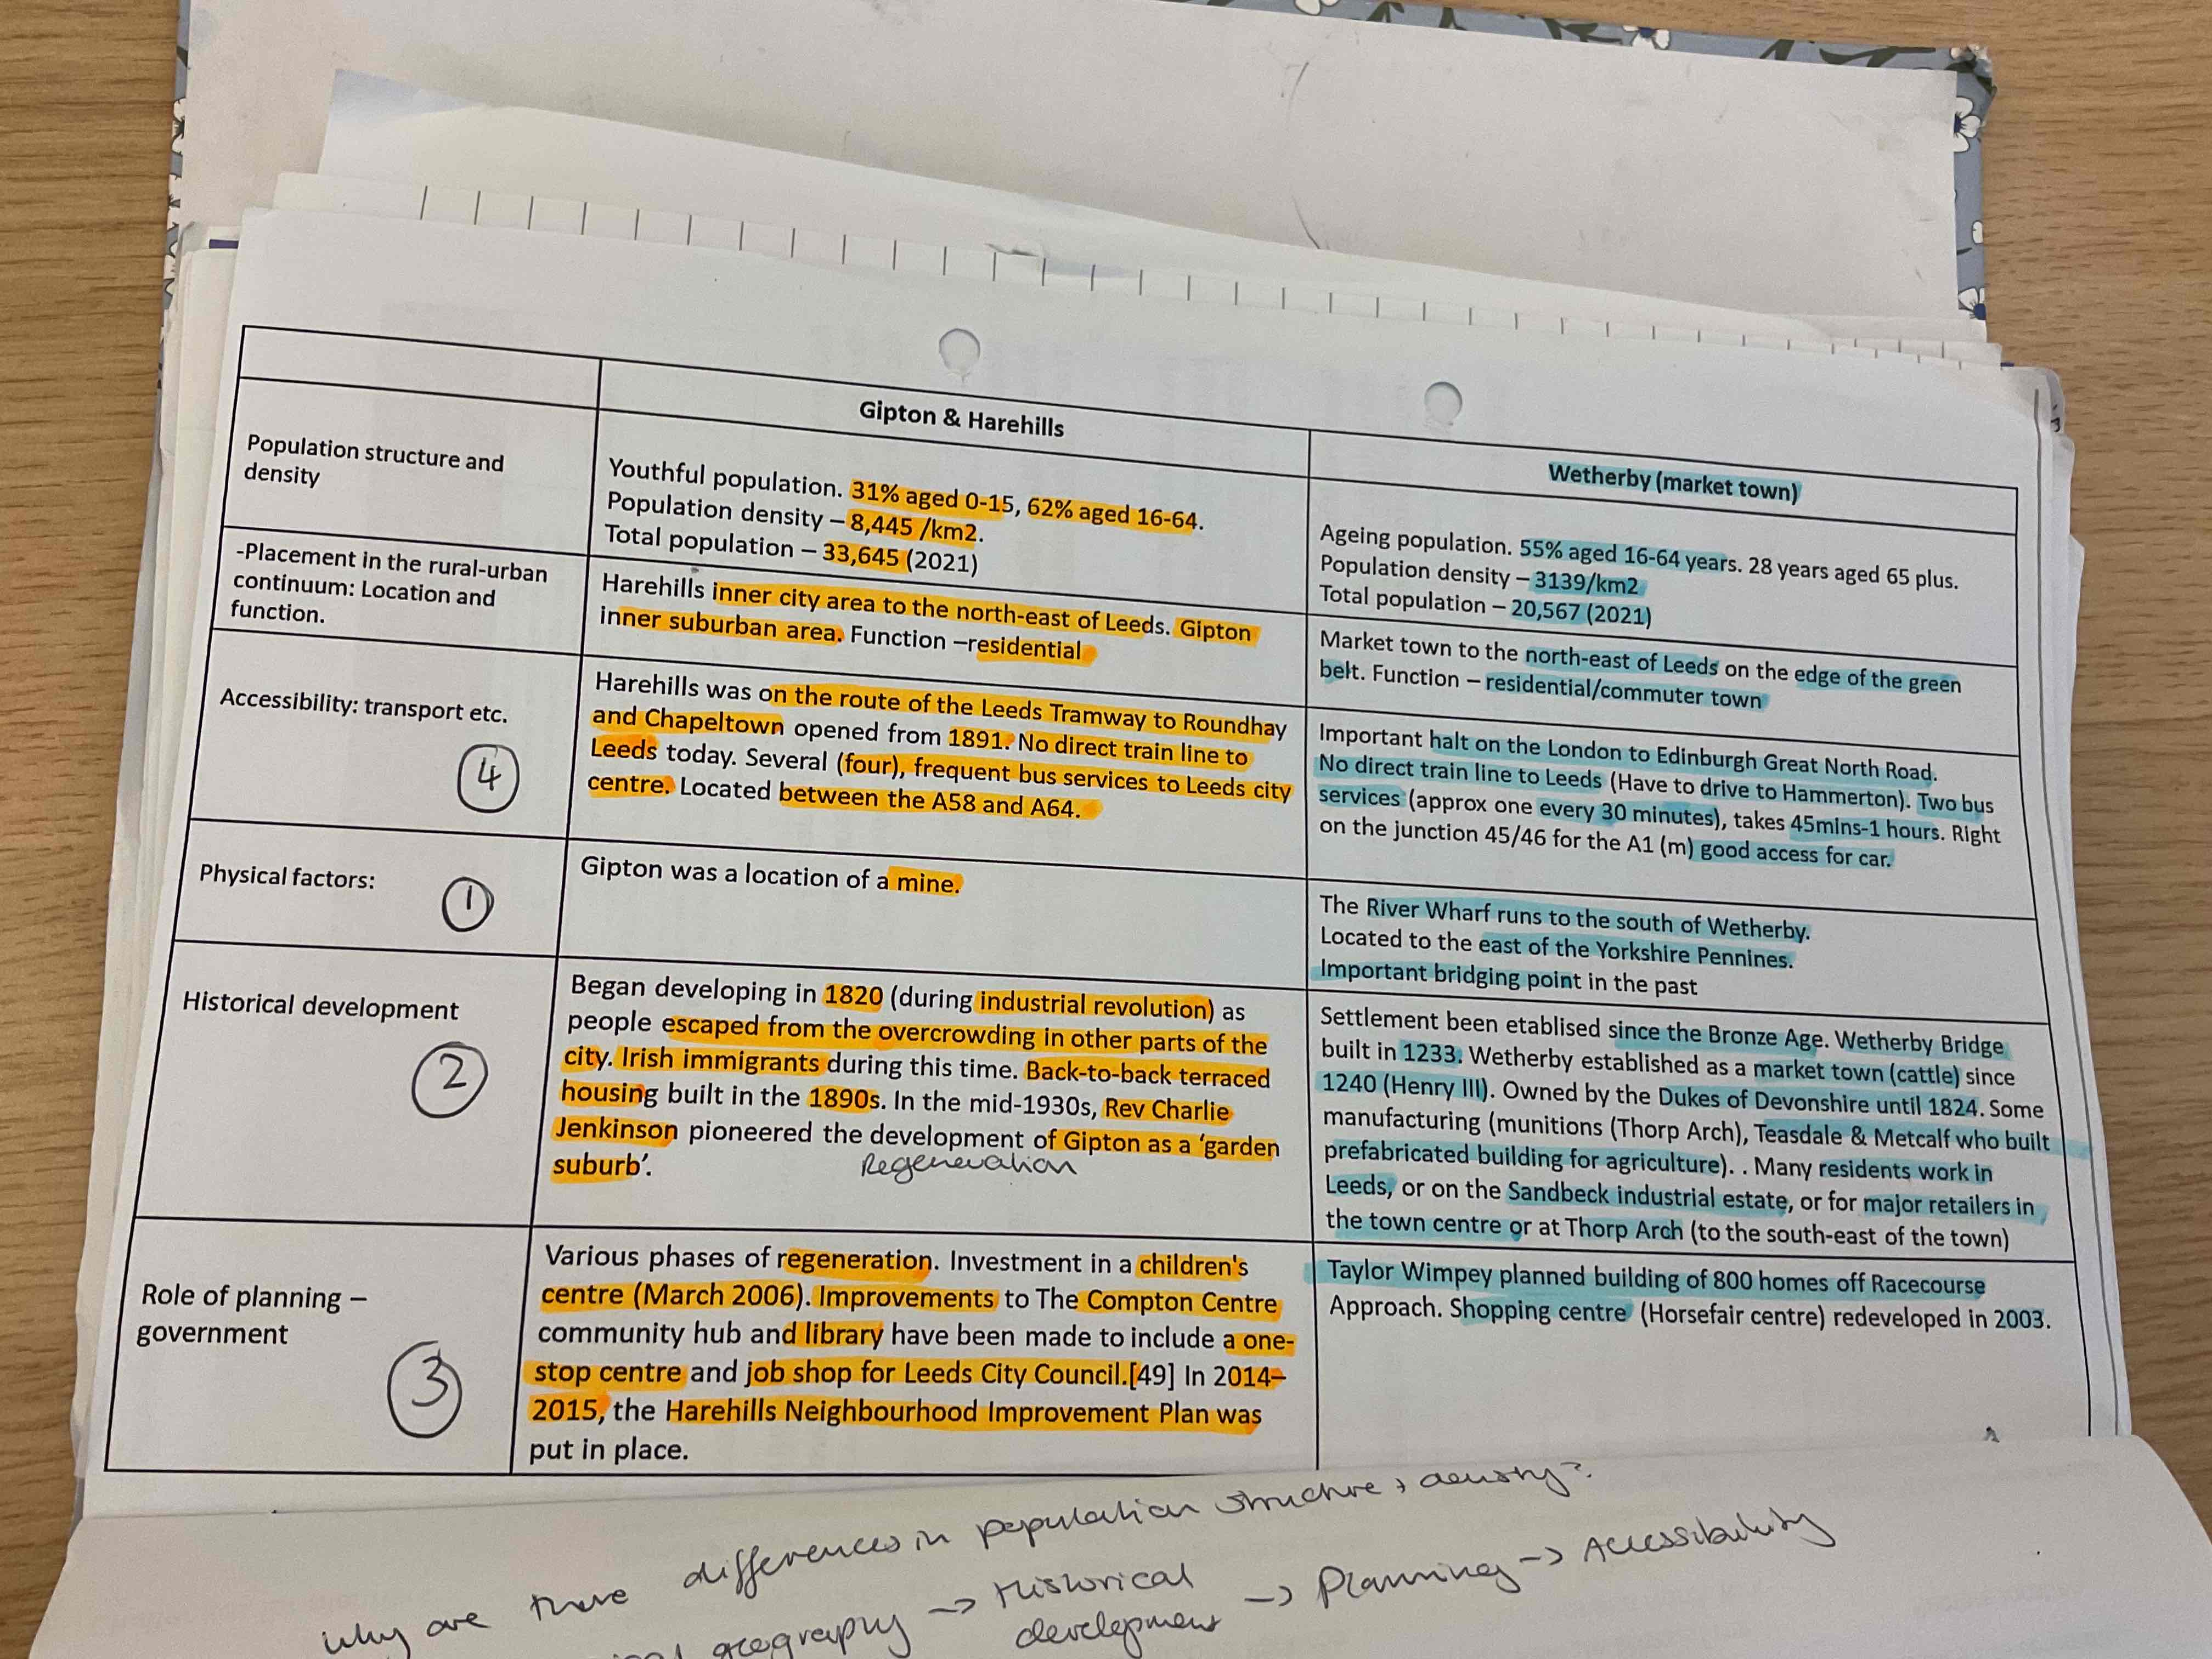
Role of planning in Harehills
regeneration in the children’s centre
Job shop
Harehills Improvement Plan
What is place ?
Location and meaning to people
Dynamic
Resisted by different groups
Creates insiders and outsiders
People shape place
What is physical landscape?
geology
Relief
Soil
Rivers
Vegetation
Estuaries
Coast
What is human landscape?
people
Culture
Diversity
Buildings
Infrastructure
Roads
Railway
What is economic landscape ?
present and past economic characteristics
Often reflected in tradition and buildings
Internal and external connects and media shape place
Internal - services , housing, employment
External - government, globalisation
Media- newspapers, social media
What is population
The number of people living in a certain area. The government measures population through a census and local surveys .
What is population density
The number of people per km² of a given area
What is population structure
The composition of the population of a particular country, region or area. Could be age, gender, ethnicity etc.
Uk population
69 million in 2024
84% of England is lived on as it is low lying
10 million increase in 50 years
1960s population
after ww2 there was a ‘baby boom’
Population growth rate of 0.61%
Strong economy growth = more children
Windrush generation migrating for work
1970-80s population
growth slowed to 0.14%
Recession = deindustrialisation and high unemployment
Fertility rates decreased
Women employed
Fewer jobs to employ migrants
1990s population
social (role of women) and economic adjustment
Increased birth rate due to baby boomers having late children
2010 population
population growth increased to 0.71%
Recession started 2008 (- GDP)
Waged stagnated/decreased
Large immigration (more than natural increase)
17% more than natural increase
Population in London and the SE
29.5% population growth 1981-2020
Growth in knowledge, finance and service industry attracts immigrants
Tertiary education attracts internal + external migration that stay post graduation
High skilled jobs available
North East England
1.7% increase 1981-2020
High levels of deindustrialisation
Coal, steel, ship building industries collapses
Companies shifting to other countries
High unemployment as a result
Fewer economic opportunities so younger population move south