Module 9: Firms and Industries: Basic Structures, Production, and Costs
1/23
There's no tags or description
Looks like no tags are added yet.
Name | Mastery | Learn | Test | Matching | Spaced |
|---|
No study sessions yet.
24 Terms
Accounting Profit
Total revenue received minus total explicit cost paid by a firm.
Economic Profit
The total revenue minus the total explicit cost and the opportunity costs paid by a firm.
Command System
A managerial hierarchy organizing the factors of production.
Incentive System
A managerial method for organizing the factors of production through incentives.
Perfect information
All individuals or participants have immediate and complete information.
Imperfect information
Individuals or participants do not have immediate or complete information.
Symmetric information
All individuals or participants have identical amounts of information.
Asymmetric information
Some individuals or participants have more information than others.
Adverse selection = A market in which buyers and sellers have different amounts of information.
Moral Hazard = Individuals likely engage in risky behavior because others will bear the costs of their actions.
FFCR (Four-Firm Concentration Ratio)
FFCR = (Market Share of Firm 1 + Market Share of Firm 2 + Market Share of Firm 3 + Market Share of Firm 4) / Total Market Share * 100
Measures the market share of the four largest firms in an industry (market). The problem with this measure of competition is it does not measure the market share of the other firm nor the relative size of each firm in the industry.
- An FFCR close to 0% indicates a highly (perfectly) competitive industry.
- An FFCR between 0% and 40% indicates a moderately (monopolistically) competitive industry.
- An FFCR between 40% and 70% indicates moderate to high (oligopoly) market concentration.
- An FFCR between 70% to 100% indicates a very high market concentration.
- An FFCR of 100% indicates total (monopoly) market concentration.
Herfindahl-Hirschman index (HHI)
HHI = sum of (Percentages)²
Measures the degree of market competition and avoids the problems of the four-firm concentration ratio.
It measures the size of each firm relative to the industry by calculating the sum of the squares of each firm's market share within the industry. Regardless of these limitations, both measures provide a rough estimate of the level of competition in an industry.
For both measures, the lower the number, the more competitive the market.
- An HHI below 100 indicates a highly (perfectly) competitive industry.
- An HHI between 100 and 1,500 indicates a moderately (monopolistically) competitive industry.
- An HHI between 1,500 and 2,500 indicates moderate market concentration.
- An HHI above 2,500 indicates a high (oligopoly) market concentration.
- An HHI of 10,000 indicates total (monopoly) market concentration.
Short Run
At least one input is fixed in producing a good or service
Long Run
All inputs are variable in producing a good or service.
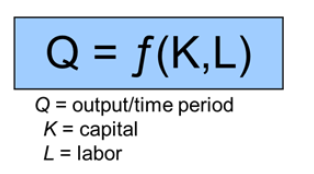
Production Function
The relationship between the output and services and the inputs used to produce the output.
Output/time period = some function of capital and labor inputs
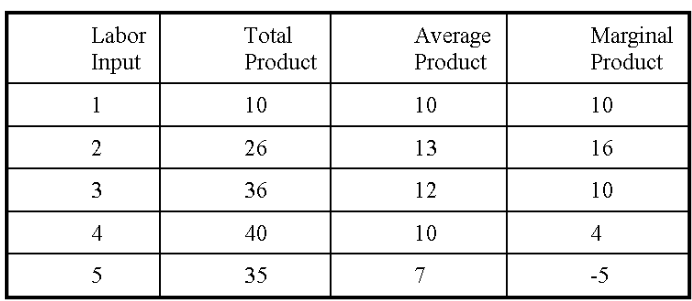
Total, Avg, and Marginal Product
Total Costs Formula
Total costs (TC) = Total fixed costs (TFC )+ Total variable costs (TVC)
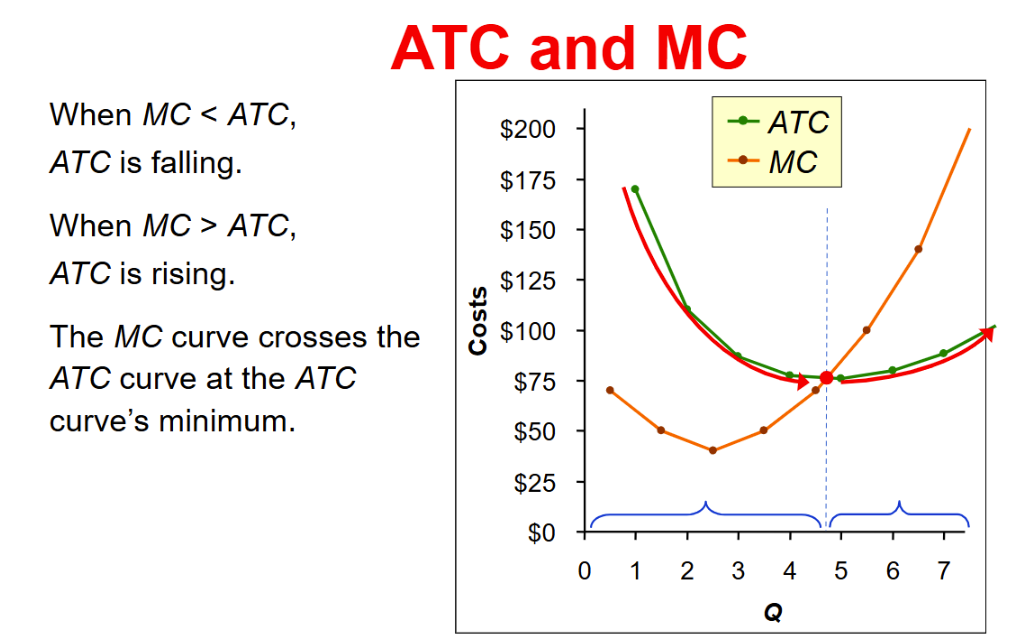
Average total costs (ATC)
total costs (TC) / output (Q)
Avg Variable Costs (AVC) + Average Fixed Costs (AFC)
Average variable costs (AVC)
total variable costs (TCV) / output (Q)
Average fixed costs (AFC)
Total fixed costs (TFC) / output (Q)
Marginal Costs (MC)
change in total cost / change in output
Marginal Cost → Avg Product Curve
When the marginal product curve rises, the average variable cost curve falls.
When to Produce more goods?
Marginal Revenue > Marginal Cost
Marginal Product of Labor (MPL)
MPL = Change in Output / Change in Labor
Q2 - Q1 / L2 - L1
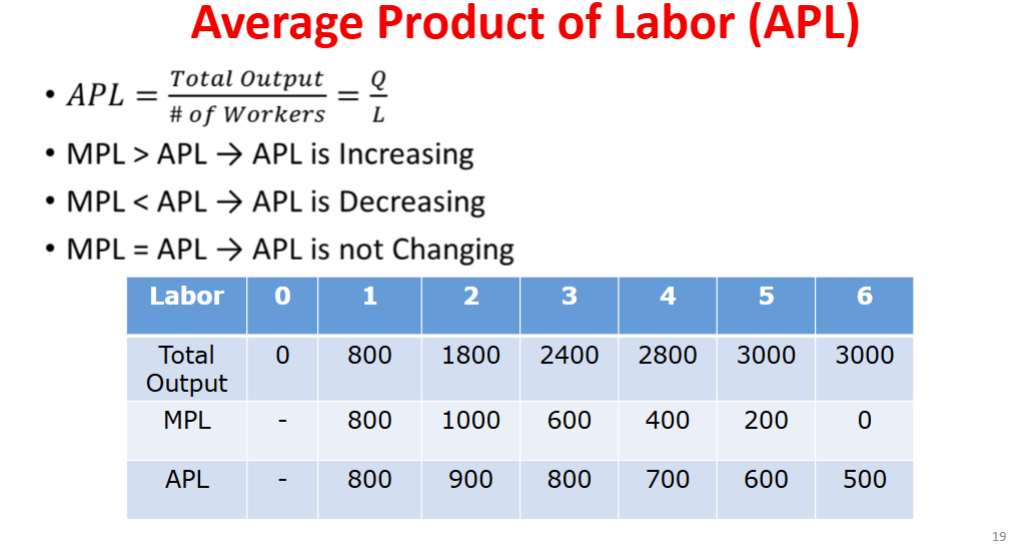
Average Product of Labor (APL)
APL = Total Output / # of workers
MPL > APL → APL is increasing
MPL < APL → APL is decreasing
MPL = APL → APL is not changing
Cost Analysis
If MC < AVC, then AVC is decreasing.
If MC > AVC, then AVC is increasing.