3.5 Profitability + ratio analysis
1/86
There's no tags or description
Looks like no tags are added yet.
Name | Mastery | Learn | Test | Matching | Spaced |
|---|
No study sessions yet.
87 Terms
Ratio analysis
Quantitative management tool that compares diff financial figures to examine + judge the financial performance of a business
Needs info from final accounts: balance sheet, profit + loss account
Purpose of ratio analysis
Examine a firm's financial position
eg its profitability + ST + LT liquidity position
Assess a firm's financial performance
eg its ability to control expenses
Compare actual figures with projected or budgeted figures (variance analysis) in order to improve financial management.
Aid decision-making
eg whether investors should risk their money by investing in the business
2 ways ratios are compared
Inter firm comparisons
Historic comparisons
Historical comparisons + purpose
Comparing the same ratio in 2 diff time periods for the same business
Shows trends → help managers + decision makers assess the financial performance of the business over time
Inter firm comparisons + purpose
Comparing the same ratios of businesses in the same industry
Ratio analysis can show the relative financial performance of businesses competing in the same market.
When is ratio analysis not useful?
When comparing against
Rivals in diff industries
Diff sized businesses in same industry (sole trader vs PLC)
Profitability ratios
Examine profit in relation to other figures
3 profitability ratios
GPM
PM
ROCE
Are profitability ratios more relevant for-profit businesses vs non-profit organizations?
For profit businesses
Profit
The financial surplus earnings of an organization once all costs have been deducted from sales revenue
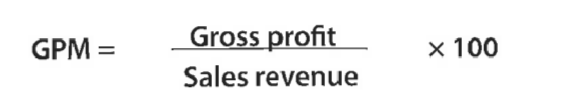
Gross profit margin (GPM)
A profitability ratio that shows the value of a firm's gross profit expressed as a percentage of its sales revenue
GPM = 60%, for every $100 of SR, $60 is GP
Gross profit margin equation
(GP / SR) x 100
Good value for GPM
Higher GPM= better for a business
Bc GP goes towards paying its expenses
2 ways to improve GPM ratio
Increase sales revenue
Reduce direct costs
4 ways to increase sales revenue
Reduce selling price of price elastic products with many substitutes
Increase selling price for price inelastic products with few substitutes
Use improved marketing strategies
Seek alternative revenue streams
2 ways to reduce direct costs
Reduce direct material costs: cheaper suppliers, cheaper materials
Reduce direct labour costs: reduce no. of staff, flextime, use non-financial incentives → labour productivity increases → reduces labour unit costs
Cons of reducing direct material costs by using cheaper materials
Product perceived as lower quality
Cons of reducing direct material costs by reducing direct labour costs
Can cause resentment + demotivation in the workforce
Profit margin (PM)
A profitability ratio that shows the % of sales revenue that turns into profit
ie proportion of SR left, after all direct + indirect costs (all production costs) paid
PM 40% → for every $100 of sales, $40 profit
Profit margin equation
(Profit before interest + tax / sales revenue) x 100

Why is profit before I+T used to calculate PM?
Allows for historical comparisons to be made
Profits change over time due to fluctuating I+T rates (beyond business’s control)
So doesn’t distort underlying financial performance of the business
Between PM + GPM ratio, which is a better measure of a firm’s profitability + why?
PM
Accounts for both cost of sales (direct costs) + expenses (indirect costs)
What does the difference between a firm’s GPM + PM represent?
Expenses
The larger the difference betw GPM + PM…
The more difficult overhead control tends to be
Good value for PM
Higher the better
Why is it common / normal for high volume products (eg fast food) to have a low PM?
High sales volume compensates for low PM
Why is it common / normal for low volume products (eg luxury watches) to have a high PM?
High PM compensates for low sales volume
Besides increasing SR + reducing direct costs, how else can a business improve its PM?
Reduce business expenses
Increase SR
Reduce direct costs
How to reduce business expenses to increase PM
Discuss preferential payment terms with trade creditors + suppliers (delay payments to improve CF position / pay on time to get discounts)
Negotiate cheaper rent
Reduce indirect costs
To calculate GPM + PM, what can be used?
Balance sheet
Profit + loss account
How can a price reduction reduce GPM, but improve PM?
Fall in price reduces GPM
But price reduction attracted more customers
Indirect costs constant
So NPM increase
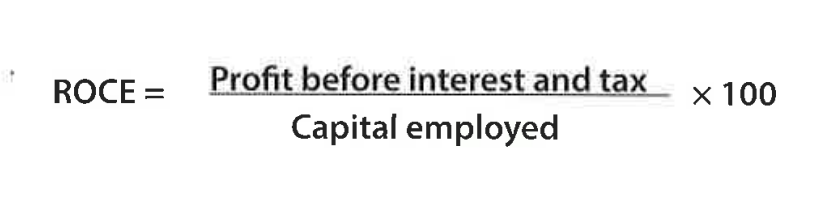
Return on capital employed (ROCE)
A profitability ratio that measures the financial performance of a firm based on the amount of capital invested
Shows profit as a % of capital used to generate it
20% ROCE, for every $100 invested, $20 generated
ROCE equation
(Profit before I+T / capital employed) x 100
On what type of final account is capital employed found on?
Balance sheet
Capital employed
Sum of owner’s equity + non current liabilities
Sum of total internal sources of finance + all LT external SoF
Capital employed equation
NCL + equity
Good value for ROCE
Higher the better
Should at least exceed the interest rate offered at commercial banks
Must be high enough to create an incentive for investors to invest
Why is ROCE calculated using profit before I+T?
Allows for better historical comparisons
Key ratio in business
ROCE
Bc shows how well a firm is able to generate profit from its source of funds
How to improve ROCE
Increase profits
CE falls but NP stays constant
But not desirable irl
Liquidity ratios
Look at the ability of a firm to pay its ST (current) liabilities from its current assets
2 types of liquidity ratios
Current ratio
Acid test (quick) ratio
Why are shareholders / potential investors + creditors / financiers interested in liquidity ratios?
Creditors- helps assess the likelihood of getting back money they are owed
Shareholders- reveal a firm’s ability to repay debts
Liquid assets
The possessions of a business that can be turned into cash quickly w/o losing their value
3 types of liquid assets
Cash
Stocks- finished goods, ready for sale
Debtors
Current ratio
A ST liquidity ratio that calculates the ability of a business to meet its debts within the next 12 months
X:1
CR 2.5:1 Firm has $2.50 of CA (liquid assets) for every $1 of CL
Current ratio equation
Current assets / current liabilities
Good value for current ratio + why
1.5 to 2.0
Saftey net bc irl not possible to sell CA w/o losing some value
Likely have suffcient working capital
Working capital equation
Current assets - current liabilities
Why should a business have a positive working capital?
Has the potential to invest + grow
Why is it bad if a firm’s CA is less than CL (negative working capital, CR<1)?
Has problems paying back trade creditors + suppliers → jeopardises business survival if creditors demand payment
Can lead a firm to go bankrupt
What does it mean if a business has a CR<1?
ST debts of the business are greater than its liquid assets
3 reasons why a firm may have a too high current ratio + cons?
Too much cash in the business → could be better spent to generate more trade
Too many debtors → increases chance of bad debts / customers defaulting on the money they owe
Too much stock → increases storage + insurance costs
Why are supermarkets having a CR of over 2:1 acceptable?
They hold a huge amount of stock, but stocks are highly liquid.
How to improve current ratio?
Increase CA
Decrease CL
How to increase value of CA?
Encourage cash purchases by offering discounts for immediate cash payments or early repayments if they have trade credit
Invest in stock control systems to reduce the amount of stock held (increases the cash balance)
How to reduce value of CL?
Cut overdrafts + use LT loans with lower interest rates
Avoid late payment penalties from creditors by paying on time
Take advantage of cash payment discounts
Use specialist tax accountant services who advise on how to reduce tax liabilities
Acid test (quick) ratio
A liquidity ratio that measures a firm's ability to meet its ST debts
It ignores stock bc not all inventories can be easily turned into cash in a short time frame
Acid test ratio equation
(CA- stock) / CL

Why is acid test ratio usually more meaningful than current ratio?
Bc stocks not always easily converted into cash
Eg semi finished goods → not much value added → low price
V expensive stock can’t be turned into cash quickly
What do liquidity ratios measure?
Liquidity crisis
A situation where a firm is unable to pay its short-term debts
CL greater than CA
Ideal benchmark for acid test ratio
1:1
For every $1 of CL, a firm has $1 of cash / debtors to pay for it
Lower than this → firm experiences working capital difficulties / liquidity crisis
What happens if acid test figure is too high?
Firm is holding onto too much cash, rather than using it more effectively
Why are potential investors + ST lenders interested in the firms quick ratio?
Helps reduce risk to investors + financial lenders
Bc ratio measures ability of a firm to cover ST debts
How to improve acid ratio (from equation)?
Increase level of CA (cash / debtors)
Lower amt of CL
Better
Cons of increasing level of debtors
Increases chance of bad debts occuring
Uses of ratio analysis
Cons of financial ratio analysis
Historical account of an organization’s performance
Changes in external business environment can cause a change in financial ratios w/o there being any underlying change in performance of a business
No universal way to report final accounts → inter-firm comparisons difficult
Qualitative factors that affect business performance are ignored
Organizational objectives differ betw businesses
Examples of quantitative analysis
Cash flow forecasts
Investment appraisal
Financial ratio analysis
Cons of quantitative analysis
It is only partial
Doesn’t provide a complete picture of a firm's overall performance.
Need other quantitative + qualitative considerations to help to make a better assessment of an organization's financial performance
Other quantitative + qualitative considerations to make a better assessment of an organization's financial performance
Historical comparisons
Inter-firm comparisons
The nature of the business + its aims / objectives
State of the economy
Social factors