NATF320 L13 Habitat loss fragmentation
1/29
There's no tags or description
Looks like no tags are added yet.
Name | Mastery | Learn | Test | Matching | Spaced | Call with Kai |
|---|
No analytics yet
Send a link to your students to track their progress
30 Terms
land-use change
main driver of biodiversity loss
LULC trends across south america
decrease in tree cover, increase in cropladn, especially in argentina and brazil, increase in pastures, especially in brazil
Land use change effects
habitat loss
habitat fragmentation
habitat degradation
habitat loss
reduces the amount of area available for a species
decline in the abundance of that species
species can go extinct
decrease in the number of species
habitat loss → forest loss
the net toal forest cover in several countries in Europe/US changed little or increased in past decades, due to regenartion (secondary forests) or tree plantations
→ deforestation to tropics
habitat fragmentation
modifies the spatial configuration of the remaining area in the landscape
influences the population dynamics of a species, e.g. decreasing the dispersal among habtiat patches
indirect effects on species, e..g habitat fragmentatino increases human pressure as forest fragments become more accessible, thus increasing hunting pressure or fire risk
three main components of habitat fragmentation
edge effect
patch size
isolation
a fragmented landscape contains more, smaller and isolated patches and a larger proportion of edge effect
how to measure habitat fragmentation
patch-scale study
ladscape=scale study
patch-scale study
predictor variables are spatial attribtues of individual patches (e.g. patch size, patch isolation)
landscpae-scale study
predictor variables are spatial attributes of indivual landscapes (e.g. percentage of habitat, number of patches)
Species-area relationships (SAR)
relates the number of species to the area of habita
the result of plotting the species richness (S) of a particular sample against the area A of that sample
a linear regression estimates the relationship between S and A
species-area data are typically nonlinear → log log transformation, the steeper the slope of the line (i.e. greater Z value, the greater the difference in species richness among sampling areas
S=C+z*A
S number of taxa encountered
A area sampled
C intercept of the line
z slope
log: S=C*A^z
Species-area relationships
two main reasons to explain the increae in the number of species
as more area is sampled, the chance of encountering additional species increases
a larger are is likely to be more environmentally heterogenous, thus containing additional species that differ in their niches
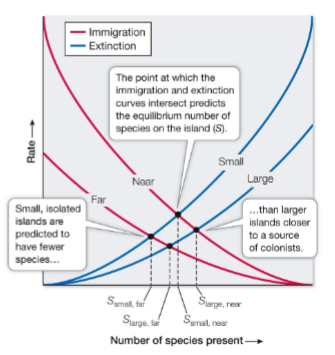
Theory of Island biogeography
the number of species on an island is related to the area of the island and the degree of isolation of the island
smaller, more isolated islands have fewer numbers of species
equilibrium thoery of island biogeography
the number of species on an island depends on the balance between immigration and extinction rates
as species richness increases the rate of immigration decreases but extinction increases due to competition and predation
the point at which the immigration and extinction curves intersect predict the equilirbium number of species on the island → the number of species that should theoretically fit on the island
habitat-fragmentation - patch size and isolation
Brazilian amazon forest
the effect of isolation on local extinction is mostly positive, but for one-third of the species, slope estimates are very close to zero, increase in isolation, increase in extinction
negative effect of patch size on local extinction, increae in patch size, decrease in extinciton
matrix
the non-native habitat between fragments of original habitat
case study-atlantic forest
how does the quality of the matrix affect habitat loss filtering
bird occurences were in general higher in high-quality matrices
low-quality matrices increased the severity of habitat loss filtering effects for forest specialist birds → higher extinction proability due to habitat loss in landscapes with loq-quality matrices
edge effects
the result of interaction between two adjacent ecosystems, when the two are separated by an abrupt transition (edge)
how do edges modify the environment
changes in microclimate (e.g. compared to a forest, crops and pastures allow more solar radiation to reach the ground during the day)
chemical fertilizers from adjacent croplands penetrate inside the forest
changes in forest structure (more light, better growing conditoins for grasses)
physiological tolerances (some forest plant species how lower densities or are absent near the edge, while others show higher densities)
changes in species interactions (e.g. highest nest predation near edges)
human disturbances (e..g higher hunting pressure along edges)
edges
nearly 20% of the worlds remaining forest is witin 100m of an edge
morre than 70% of the worlds forests are within q km of a forest edge
the largest continuous forest are in the humid tropical regions of the amazon and congo river basins
forest strips
occur in agriculatal landscapes in tropical and subtropical regoins
have been dictated by government polciies to benefit agricultura and with the assumption that these strips maintain biodiverisyt (increase connectivity)
in northern argentine environmental norms require that forest strips (at least 100 m wide) are left surrounding agricultal plots (23-37 ha of forest strips for every 100 ha of deforested land)
species do not really use the strips
fragmentation
refers specifically to an increase in the number of pathces, which often accompanies habitat loss
habitat fragmentation per se
refers to the effects of fragmentation after taking account of, or in the absence of, habitat loss
habitat degradation
reduces the quality of the habitat, while maintaining the amount of habitat area and the spatial configuration of the former landscape
forest degradation
no reduciton of forest area, but lower quality
drivers:
selective logging, charcoal production, fires, overgrazing
often more difficult to characterize with remote sensing
habitat degradation - tropical rainforests
tropical forests vary in compositon, structure and function such that not all forests have similar ecological value
we often focus on forest cover and overlook anthropogenic pressures that can degrade forest quality and impact biodiversity
time delay to extinction
time taken for a community to reach a new equilibrium after landscape transformation (time taken for a specis to go extinct after landscape transformation)
extinction debt
the number of eextant speceis predicted to go extinct due to past land-use change, but which have not yet gone extinct because of time delays
extinction debt in the gran chaco
habitat amount crucial for birds and mammals → they respond immediately to habitat loss
time-delayed response to habitat fragmentation → the effects of habitat fragmentatino magnify over time
duration of the time-delayed response longer for birds than for mammals → high hunting pressure for mammals
Indirect effects of habitat loss
habitat loss can cause some extinctions directly by removing all individuals over a short period of time, but it can also be indirectly responsible for lagged extinctions by
facilitating invasions
improving hunter access
eliminating prey
altering biophysical conditions
increasing inbreeding depression