Economic Extended Response
1/55
There's no tags or description
Looks like no tags are added yet.
Name | Mastery | Learn | Test | Matching | Spaced |
|---|
No study sessions yet.
56 Terms
Macro Economics
The study of the economy as a whole
Cirlce flow of income
It is a macroeconomic model that describes the flow of resources, goods and services, and income between parts of the economy
5 sector circular flow model
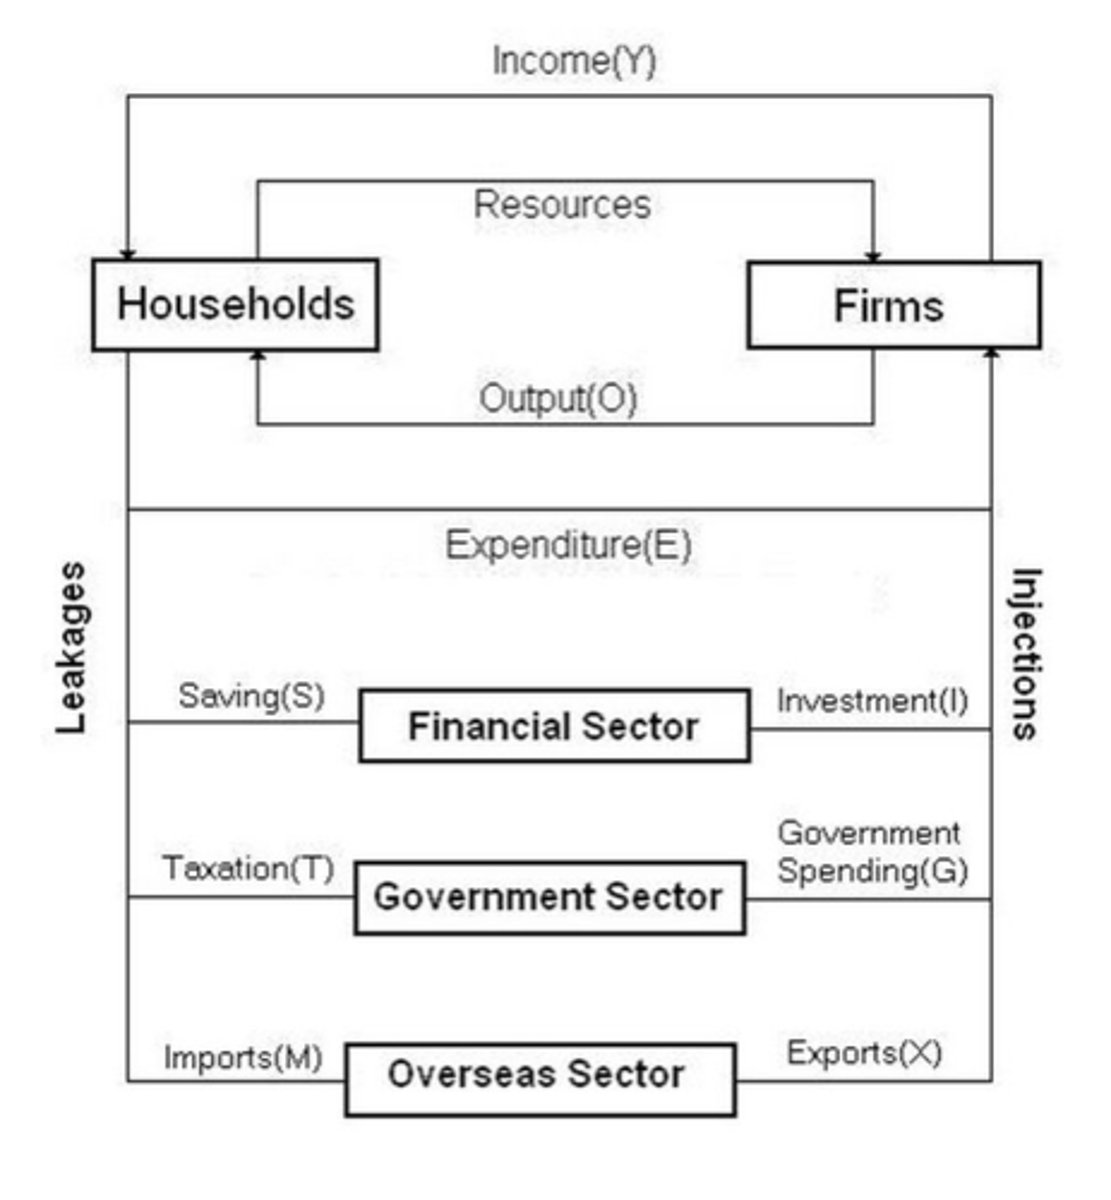
HouseHolds
* the owners of productive resources,
* buyers of goods and services
Firms
* Employer of resources
* produce all the goods and services for the economy
Assumptions for Households and Firms
* Households spend all thei income
* No government interference
* No over seas trade
* No intermediate goods
Real flowgo
goods, services and resources, on the inside
Money flow
Spenfin and income, on the outside
Product Market
Households spend income they have earned to purchase goods and services
Factor market
Firms hire resources in return for which households receive income
Financial Sectors
Institutions that act as an intermediary between savers and investors
Saving
The portion of income that is not spend on goods and services for current consumption
Investments
The expenditure on goods and services which are not intened for current consumption
Government Sector
The part of the economy that collects taxes and provides and manages public services.
Taxation
Households pay some of their income to the governement, such as income tax, excise duties and GST.
Governemnt expenditure
Can be classified as:
Current expenditure - spending on day to day function such as wages, fuel and utilities
Capital expenditure- infrastructure such as school, roads and hospitals
Overseas Sector
The sector containing overseas buyers of exports and suppliers of imports
Imports
goods produced abroad and sold domestically
Exports
Goods and Services sold to other countries
Marginal Propensity to Consumer (MPC)
The proportion of additonal income earned that is soent on goods and service
MPC forumla
ΔC ÷ ΔY
E.g. 1600 ÷ 2000 = 0.8 or 80%
Marginal Propensity to Save (MPS)
The proportion of additional income earned that is saved
MPS Formula
ΔS ÷ ΔY
E.g. 400 ÷ 2000 = 0.2 or 20%
MPS + MPC
Unless stated otherwise MPC + MPS will be 1
Final Equilibrium
calculated by 1 / (1-MPC) or 1/MPC
e.g if MPS = 0.2
then FE = 1/0.2 = 5
FE = 5
Gross Domestic Product (GDP)
The toal valvue of all final goods and services produced in a country during a period of time (usually a year)
Ways to Measure GDP
* Income and earning approachhh (Total National Income)
* Expenditure apprach (we will look at thhis in detail)
* Production approachh (value of all G&S produced)
Aggregate Expenditure
The shum of all spending on final goods and services produced in the economy
Components of aggregate expenditure
* Personal consumption expenditure (C)
* Private Investment (I)
* Government spending (G)
* Net export spending (X-M)
AE = C + I + G + (X-M)
Consumption
The largest component of aggregate expenditure is consumption account for around 55-60%. It is relatively stable
Components of Consumption
* Non durable goods (Consumer withing 3 years) (35%)
e.g. foods, drinks, clothing
* Durable goods (15%)
e.g. White goods, furniture, cars
Services (50%)
e.g. transport, education, health, recreation
Private Investment
The most volitile component of AE as the amoutn of investment rises and falls depending on the perceived rish and likelihood of profitable returns in the future
make up around 15-25% of AE.
Components of Private Investment
* Business investment = pribately funded business spending on capital goods
* Housing investment = private spending on new housing
* Changes in inventories = spending on stocj to be sold later
Goverment
Divded into:
G1 - current spending on day-to-day business
- wages, slaries, good and services
G2 - Capital spending
- Proctuve machinery, public infrastucture
Net Exports
Net exports make up the total spedning on exports minues the total spending of imports (X-M)
they make up -2 to 2% of GDP
Factors Affecting Consumption
* Dispoable income (Yd)
- Higher icnome after tax = more spending
* Interest rates (r)
- Low intrest rates, cheaper to borrow = more spending
* Consumper expections
- Feeling positve about the economy = more spending
* Government policies
- Fiscal policy = changes to tax rates
* Avaliability of credit
- Easy to get a loan/credit card = more spending
* Stock of personal wealth
- Rising house prices or share prices = more spending
Factors affecting investment
* Past profits
- Higher past profits = more investment
* Interest rates
- Low interest rates = cheap to borrow & lower opportunity cost = more investment
* Government policies
- Policies that encourgae investment(e.g. lower company tax) = more investment
* Business expection
- Positve future expection = more investment
Factoring affectin Government Expenditure
1. Chanes in polivies/ budet (i.e. spendin on education)
- Expansionary budget increases = level of government expenditure increases
- Contractionary budget decreases = levels of government expenditure decreases
2. Shocks
- Shocks increases = lvels of overnement expenditure increases
- Shocks decreaaes = level of government expenditure decreases
Factors affectin Net Exports
* Domestic Economic rowthh (Imports only)
- Increased Domestiv growth = increased import spending
* International Economic Growth (exports only)
- Increased Interantional Growth = increased export spending
* Exchange Rates
- Deprecation of AUD - increase exports and decreased imports
* Terms of Trade
- Increased ToT = increased export spendingg
* Protection (Tariffs, quotas)
- increased protection = reduction in trade
business cycle
Model used to repsent to repsent the short term flucuations in the economic acitivity in a country over time
Characteristics of a business cycle
1. Boom
2. Downswing
3. Trough
4. Upswing
Boom
When the upswing has peacked, the level of aggregate expensiture is at, or beyond the level requied for full employment of productove resources
Characteristics of a Boom
* Highest levels of economic growth
* Highest levels of inflation
* Lowest levels of unemployment
* High levels of confidence through out the economy
* High cast rates
Downswing
When the increase of income, output and expenditure that characterised the boom starts to level off.
Characteristics of Downswing
* Slower growth in spending, output and income
* Consumer and business confidence decreases
* Unemployment increases
* Aggregate expenditure falls as consumption and investmnt declines
* Interest rates fall
Trough
When downswing has bottomed out, the level of aggre gate expenditure is below the level required for full employment of productive resources
Characteristics of a trough
* Lowest levles of economics growth
* Lowest levels of inflation
* Highest levels of unemployment
* Low levels of confidence throughout the economy
* High levels of saving
Upswing
As spending in the economy increases the multiplier helps ends the recession and push the ecnomy into a peak or boom period
Characteristics of Upswing
* Increased investment and capital expenditure
* Increased levels of economic acitivity
* Increasing business and consumer confidence
* Unemployment beigns to fall
* Infaltion starts to gradually increase
* Longer time to unflod than a downturn
Type sof economic indicators
Leading, Coincident, Lagging
Leading Indicators
Indicators that predicy changes in economic acitivyt, they generally change before a direction in the ecnomy becomes evident
Coincident Indicators
Indicators tat move in line with the level of economic activity and generally change at the same time as the business cycle
Lagging Indicators
Indicators that do not show any change until after the trends of the economy have been confirmed
Leading indicators examples
* Share price movements
* Building approvals
* Loan approvals
* Household confidence surveys
* Business confidence surveys
* levles of inventory
Coincident indicators example
* Gross Domestic Product
* Retail sales
Laggins indicators example
* Inflation rate
* Unemployment rate