GW Blok 6 Seminar 2.2 Foundation of inferential statistics
1/20
There's no tags or description
Looks like no tags are added yet.
Name | Mastery | Learn | Test | Matching | Spaced |
|---|
No study sessions yet.
21 Terms
What is a population in statistics?
The entire group of individuals or observations we want to study or make conclusions about.
Population → the entire set of relevant units of analysis
Example: first year students of EPH and GZW
Population → parameter
Parameter → the value of a variable that characterizes a population
Example: the mean of the expected exam score in the entire cohort of students, but population mean is unknown
What is a population parameter?
A numerical value that describes a characteristic of the entire population, often denoted using Greek letters (e.g., μ for mean, σ for SD).
What is a sample in statistics?
A subset of the population selected for analysis, ideally randomly chosen to represent the population.
Sample → any subset of the population
Example: students who participated the wooclap event in the lecture
Sample → statistic
Statistic → the value of a variable that characterizes a sample
Example: mean of the expected exam score in the sample (97 students) x bar = 5.77
What is a sample statistic?
A numerical value calculated from a sample, used to estimate the population parameter (e.g., x̄ for mean, s for SD).
Population parameters are usually unknown and the purpose of inferential statistics is to try to estimate these as precise as possible by means of estimates calculated at sample level.
What is a random sample?
A sample where every individual in the population has an equal chance of being selected.
What we can do is to select a sample of say 1000 Dutch people such that every Dutch person has an equal probability to be included in your sample
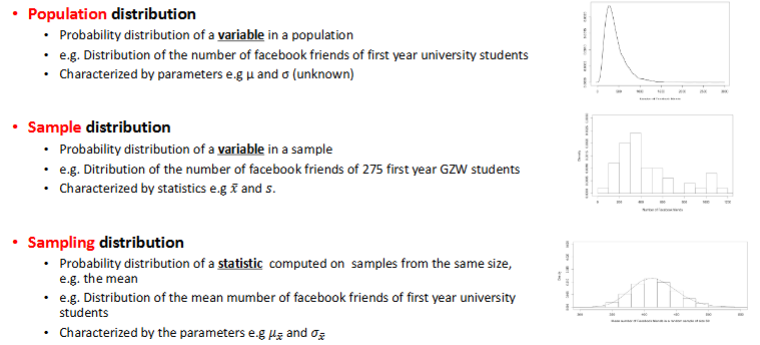
What is a population distribution?
A population distribution is the (often unknown) distribution of the whole population from which the sample at hand is a random sample with (often unknown) true average μ0 or difference between true averages or any other measure of central tendency or measure of spread) and (also often unknown) standard deviation σ
What is a sample distribution?
A sample distribution is an observed distribution of the outcome values of the sample at hand of size N and with standard deviation s
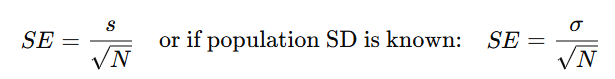
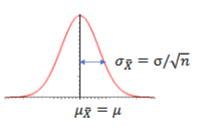
What is the standard error (SE) of the mean?
It quantifies how much sample means vary from the population mean.
Standard error: SD of sampling distribution
SE becomes smaller with a larger sample size, because larger samples provide more accurate estimates, reducing variability between sample means.
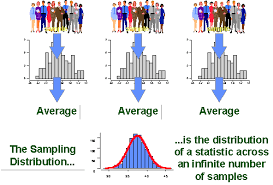
What is the sampling distribution?
However, is a distribution of sample averages (or any other statistic of interest, e.g. distribution of sample odds ratios). It cannot be observed in practice because it will only be determined in the situation that you could have obtained an infinitely (a very, very large) large number of samples each of size N and standard deviation s
The theoretical distribution of a statistic (like the sample mean) calculated from all samples of the same sample size drawn from a population.
It shows how the sample mean (x̄) varies across different random samples and centers around the true population mean (μ).
the average of the sampling distribution is exactly equal to the true population average μ0.
If sample size increases, the sampling distribution becomes more peaked (narrower), meaning sample means are more tightly clustered around the true population mean.
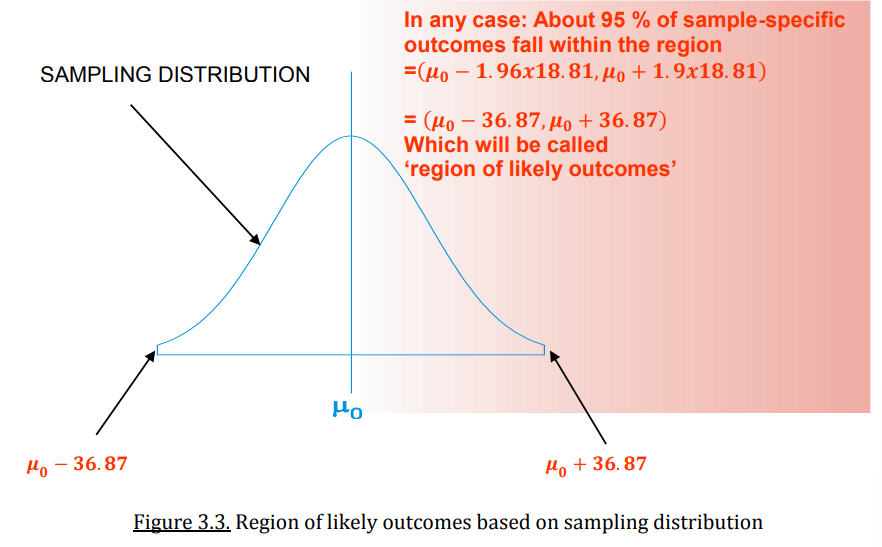
What is the region of likely outcomes in a sampling distribution?
What can be concluded is, e.g. that 95 % of all possible samples will fall within two standard deviations around the population average (property of the normal distribution). This region would be called the region of likely outcomes.
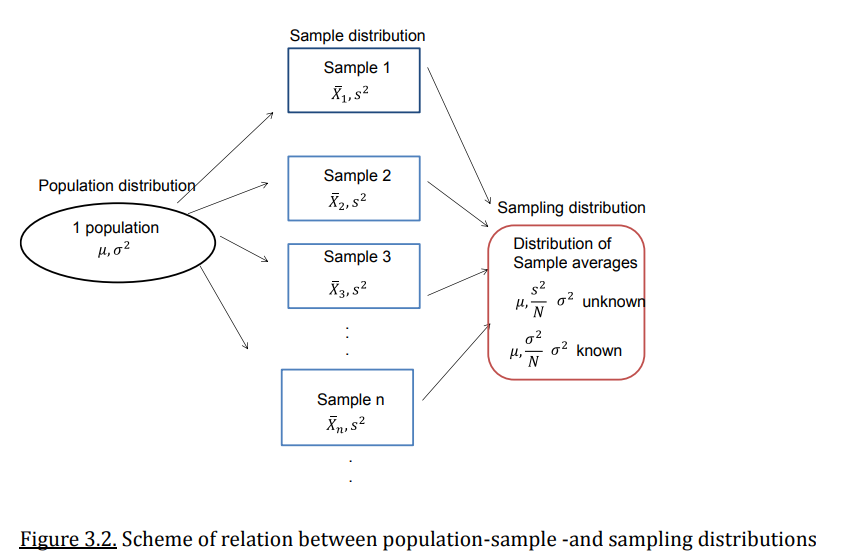
Summary of population, sample and sampling distributions?
X and s indicate known values
mu and sigma are parameters and you know them
What is the Central Limit Theorem (CLT)?
If the samples are independent and the sample size is large enough, the sampling distribution of the sample mean will be approximately normal, regardless of the population’s distribution.
N>40
The distribution of sample mean bar will, as the sample size increases, approach a normal distribution
The mean of all the sample means will be the population mean (mu), niet afhankelijk van steekproefgrootte
Alleen de vorm is afhankelijk van de sample size
The standard deviation of the sample means will approach sigma/wortel van N = standard error
It allows us to use normal distribution properties to make inferences about the population mean even when the population distribution is not normal.
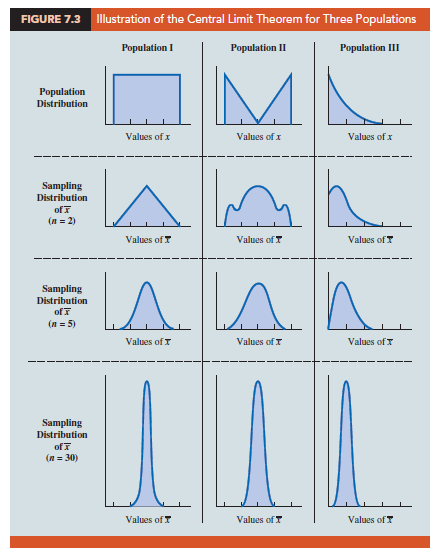
Central limit theorem visualized
What is inference in statistics?
Drawing conclusions about the population based on data from a sample.
What is a confidence interval and what effect does the sample size, CI and low variation have on the CI?
How accurate our sample estimate (e.g., sample mean) is likely to be in estimating the true population parameter.
Used to express the range in which we are pretty sure the population parameter lies
If sample size increases the CI becomes narrower (more precise estimate)
If confidence level increases, the confidence interval increases, it becomes wider (more certainty = bigger range)
Population with low variation → similar samples with low variation → narrow confidence interval
And vice versa
Small samples vary more from each other and have less information → wider confidence interval
And vice versa
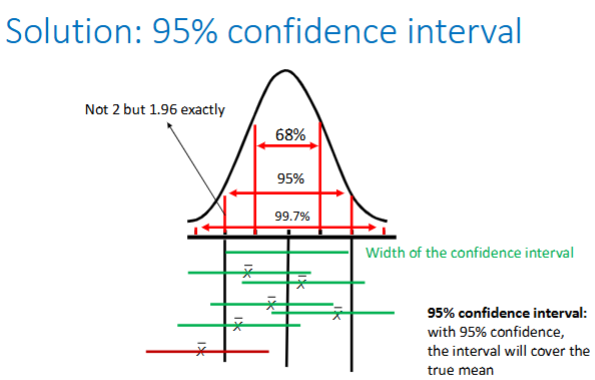
What is a 95% CI and how was it made possible?
95% CI: with 95% confidence, the interval will cover the true mean, with lower bound … and upper bound …
In real life you don’t know what the true value of the population is → 95% CI for the sample value
This is made possible because of the central limit theorem for 𝑋 bar
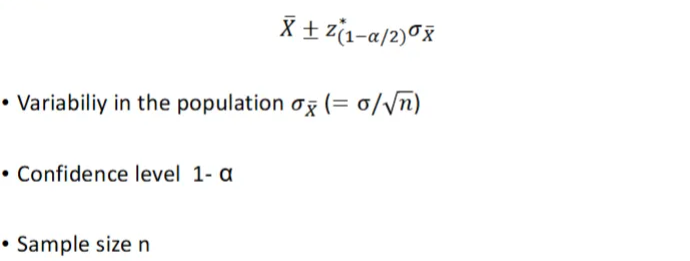
In general, we can use a (1-alfa)100% -confidence interval (C.I.), with alfa =0.05. Basically, alfa can be chosen between 0 and 1
What determines the width of the confidence interval
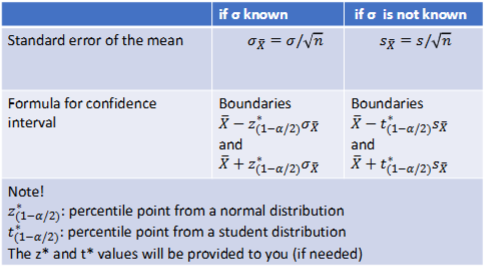
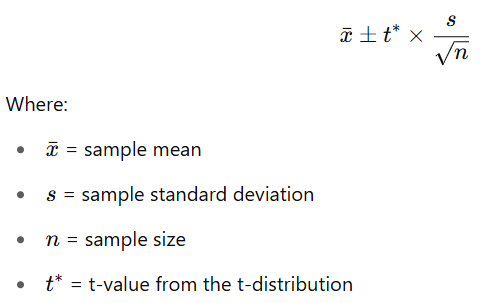
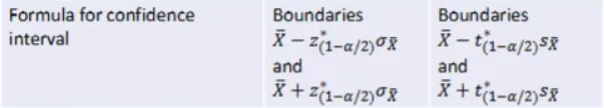
How do you calculate the confidence interval?
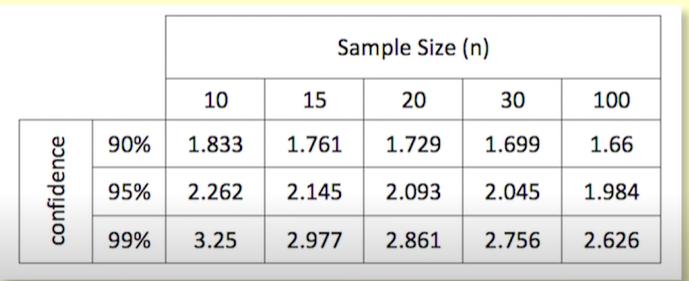
T krijg je vaak gegeven
Eerst som + en daarna - → betrouwbaarheidsinterval
How do you use a 95% confidence interval to test a hypothesis?
Check if the hypothesized value (μ₀) is within the 95% CI:
If μ₀ is inside the CI → not significantly different → not enough evidence provided to reject H0
If μ₀ is outside the CI → significantly different → enough evidence provided to reject H0
How is the 95% confidence interval related to p-values?
If the null value (μ₀) is outside the 95% CI, then p < 0.05 → significant.
If μ₀ is inside the CI, then p > 0.05 → not significant.
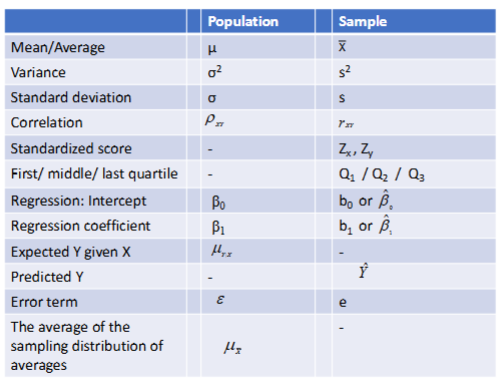
Some notation