Marine Fisheries Quiz #4
1/46
There's no tags or description
Looks like no tags are added yet.
Name | Mastery | Learn | Test | Matching | Spaced |
|---|
No study sessions yet.
47 Terms
Fecundity
Batch Spawning
Growth
Indeterminate
Mortality
Type III Curve
Maximum Age
Variable and Dependent on environment
AFR
Age at First Reproduction: Variable with latitude, critical life history characteristic for exploitation.
Affected by growth, density, and food availability.
Recruitment
Addition of new individuals to the fishable portion of the stock.
Meristics
Structure counts (fins)
Morphometrics
Shape differences
Parasite Load
Parasites from migrating species
Biochemical
Electrophoresis, allozymes, DNA
Isotopes
Composition of otolith aragonites to determine age.
Density-Dependent
Competition, predation, disease, spawning sites.
Density-Independent
Weather, temperature.
Year-Class Strength
Influenced by survival and recruitment of hatchlings.
Depensatory Mortality
Population decline due to low stock size.
Indeterminate Growth
Growth continues after sexual maturity.
Age Determination
Otoliths: Count annuli for age.
Back-Calculation: Fraser-Lee.
Cohort
Group of individuals within a stock spawned at the same time.
Age Class
Used to determine length-at-age.
Fraser-Lee Model
Li = [((Lc – a)/ORc) ORi ] + a
Lee’s Phenomenon
Older individuals back-calculate smaller at young ages than reality of young individuals.
Von Bertalanffy Model
Lt = L∞[1-e-K(t-t )]
Protogynous Hermaphrodite
Female to male. (Yellowfin Grouper)
Length-Weight Power Function
W = aLb
logW = log(a) + b(logL)
Isometric Growth
Shape of fish does not change. L/W=3
Allometric Growth
Fish grow thinner of heavier. L/W=<3<
Match/Mismatch
Food availability and spawning do not line up due to asynchronous life history changes effecting recruitment and growth.
Compensatory Effects
Higher growth response due to stunted fish seed. Not as strong as expected.
Protect BOFFFF
They enhance stock productivity.
Exponential Decay Model
Nt = Noe-Zt
A
Simple Mortality: Percentage of fish dying in a given time.
S
Survival: Complement of A.
Instantaneous Mortality Model
Z= -lnS
Capture Model
Ct = qftNt
Catch Curve
ln(Nt) = lnNo - Zt
-ln(Nt) = Y
-t = X
Large Representative Sample
Age Key
Ranking of fish ages used to assess population dynamics, growth rates, and life history strategies.
Assumptions of Catch Curve
Stable age structure, consistent recruitment, mortality, and catchability.
Year-Class Strength Variability
-Boom v. Bust years
-r-selected species fluctuate in YCS
How to Minimize Variability
-Eliminate anomalous year-classes
-Average Z for several successive years
-’Average Catch Curve’
John Hoenig
ln(Z) ~ 1.44 - 0.982 ln(tmax), r2=0.82
-Unexploited stocks
Natural Mortality Before Fishing Impact
Z = M + qf
r²
Variability in Y explained by X.
J.G. Shepherd Recruitment Model
R = aS / 1 + (bS)c
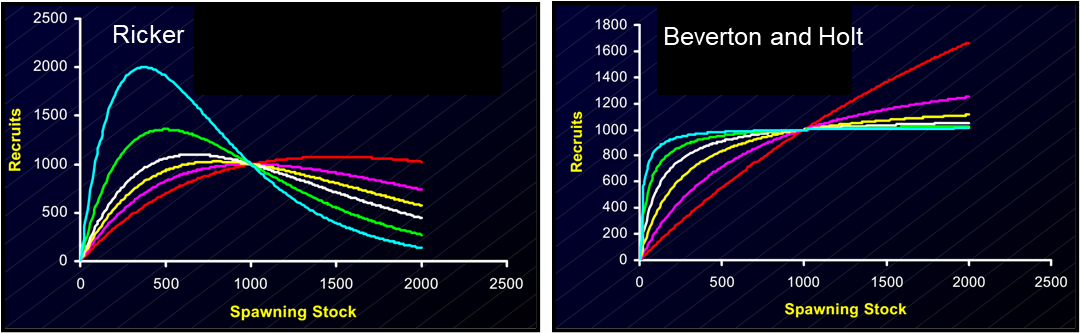
Ricker (1954)
High stock sizes lead to increased juvenile mortality.

Beverton-Holt (1957)
Competition among juveniles limits mortality.
Allee Effect
Recruitment drops at low spawner abundance due to difficulty in finding mates, lack of spawning cues for group spawners, ineffective schooling behavior for anti-predator defense.
Challenges in Recruitment Modeling
Reality is much more complex so modeling is unrealistic.